HAL Id: hal-00110715
https://hal.archives-ouvertes.fr/hal-00110715
Submitted on 16 Nov 2011HAL is a multi-disciplinary open access archive for the deposit and dissemination of sci-entific research documents, whether they are pub-lished or not. The documents may come from teaching and research institutions in France or abroad, or from public or private research centers.
L’archive ouverte pluridisciplinaire HAL, est destinée au dépôt et à la diffusion de documents scientifiques de niveau recherche, publiés ou non, émanant des établissements d’enseignement et de recherche français ou étrangers, des laboratoires publics ou privés.
Electrical conductivity evolution of non-saturated
carbonate rocks during deformation up to failure
Laurence Jouniaux, Maria Zamora, Thierry Reuschlé
To cite this version:
Laurence Jouniaux, Maria Zamora, Thierry Reuschlé. Electrical conductivity evolution of non-saturated carbonate rocks during deformation up to failure. Geophysical Journal International, Oxford University Press (OUP), 2006, 167, pp.1017-. �10.1111/j.1365-246X.2006.03136.x�. �hal-00110715�
Please, cite this article as: Jouniaux, L., M. Zamora, and T. Reuschlé, Electrical conductivity evolution of non-saturated carbonate rocks during deformation up to failure, Geophysical Journal International, 167, 1017-1026, 2006.
doi:10.1111/j.1365-246X.2006.03136.x contact: [email protected]
Electrical conductivity evolution of non-saturated carbonate rocks during
deformation up to failure.
Laurence Jouniaux, Institut de Physique du Globe de Strasbourg, CNRS UMR7516, France Maria Zamora, Institut de Physique du Globe de Paris, France
Thierry Reuschlé, Institut de Physique du Globe de Strasbourg, CNRS UMR7516, France
Key words : Electrical conductivity, electrical anisotropy, deformation, fluids in rocks, rock fracture, laboratory measurements
Abstract
We present electrical conductivity measurements (at a fixed frequency of 1kHz) performed on three directions on limestone samples from the quarry of Meriel, during uniaxial tests of deformation up to failure. Samples were saturated from 100% to 80% by drainage. The samples showed brittle fracture with Young’s modulus in the range 10-13 MPa. Formation factor (sample resistivity divided by water resistivity) values range between 2 and 4. In saturated conditions the electrical measurements reflect the initial rock compaction, followed by dilatancy due to new axial cracks formation and finally crack coalescence, fracture localization and failure. The conductivity increase is related to the crack porosity Φc which starts to increase at relatively low stress (31% of strength). The magnitude of the electrical conductivity variation is 1 - 4 % of the initial value. We show that when saturation is decreased the conductivity increase occurs earlier during the deformation process, from 68% to 17% of strength for 100% to 80% of water saturation respectively, so that the decrease in
conductivity at low stress is less and less present. The induced relative rock conductivity variation in non saturated and undrained conditions is the result of two competing effects : the relative porosity variation, and the relative saturation variation during the deformation process. During compaction the electrical conductivity can show either a small decrease or a small increase : since the size of the partially saturated pores and cracks is reduced, the water occupies a larger percentage of the pore space, and then conductivity can be increased at this stage. We show a continuous increase of the conductivity both during the compaction and the dilatancy phases when the initial saturation is about 80-85%. Finally a power law is shown between conductivity and stress, so that the relative electrical conductivity increase is larger as one goes along the compression process.
Just before failure, at 90-95% of strength, the rate increase in horizontal conductivity drops, so that the anisotropy between axial and radial conductivity is about 0.5-2%. At failure a drastic increase of this anisotropy can be seen, up to 5-6% (CME21, CME24, and CME13 samples).
Introduction
Electrical resistivity can be used in geophysics to investigate the structure or the deformation of the crust (Henry et al. 2003; Le Pennec et al. 2001; Jouniaux et al. 1999; Pezard 1990). Since the electrical resistivity is related to mechanical properties (Glover et al. 2000; David et al. 1999; Bernabé, 1986, 1995; Jouniaux et al. 1994), it can be used to detect fracture (Nover et al. 2000), or used for in situ stress determination (Cornet et al. 2003). The electrical conductivity is a combination of electrolytic conduction for the fluid-filled fractures and surface conduction for conductive alteration minerals, and depends on the degree of water
saturation of the rock (Guichet et al. 2003). Therefore it is also used to investigate the migration of fluids through crustal rocks, and to image active fault zones up to 10 km depth (Eberhart-Philipps et al. 1995)
Electrical properties of rocks have been studied in an attempt to find a physical basis for earthquake prediction. Changes in complex resistivity during laboratory creep experiments have suggested that it may be possible to identify earthquake nucleation regions through the use of standard electrical remote sensing techniques (Lockner & Byerlee, 1986). Changes in rock conductivity (DC or low frequency measurements) under deformation up to failure in triaxial experiments have been measured in laboratory and showed first a decrease in conductivity at low stresses, and then an increase in conductivity when stresses are further increased (Brace & Orange 1968; Brace 1975; Jouniaux et al. 1992; Glover et al. 1997). The rate of conductivity increase was shown to be larger when water was flowing through the sample (Jouniaux et al. 1992). Some of these experimental results were discussed in conjunction with the dilatancy-diffusion model to interpret the field observations of preseismic changes in crustal resistivity (Scholz et al. 1973; Brace 1975). However, as noted some time ago, many negative field observations have challenged the dilatancy-diffusion model (Takano et al. 1993).
Most of the previous experimental studies have focused on the resistivity changes under saturated conditions, which may not be representative of the shallow crust. Indeed, as a result of the magnetotelluric studies, it is well established that the upper crust is often anomalously resistive in comparison to the lower crust. This transformation occurs at depth of 13 to 20 km and is characterized by a decrease in resistivity of 1 to 3 orders of magnitude. The transition from high to low resistivity correlates with crustal temperature of about 400°C (Hyndman & Hyndman 1968; Hyndman & Shearer 1989; Marquis & Hyndman 1992; Thouret & Marquis 1994). An explanation for this anomalously resistive upper crust arises from the behaviour of
fluids in the H2O-CO2 system. When a H2O-CO2 solution cools to temperature of 300-400°C, a CO2-rich phase will begin to separate from the aqueous solution (Nesbitt 1993). The resistivity of this CO2-rich phase should be several orders of magnitude larger than the remaining aqueous solution (Olhoeft 1981). This may be especially effective in the upper brittle crust where permeability is largely a product of a few, relatively large fractures (Brace 1980). Consequently, even though fractures in the upper crust are probably largely saturated with a moderately conductiveaqueous solution, the upper crust may be anomalously resistive due to the insulating properties of discrete CO2-rich bubbles passing through the system (Nesbitt 1993). This leads to the conlusion that we need to know the behaviour of the electrical conductivity of rocks during deformation in non-saturated and non-drained conditions.
When the rock is not fully saturated the conductivity increases throughout the compaction (in uniaxial experiments: Parkhomenko & Bondarenko 1960; Yamazaki 1965, 1966), and the amplitude of conductivity increase drops when the saturation is increased (Yamazaki 1966). To have a better understanding of the rock structure evolution during deformation up to failure, and to track some precursory changes before rupture, we have focused on measurements of electrical properties of rock during deformation, and particularly the electrical anisotropy, which has not been measured in previous studies. Since the electrical conductivity is related to the water content and to the porous structure, specially crack connectivity, it can reflect the evolution of the rock structure during deformation.
It is usually accepted that faulting in compressive brittle fracture is induced by coalescence of microcracks formed prior to faulting, these microcracks being randomly distributed and subparallel to the maximum compressive stress (Brace et al. 1966), and the coalescence occurring near the peak stress. During the linear part of volumetric strain-stress evolution the minerals distort elastically and grains or part of grains shift slightly under the applied stress
and slide relative to each another (Brace et al. 1966). New cracks appear at pre-existing intergranular boundaries at the onset of dilatancy, and then at 50-75% of peak stress new transgranular cracks appear (Tapponier & Brace 1976; Fonseka et al. 1985). Small cracks grow stabily up to their coalescence leading to a macroscopic instability (Ashby & Sammis 1990). At later stages of deformation extensive crushing of particles into fine grained gouge becomes important (Wong 1982).
Electrical data obtained during uniaxial compression tests reflect the initial rock compaction, followed by dilatancy due to new axial crack formation and finally crack coalescence, fracture localization and failure. We present the results of uniaxial compression tests run on limestone samples partially and fully saturated with water. This is the first time, in our knowledge, that the electrical anisotropy is quantified during deformation, since electrical measurements have been performed in three directions. Moreover, in non-saturated conditions, unlike previous studies focused on very low saturations, we performed measurements at relatively high water saturation such as 80-100 %, which is more representative of the shallow crust.
Experimental procedure
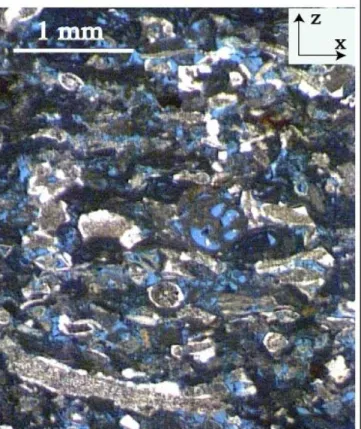
The studied samples come from the quarry of Meriel, France (Jouniaux et al. 1996; Morat & Le Mouël 1992; Morat et al. 1992). Meriel limestone is a bioclastic Lutetian limestone. Thin section of this limestone is shown in Figure 1. The sample was impregnated with blue epoxy resin to reveal the pore spaces and cracks. The rock is not homogeneous since some isolated large pores can be present. The grains and pores are aligned in the bedding plane (the X direction). The porosity of studied samples, measured by triple weight, varies from 35.4 to 37.6 % (Table 1). Measurements carried out on some samples taken beside our samples show
that air permeability (measured by the constant flow technique) ranges from 74 to 374 x 10-15
m2 (Jouniaux et al. 1996), and the access radii distribution shows peaks at 16 and 0.15 µm.
These carbonate rocks have been chosen for their high porosities, so that the expected electrical conductivity variation induced by the deformation should be a low one compared to the amplitude variation expected for low porosity rocks. For this study six parallelepedic (50 x 50 x 100 mm) samples were cut in the same block of rock. The rectangular geometry was chosen because it is more convenient for electrical anisotropy measurements and for further studies using acoustic sensors.
Samples were saturated under vaccum with salted (0.1 M NaCl) water (water conductivity was measured by a WTW LF330 conductivimeter and is ~1 S/m, see Table 1), at six saturation levels ranging from 100% to 80%. The electrical conductivity of the water is thought to be homogeneous inside the sample once it is saturated. Partial water saturation Sw was achieved by drainage of the sample, that is by drying the sample using a vacuum pump and placing it in a dessicator during 24 hours. The weight of the sample was measured to deduce the water saturation, the weight being measured before and after runs.
Samples were deformed up to failure under uniaxial compression at strain rate 3.5 to 6 x 10⁻⁷ s-1. Typical experiment lasted 4-5 hours. Loading stress was increased in small steps and
stress was held at 19 to 23 levels for periods of time 10-20 minutes to collect electrical data. The loading force and the axial displacement were measured, leading us to deduce the axial stress and the axial strain. The horizontal strains were not measured, so that the volumic deformation of the rock was not monitored.
Conductivity of the sample (a scheme of the sample is shown in Fig. 2) was measured in three directions (horizontal : x, y; axial or vertical: z) by a two-electrodes technique at a frequency of 1 kHz, using an HP impedance bridge. Electrodes consisted in silver paint on each surface. Impedance response of the sample at frequencies between 100 Hz and 20 kHz
showed a quasi-pure resistance with no capacitive effect (angle of the impedance is 0.08° to 1°) and a fixed frequency of 1kHz was chosen for our measurements during deformation because it is often the frequency at which the out-of-phase conductivity is minimized. Measurements at a fixed frequency 1 kHz were therefore performed for each step in axial stress. It allows us to compare our measurements to other available data (Jouniaux et al. 1992; Glover et al. 1997). The application of an electrical field gives rise to different physical and physico-chemical processes both in the bulk and on the interfaces of components (Knight & Endres 1990). Since the water used showed a conductivity of about 1 S/m, and since the used frequency is 1 kHz, it is thought that we are in the regime where the conductivity is dominated by volumic conductivity through water in pores and cracks and that surface conductivity is negligible. That is why the internal surface to volume ratio of the pores, which controls the relative importance of surface conduction processes in porous rocks (David et al. 1993) was not measured.
By measuring the electrical potential in one direction (x, y, or z) when a parallel current flows through a cross section of a sample, the impedancemeter measures the complex impedance Z of the sample, and the angle θ. The resistance R of the sample is deduced as
Zcos(θ). The conductivity of the sample is then calculated as σ = (L / R S) where L is the length of the sample, and S is the section area. Therefore the error on the rock conductivity is the sum of the errors on the measured resistance, the measured length, and the calculated section, and is ± 0.9 %. Anisotropy of conductivity between x, y, and z direction has been calculated as followed : σxz = (σz – σx) / σx, and its relative variation has been plotted. Note that experiments are performed in undrained regime.
Typical resistance measurements were of the order of 65 to 81 ohm in horizontal directions, and of 140 to 181 ohm in the axial direction, which lead to resistivity values of 3.6 - 4.5 to 1.9 - 2.5 ohm.m. The initial values of rock conductivities from 0.2 to 0.5 S/m are
given in Table 1.
Results
Since the sample is shortened during the axial compression test, its strain is the axial displacement measured by the press divided by the initial length of the sample. The axial stress is the loading force divided by the cross section of the sample, and the strength of the sample is the axial stress at failure.
Mechanical behaviour
Samples have been deformed up to 0.6-0.9 % in axial strain. They showed brittle axial fracture, the maximun stress ranged from 4.1 to 4.9 MPa, and Young’s modulus, obtained in the linear part of the curve, was 10-13 MPa (Table 1).
Electrical behaviour
Initial formation factors (water conductivity divided by rock conductivity) are 3.5 - 4.5 in horizontal directions and 1.9 - 2.4 in the axial direction (consistent with Jouniaux et al. 1996), showing that the samples are about twice more conductive in the axial direction than in the horizontal plane. Since the water conductivity σf is about 1 S/m, the initial value of rock
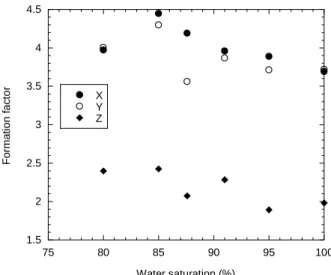
conductivities are between 0.2 and 0.5 S/m. Initial formation factors Fz, Fx, Fy have been plotted versus saturation (Fig. 3) and show a light decrease with increasing saturation.
Variations of the rock conductivity in X, Y, Z directions and variations of the anisotropy
variation is about 2 - 4% of the initial rock conductivity value.
We now describe the behaviour of the electrical conductivity of the six studied samples during the compression tests up to failure.
Sample CME21 was fully saturated and its porosity was 36.1%. The electrical conductivities first decrease. At 73% of the strength the horizontal conductivities increase up to failure, the total variation being about 1%. The axial conductivity tends to increase at low stress (37% of strength), but then decreases well before failure (68% of strength). At failure the axial conductivity increases by 2 %, whereas the horizontal conductivities decrease by 1-2%, σx decreasing less than σy (Fig. 4a).
Sample CME22 was saturated at 95%. The horizontal conductivities decrease by 0.5% up to 55% of strength, and then increase by 0.5% up to failure. The axial conductivity increases slowly at low stresses, and then increases more rapidly by 1.5% from 45% of the strength to final rupture. Just before failure, at 95% of strength, the rate increase is dropping, except for σx (Fig. 4b).
Sample CME24 was saturated at 91%. The electrical conductivities slowly increase up to 34% of strength, and then increase more rapidly, by 1.5-2% for σx, σy and 3% for σz up to failure. Before failure, at 91% of strength the rate increase of the horizontal conductivities is dropping (Fig. 4c).
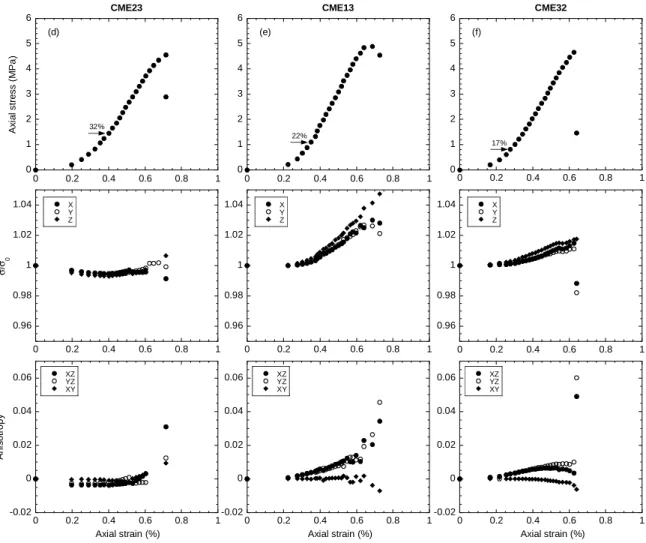
Sample CME23 was saturated at 87.6%. The electrical conductivities first decrease by 0.5-0.7% up to 32 % of strength. Then the electrical conductivity increase up to failure, by 0.8% and 1.4% for σy and σz respectively, except for σx that decreases from 60% of strength up to failure. Before failure, at 82% of strength the rate increase in σy is dropping. Note that some
σx data are missing, due to technical problems (Fig. 4d).
to 22% of strength, then increase up to failure, by 3 % for σx and σy, and 4% for σz. Before
failure, at 95% of strength, the rate increase of the horizontal conductivities is dropping (Fig. 4e).
Sample CME32 was saturated at 80%. The electrical conductivities slowly increase up to 17% of strength, and then increase more rapidly up to failure by 1-1.5%, with a dropping in rate increase at 85% of strength (Fig. 4f).
Discussion
Electrical conductivity at various saturations (intact samples)
The resistivity of the samples roughly increases when water saturation is decreased, as shown in Fig.3. This behaviour is consistent with the fact that the mineral grains act as an insulating matrix and conduction occurs solely through the pore fluid. The expression used to describe the variation of formation factor F with saturation Sw and porosity Φ is usually F =
Φ-m S
w-n (Archie 1942). Since we compare different samples in Figure 3, it may explain the
roughly feature of the increase of formation factor with decreasing saturation. When the sample is fully saturated (sample CME21), the m-value deduced from this expression is 1 ± 0.2 (consistent with Jouniaux et al. 1996), which is a low value for cementation exponent in carbonates (Focke & Munn 1985; Sen et al. 1997). The n-value deduced from the axial formation factor results (Fig. 3) is about 1, consistent with the observation that the n-value is close to the m-value (Waxman & Smits 1968). For the horizontal results, their dispersion does not allow us to derive a n-value. Especially the lower horizontal formation factor value at 80% water saturation and the dispersion observed at 87.6% saturation may be due to some heterogeneities in the horizontal lithology of the concerned samples.
Since our samples were saturated from 100% to 80%, we may assume that we are not in the saturation regime where the conductivity involves surface conduction. In low-saturation regime, a dramatic decrease in resistivity occurs when low-saturation is increased, up to the presence of a few monolayers of water on the internal rock surfaces (Knight & Dvorkin 1992). These few monolayers of water correspond to water saturation of 4 % to 10 % for the studied sandstones by Knight & Dvorkin (1992) and have been interpreted as the thickness of water layers for which the behaviour of water changes from that of a surface phase to that of a bulk phase (Knight & Dvorkin 1992). It can therefore be assumed that by using saturation between 80% and 100%, the main mechanism involved in the conductivity will be the conductivity of bulk water.
Effect of uniaxial compression on the electrical conductivity of fully saturated sample (CME21)
When the rock is saturated, and in drained conditions, the axial electrical conductivity is thought first to decrease, and then to increase with compression. At the beginning of the deformation process, the closure of pores and subhorizontal cracks full of water induces a decrease in conducting paths and the conductivity of the rock decreases. Then, when new axial cracks form in the rock and when water is available, these cracks become new conducting paths, and the conductivity of the rock increases. This behaviour has been observed in triaxial experiments on crystalline rocks (Brace & Orange 1968), on Fontainebleau sandstone (Jouniaux et al. 1992), and on Darley Dale sandstone (Glover et al. 1997). It has been shown by Brace & Orange (1968) that the increase of conductivity begins about when the rock becomes dilatant and that a rapid increase in conductivity accompanies the rapid increase in volume. Most of the time the magnitude of conductivity increase is much
more larger than the magnitude of conductivity decrease. This is not the case in our experiments, maybe because in uniaxial compression tests, the crack closure at low stress, which leads to a decrease in conductivity when in drained conditions, is more important than in triaxial compression tests, where the hydrostatic stress applied to the sample prior to triaxial testing has already partly closed the initial cracks.
In our study, measurements on CME21 sample which was fully saturated, show first a decrease and then an increase in horizontal conductivities, as expected for the axial conductivity. Note that the horizontal conductivity of a granite sample under triaxial deformation increased too (Brace & Orange 1968). But the behaviour of the axial conductivity is more complex with an unusual transient increase at about 70% of strength, roughly corresponding to the local minimum in the horizontal conductivity curves. Indeed in our uniaxial undrained experiments the sample is not connected to a water reservoir as it is usually the case in triaxial experiments, so that the available water volume is only the initial water volume present in the rock. The transient vertical conductivity increase may thus be explained by the differential closure of subhorizontal cracks with their water content being expelled into the opening vertical cracks. The following light decrease may then be due to a transient lack of water in the new axial cracks forming in the sample. Further closing of subhorizontal cracks leads to the increase of water saturation in axial cracks resulting, when combined to their coalescence, in the increase in axial conductivity and the decrease in horizontal conductivities at failure.
The increase rate of axial conductivity from 40 % to 70 % of strength is 0.13% / MPa, of the same order as the one observed by Brace & Orange (1968) on Pottsville sandstone (0.14% / MPa), and lies between the values obtained by Glover et al. (1997) on Darley Dale sandstone (0.06 %/ MPa) and those measured by Jouniaux et al. (1992) on Fontainebleau sandstone (0.2 to 0.6% / MPa). At failure, the 2% increase in the axial conductivity and the
decrease in horizontal conductivities confirm the subverticality of the final macroscopic fracture.
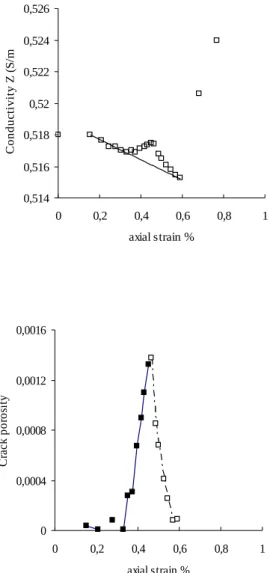
The conductivity increase is usually related to the crack porosity Φc, corresponding to new formed cracks, which is the difference between the actual volume change and the elastic volume change. The conductivity through cracks σc, which is obtained by substracting crack-free conductivity (that would be the linear decrease of the conductivity from the beginning of the compression test, Figure 5a: straightline) from total conductivity (the measured conductivity, Figure 5a: empty squares), was calculated and compared to the crack porosity by Brace & Orange (1968). These authors showed that the crack conductivity was proportional to the crack porosity, so that σc/σf = Φcm with m = 1 for their studied crystalline
rocks, whereas for the Pottsville sandstone m = 2. The m-value, deduced from two independent measurements (volume change and conductivity change), was shown to be constant during compression up to the failure (Brace & Orange 1968). The same approach has been used by Glover et al. (1996), who assumed a m-value equal to 2 to compute a damage parameter which is the crack porosity. The crack porosity Φc has been computed for CME21 sample (Fig. 5b), with the m-value deduced from the measurements of porosity and formation factor before the deformation test (m = 1), and assuming that this m-value is constant during compression, as shown by Brace & Orange (1968). It can be seen that the crack porosity starts to increase at 0.33% of axial strain, meaning 31% of strength, and increases up to 0.46% of strain (68% of strength). When the rock is saturated, the conductivity change can therefore be related to the crack porosity and according to this analysis, the compression of the sample leads first to a decrease in volume, and then to a volume increase up to 68% of strength. As noted previously a partial desaturation of new forming cracks may happen leading to a transient decrease of axial conductivity, and therefore a transient decrease of the deduced crack porosity (Fig. 5b, dotted-line), before their drastic increase as failure approaches.
Since the cracks induced by the deformation are created in the axial direction, this analysis is not suitable for horizontal electrical measurements. Moreover, note that the crack porosity is related to the electrical conductivity change only if the cracks are filled with water, which is not the case for the following not–fully saturated conditions.
Effect of water saturation on the electrical conductivity behaviour during uniaxial compression tests
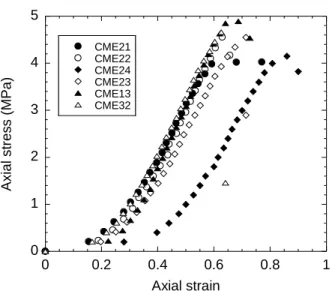
The largest variation in electrical conductivity during compression is usually in the axial direction (except for CME23 sample), in accordance to the fact that cracks are created in the axial direction during these uniaxial experiments. There is no obvious relation between the amplitude of conductivity increase and the water saturation, at least for the studied saturation range. When the water saturation is decreased, the electrical conductivity increase occurs earlier during compression (Fig. 6), so that the decrease in conductivity at low stress is less and less present (except for CME23 sample). The increase in conductivity occurs at 68%, 50%, 34%, 32%, 22%, and 17% of strength (see Figure 4) for the decreasing saturations of 100%, 95%, 91%, 87.6%, 85%, and 80% respectively. In order to compare the mechanical behaviour of the different samples, the axial stress has been plotted versus the axial strain on a single graph for the six studied samples (Figure 7). The samples show a similar mechanical behaviour, except sample CME24 which shows a rather compliant initial behaviour maybe due to the presence of subhorizontal flaws. Therefore the differences in the electrical conductivity variation during the compression will not be attributed to a possible mechanical difference, except possibly for the sample CME24.
Previous experiments on sedimentary rocks of high porosity (40-55%) under uniaxial compression at various water saturation from 2% to 25% showed an increase in electrical
conductivity with stress (Yamazaki 1965; 1966). The conductivity increase was 0.5% on lapilli tuff at 25% water saturation, 2.5% on tuffaceous sandstone at 9.5% of water saturation; and 1% on pumice tuff at 5.6% of water saturation. When the initial water saturation was increased from 2% to 25% in lapilli tuff samples, the magnitude of conductivity increase during the uniaxial compression tests dropped from 11% to 0.5% (Yamazaki 1966). As already mentioned by Brace & Orange (1968), when the rock is partially saturated, water films form only a partial network in the rock, and at low stress when cracks and pores are closed and porosity reduced, the connectivity of these films is increased. So that the initial conductivity is small and then increases with stress. Note that only a small water amount is needed to form a connected path throughout the sample, as low as one fifth of a monolayer of water on the internal rock surfaces, corresponding to water saturation below 1% for the sandstones studied by Knight & Dvorkin (1992).
However, the exact quantification of the involved processes both during the compression and in non-saturated and undrained conditions is hardly feasible. Some modelling exists that explains the decrease of electrical conductivity during the drainage of samples, leading to a decrease in water saturation, but without any deformation [see for exemple Brovelli et al. 2005]. Other modelling exists that explains the effect of stress (P), in hydrostatic conditions and in saturated and drained conditions, on the electrical conductivity [Kaselow & Shapiro 2004]. From Archie’s law in saturated conditions F = Φ-m, these authors deduced a variation
of the rock electrical conductivity σr as log (σf/σr) = A + KP –Bexp(-DP), the coefficients A,
K, B, and D being fitting parameters for a given set of measurements. The first and second
terms are related to the variation of the stiff porosity, and the last term is related to the compliant porosity. Note that in our case the pressure is the axial stress and not the hydrostatic pressure. From Figure 6 it seems that the behaviour of the samples can be splitted into two groups: for the first group corresponding to samples with higher water saturation values
(100%, 95%, and 87.6%, meaning samples CME21, CME22, and CME23) the electrical conductivity decreases during the compaction phase before increasing at higher stress values, for the second group corresponding to lower water saturation values (85% and 80%, meaning CME13 and CME32) the electrical conductivity increases from the beginning of the compression, the sample CME24 may be not comparable because of its different initial mechanical behaviour (Fig. 7).
In our case we should consider Archie’s law in unsaturated conditions (see above). The induced relative variation of the rock conductivity is given by:
δ
δ
δ
δ
S
m
n
S
σ
σ
Φ
σ
r
r
=
σ
f
f
+
Φ
+
w
w
Water conductivity σf being constant, the first term is equal to zero. We can therefore see
that two competing effects are present in non saturated and undrained conditions: the relative variations of porosity Φ and saturation Sw during compression.
At low stress, when the rock volume is decreasing and pores or sub-horizontal cracks are closing, the saturation is increasing since the water volume is constant. The water is expelled from closing cracks and distributed in the still open porous network. At this stage, the porosity decreases (the second term is negative) and the saturation increases (the last term is positive). The result of these competing effects depends on the initial saturation: a small decrease or almost constant axial and horizontal conductivity is observed for the first group of samples (higher water saturation), a small increase is observed for the second group (lower water saturation) (Figs. 4 and 6).
When stress is further increased the electrical conductivity of partially saturated rocks increases, both in axial and horizontal directions. This increase occurs earlier during the compression process when the initial water saturation is lower (Figs. 4 and 6). During dilatancy the porosity increases and the saturation decreases, so that the two terms in the
equation of the conductivity variation are still in competition. The result of these competing effects shows that the connected path of water is eventually enhanced, both in the axial and horizontal directions (Fig. 6).
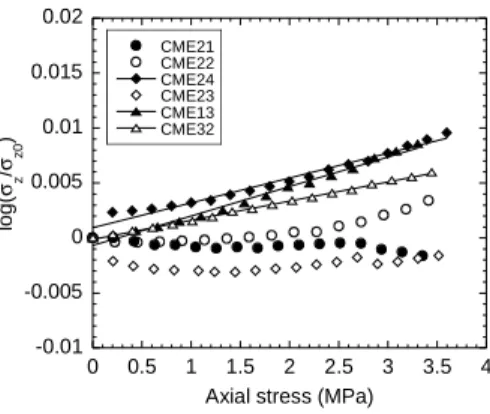
We finally plot the logarithm of the rock conductivity versus the axial stress (Fig. 8) in order to quantify the effect of stress on the evolution of rock conductivity in a similar way as that followed by Kaselow & Shapiro (2004). This analysis is done before the dilatancy onset at about 3.5 MPa (Fig. 7) to only take into account the initial crack population.
For highly saturated samples CME21 (100%) and CME22 (95%) the variation of the logarithm of the conductivity is not a straightline, neither for CME23 sample. On the contrary, for lower saturation, that is for samples CME32 (80%), CME13 (85%), and CME24 (91%), a linear relationship exists in the axial (z) direction between the logarithm of the rock conductivity and stress with a slope of 0.0017, 0.0027 and 0.0023 MPa-1 respectively,
confirming that there is no clear relation between the amplitude of electric conductivity variation during compression and the initial water saturation value, at least in the studied range. In the horizontal directions, the slopes are 0.0011, 0.002, 0.0017 (in y direction), and 0.0013, 0.002, 0.0019 (in x direction) for samples CME32, CME13, and CME24 respectively. The slope is therefore about 35% larger in axial direction than in the horizontal directions, which is consistent with the fact that cracks are created in the axial direction. Moreover, note that in undrained and non saturated conditions, the linear relationship observed between log σr and stress means that the relative increase in the electrical conductivity is larger as one goes along the compression.
Evolution of the anisotropy of electrical conductivity during compression
in the radial plane. The anisotropy between axial and radial directions is larger, about 1 to 4%, because during compression new cracks are created in the axial direction. We note that there is usually a continuous small increase in the anisotropy between axial and radial directions during the compression test, except the transient decrease in sample CME21. It results that the anisotropy between axial and radial directions is about 0.5-2% just before failure. At failure a drastic increase of this anisotropy can be seen, up to 5-6% (CME21, CME24, and CME13 samples).
Conclusion
When the rock is fully saturated the electrical conductivity first decreases, and then increases during the uniaxial compression test. Although our experiments are performed on highly porous sedimentary rocks, the magnitude of the rock conductivity variation is of the same order, meaning 1 – 4 %, as the one measured usually on granite or sandstone, and most of the time under triaxial deformation. We show that when saturation is decreased the conductivity increase occurs earlier in the compression process, from 68% to 17% of strength for 100% to 80% of water saturation respectively. Therefore the decrease in conductivity at low stress is less and less present. Continuous increase of electrical conductivity due to compression is measured as soon as the saturation is decreased to 85%. For low saturation levels such as 80 – 85 %, the compression phase leads to an increase in axial conductivity,
roughly following a power law
0.002
10
P
r
σ
:
, where P is the axial stress in MPa. It is usually suggested to interpret the field observations of preseismic change in crustal resistivity in the light of laboratory measurements performed in saturated conditions. Although an upscaling of laboratory measurements to in-situ measurements is not simple, we suggest that a continuous
increase of electrical conductivity due to compression should be probably expected as soon as
the rocks are not fully saturated. These non-saturated conditions are more representative of the shallow crust. However at the scale of the sample the electrical conductivity increase is only about 1 - 4%. Moreover a drastic increase in the anisotropy of electrical conductivity at fracture could be expected, and at the scale of the sample the anisotropy beween axial and radial directions can be observed up to 5-6% at rupture.
Acknowledgments
This work was supported by CNRS-INSU-PNRN Risques Sismiques and GdR Géomécanique des roches profondes. We thank G. Nover and an anonymous referee for their constructive comments.
REFERENCES
Archie, G.E., 1942, The electrical resistivity log as an aid in determining some reservoir characteristics: Trans. Am. Inst. Min. Meta. & Petrol.. Eng., 146, 54-67.
Ashby, M.F. & Sammis, C.G., 1990, The damage mechanics of brittle solids in compression,
Pure Appl. Geophys., 133, 489-521.
Bernabé, Y., 1995, The transport properties of networks of cracks and pores, J. Geophys. Res.,
100, 4231-4241.
Bernabé, Y., 1986, Pore volume and transport properties changes during pressure cycling of several crystalline rocks, Mech. Mater., 5, 235-249.
Brace, W.F. & Orange, A.S., 1968, Electrical resistivity changes in saturated rocks during frature and frictional sliding, J. Geophys. Res., 73, 1433-1445.
Geophys., 113, 207-217.
Brace, W.F., 1980, Permeability of crystalline and argillaceaous rocks, Inter. J. Rock Mech.
Min. Sci. Geomech. Abst., 17, 241-251.
Brace, W.F., Paulding, B.W. & and Scholz, C., 1966, Dilatancy in the fracture of crystalline rocks, J. Geophys. Res., 71, 3939-3953.
Brovelli, A., Cassiani, G., Dalla, E., Bergamini, F., Pitea, D. & Binley, A.M., 2005, Electrical properties of partially saturated sandstones : Novel computational approach with hydrogeophysical applications, Water Resour. Res., 41, W08411, doi:10.1029/2004WR003628.
Cornet, F. H., Doan, M.L. & Fontbonne, F., 2003, Electrical imaging and hydraulic testing for a complete stress determination, Int. J. Rock Mech. Min. Sci., 40, 1225-1241,.
David, C., Menendez, B. & Darot, M., 1999, Influence of stress-induced and thermal cracking on physical properties and microstructure of La Peyratte granite, Int. J. Rock Mech. Min.
Sci., 36, 433-448.
David, C., Darot, M. & Jeanette, D., 1993, Pore structures and transport properties of sandstone, Transp. Porous Media, 11, 161-177.
Eberhart-Philipps, D., Stanley, W.D., Rodriguez, B.D. & Lutter,W.L., 1995, Surface seismic and electrical methods to detect fluids related to faulting, J. Geophys. Res., 100, 12919-12936.
Focke, J.W., & Munn, D., 1985, Cementation exponents in Middle Eastern carbonate reservoirs, presented at Middle Eastern Oil Show, Bahrain, Soc; Pet. Eng., Pap. SPE 13735, 431-442.
Fonseka, G.M., Murell, S.A.F. & Barnes, P., 1985, Scanning electron microscope and acoustic emission studies of crack development in rocks, Int. J. Rock Mech. Min. Sci. &
Glover, P.W.J., Gomez, J.B. & Meredith, P.G., 2000, Fracturing in saturated rocks undergoing triaxial deformation using complex electrical conductivity measurements : Experimental study, Earth Planet. Sci. Lett., 183, 201-213.
Glover, P.W.J., Gomez, J.B., Meredith, P.G., Boon, S.A., Sammonds, P.R. & Murrel, S.A.F., 1996, Modelling the stress-strain behavior of saturated rocks undergoing triaxial deformation using complex electrical conductivity measurements, Surv. Geophys., 17, 307-330.
Glover, P.W.J., Gomez, J.B., Meredith, P.G., Hayashi, K., Sammonds, P.R. & Murrel, S.A.F., 1997, Damage of saturated rocks undergoing triaxial deformation using complex electrical conductivity measurements : Experimental results, Phys. Chem. Earth, 22, 57-61.
Guichet, X., Jouniaux, L. & Pozzi, J.P., 2003, Streaming potential of a sand column in partial saturations conditions, J. Geophys. Res., 108, 2141, doi:10.1029/2001JB001517.
Henry, P., Jouniaux, L., Screaton, E.J., Hunze, S. & Saffer, D.M., 2003, Anisotropy of electrical conductivity record of initial strain at the toe of the Nankai accretionary wedge,
J.Geophys.Res.,108, 2407, doi:10.1029/2002JB002287.
Hyndman, R.D. & Hyndman, D.W., 1968, Water saturation and high electrical conductivity in the lower continental crust, Earth Planet. Sci. Lett., 4, 427-432.
Hyndman, R.D., & Shearer, P.M., 1989, Water in the lower continental crust: modelling magnetotelluric and seismic reflection results, Geophys. J. Int., 98, 343-365, .
Jouniaux, L., Pozzi, J.P., Berthier, J. & Massé, P., 1999, Detection of fluid flow variations at the Nankai Trough by electric and magnetic measurements in boreholes or at the seafloor,
J. Geophys. Res., 104, 29293-29309.
Jouniaux, L., Dubet, L., Zamora, M., & Morat P., 1996, Physical properties of limestone from the quarry of Mériel, C. R. Acad. Sci. Paris, 322, série IIa, 361-367.
potential and resistivity of a claystone from the Nankai prism under stress, Geophys. Res.
Lett., 21, 149-152.
Jouniaux, L., Pozzi, J.P., Brochot, M. & C. Philippe, C., 1992, Resistivity changes induced by triaxial compression in saturated sandstones from Fontainebleau (France), C. R. Acad. Sci.
Paris, 315, Série II, p.1493-1499.
Kaselow, A. & Shapiro, S.A., 2004, Stress sensitivity of elastic moduli and electrical resistivity in porous rocks, J. Geophys. Eng., 1, 1-11.
Knight, R. & Dvorkin, J., 1992, Seismic and electrical properties of sandstones at low saturations, J. Geophys. Res., 97, 17425-17432.
Knight, R. & Endres, A., 1990, A new concept in modeling the dielectric response of sandstones: Defining a wetted rock and bulk water system, Geophysics, 55, 586-594.
Le Pennec, J.-L., Hermitte, D., Dana, I., Pezard, P., Coulon, C., Cochemé, J.-J., Mulyadi, E., Ollagnier, F. & Revest, C., 2001, Electrical conductivity and pore-space topology of Merapi lavas : implications for the degassing of porphyritic andesite magmas, Geophys.
Res. Lett., 28, 4283-4286.
Lockner, D.A. & Byerlee, J.D., 1986, Changes in complex resistivity during creep in granite,
Pure Appl. Geophys., 124, 659-676.
Marquis, G. & Hyndman, R.D., 1992, Geophysical support for aqueous fluids in the deep crust: seismic and electrical relationships, Geophys. J. Int., 110, 91-105.
Morat, P. & Le Mouël, J.L., 1992, Signaux électriques engendrés par des variations de contrainte dans des roches poreuses non saturées, C. R. Acad. Sci. Paris, 315, Série II, 955-963.
Morat, P., Le Mouël, J.L., Nover, G. & Will, G., 1992, Variation annuelle de la saturation d’une roche de grande porosité induite par la variation saisonnière de la température extérieure et mesurée par voie électrique, C. R. Acad. Sci. Paris, 315, Série II, 1083-1092.
Nesbitt, B.E., 1993, Electrical resistivities of crustal fluids, J. Geophys. Res., 98, 4301-4310. Nover, G., Heikamp, S. & Freund, D., 2000, Electrical Impedance Spectroscopy used as a tool
for the detection of fractures in rock samples exposed to either hydrostatic or triaxial pressure conditions, Nat. Hazards, 21, 317-330.
Olhoeft, G.R., 1981, Electrical properties of granite with implications for the lower crust, J.
Geophys. Res., 86, 931-936.
Parkhomenko, E.I. & Bondarenko, A.T., 1960, Effect of unilateral pressure on electrical resistance of rocks, Bull. Acad. Sci. USSR, Geophysics Ser., 2, 214-219 (english version). Pezard, P., 1990, Electrical properties of Mid-Ocean ridge basalt and implications for the
structure of the upper oceanic crust in Hole 504 B, J. Geophys. Res., 95, 9237-9264.
Scholz, C.H., Sykes, L.R. & Aggarwal, Y.P., 1973, Earthquake prediction: a physical basis,
Science, 181, 803-810.
Sen, P. N., Kenyon, W. E., Takezaki, H. & Petricola, M.J., 1997, Formation factor of carbonate rocks with microporosity: model calculations, J. Petroleum Science and
Engineering, 17, 345-352.
Takano, M., Yamada, I. & Fukao, Y., 1993, Anomalous electrical, resistivity of almost dry marble and granite under axial compression, J. Phys. Earth, 41, 337-346.
Tapponier, P. & Brace, W.F., 1976, Development of stress-Induced microcracks in Westerly granite, Int. J. Rock Mech. Min. Sci. Geomech. Abstr., 13, 103-112.
Thouret, L.R. & Marquis, G., 1994, Deep fluids and electrical conductivity of the lower continental crust, C.R.Acad. Sci. Paris, 318, Ser.II, 1469-1482.
Waxman, M.H., & Smits, L.J.M., 1968, Electrical conductivities in oil-bearing shaly sands,
Trans. AMIE, 243, 107-122.
Wong, T.-f., 1982, Micromechanics of faulting in Westerly granite, Int. J. Rock Mech. Min.
Yamazaki, Y., 1965, Electrical conductivity of strained rocks, laboratory experiments on sedimentary rocks, Bull. Earthquake Research Institute, 43, 783-802.
Yamazaki, Y., 1966, Electrical conductivity of strained rocks, further experiments on sedimentary rocks, Bull. Earthquake Research Institute, 44, 1553-1570.
Contacting author : Laurence Jouniaux,
Institut de Physique du Globe de Strasbourg - UMR 7516 5, rue René Descartes, 67084 Strasbourg Cedex
tel: 33.3.90.24.03.34, fax: 33.3.90.24.01.25 em: [email protected]
Figures and Tables
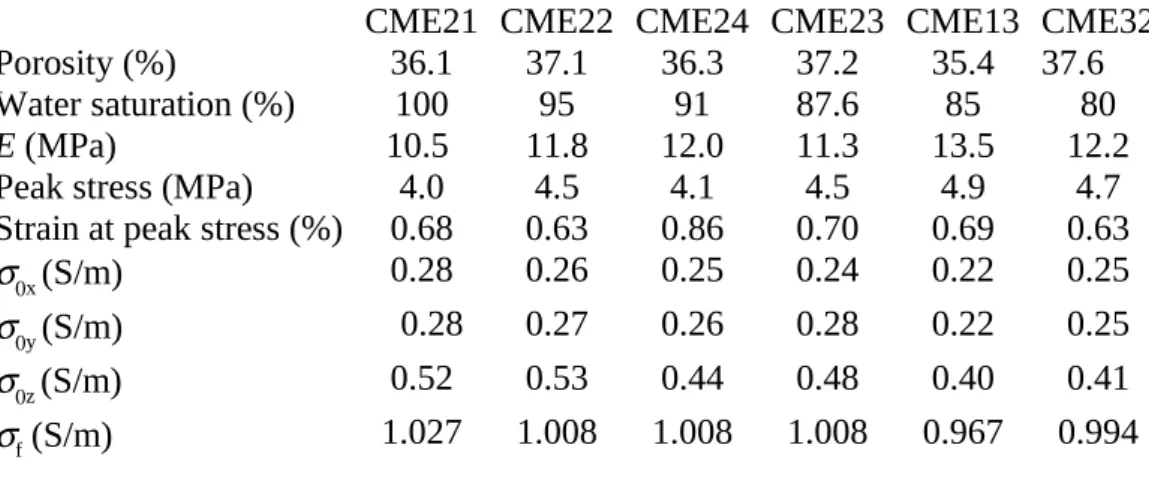
CME21 CME22 CME24 CME23 CME13 CME32 Porosity (%) 36.1 37.1 36.3 37.2 35.4 37.6 Water saturation (%) 100 95 91 87.6 85 80
E (MPa) 10.5 11.8 12.0 11.3 13.5 12.2
Peak stress (MPa) 4.0 4.5 4.1 4.5 4.9 4.7 Strain at peak stress (%) 0.68 0.63 0.86 0.70 0.69 0.63
σ0x (S/m) 0.28 0.26 0.25 0.24 0.22 0.25
σ0y (S/m) 0.28 0.27 0.26 0.28 0.22 0.25
σ0z (S/m) 0.52 0.53 0.44 0.48 0.40 0.41
σf (S/m) 1.027 1.008 1.008 1.008 0.967 0.994
Table 1. Porosity, water saturation, Young’s modulus (E), peak stress, strain at peak stress,
Figure 1. Thin section of Meriel limestone. The porous network is represented by blue epoxy.
1.5 2 2.5 3 3.5 4 4.5 75 80 85 90 95 100 X Y Z F o rm a ti o n f a c to r Water saturation (%)
Figure 3. Initial formation factor in the three directions X, Y, Z versus water saturation of the
0 1 2 3 4 5 6 0 0.2 0.4 0.6 0.8 1 CME21 A xi a l s tr e ss ( M P a ) (a) 68% 0.96 0.98 1 1.02 1.04 0 0.2 0.4 0.6 0.8 1 X Y Z σ / σ0 -0.02 0 0.02 0.04 0.06 0 0.2 0.4 0.6 0.8 1 XZ YZ XY A n is o tr o p y Axial strain (%) 0 1 2 3 4 5 6 0 0.2 0.4 0.6 0.8 1 CME22 (b) 50% 0.96 0.98 1 1.02 1.04 0 0.2 0.4 0.6 0.8 1 X Y Z -0.02 0 0.02 0.04 0.06 0 0.2 0.4 0.6 0.8 1 XZ YZ XY Axial strain (%) 0 1 2 3 4 5 6 0 0.2 0.4 0.6 0.8 1 CME24 (c) 34% 0.96 0.98 1 1.02 1.04 0 0.2 0.4 0.6 0.8 1 X Y Z -0.02 0 0.02 0.04 0.06 0 0.2 0.4 0.6 0.8 1 XZ YZ XY Axial strain (%)
0 1 2 3 4 5 6 0 0.2 0.4 0.6 0.8 1 CME23 A x ia l s tr e s s ( M P a ) (d) 32% 0.96 0.98 1 1.02 1.04 0 0.2 0.4 0.6 0.8 1 X Y Z σ / σ0 -0.02 0 0.02 0.04 0.06 0 0.2 0.4 0.6 0.8 1 XZ YZ XY A n is o tr o p y Axial strain (%) 0 1 2 3 4 5 6 0 0.2 0.4 0.6 0.8 1 CME13 (e) 22% 0.96 0.98 1 1.02 1.04 0 0.2 0.4 0.6 0.8 1 X Y Z -0.02 0 0.02 0.04 0.06 0 0.2 0.4 0.6 0.8 1 XZ YZ XY Axial strain (%) 0 1 2 3 4 5 6 0 0.2 0.4 0.6 0.8 1 CME32 (f) 17% 0.96 0.98 1 1.02 1.04 0 0.2 0.4 0.6 0.8 1 X Y Z -0.02 0 0.02 0.04 0.06 0 0.2 0.4 0.6 0.8 1 XZ YZ XY Axial strain (%)
Figure 4. Axial stress, rock conductivity, and electrical anisotropy, versus axial strain. 4a:
CME21 sample; 4b: CME22 sample; 4c: CME24 sample; 4d: CME23 sample; 4e: CME13 sample; 4f: CME32 sample.
0,514 0,516 0,518 0,52 0,522 0,524 0,526 0 0,2 0,4 0,6 0,8 1 axial strain % C on du ct iv it y Z (S /m ) 0 0,0004 0,0008 0,0012 0,0016 0 0,2 0,4 0,6 0,8 1 axial strain % C ra ck p or os it y
Figure 5. (a) Measured axial conductivity and the linear decrease of conductivity during the
compression phase, for CME21 sample. (b) Crack porosity Φc during compression, deduced
0.98 0.99 1 1.01 1.02 1.03 1.04 1.05 0 1 2 3 4 5 CME21 CME22 CME24 CME23 CME13 CME32 σx / σx0
Axial stress (MPa)
0.97 0.98 0.99 1 1.01 1.02 1.03 1.04 1.05 0 1 2 3 4 5 CME21 CME22 CME24 CME23 CME13 CME32 σy / σy0
Axial stress (MPa)
0.99 1 1.01 1.02 1.03 1.04 1.05 0 1 2 3 4 5 CME21 CME22 CME24 CME23 CME13 CME32 σz / σz0
Axial stress (MPa)
0 1 2 3 4 5 0 0.2 0.4 0.6 0.8 1 CME21 CME22 CME24 CME23 CME13 CME32 A xi al s tr es s (M P a) Axial strain
Figure 7. Axial stress versus axial strain for the six studied samples.
-0.01 -0.005 0 0.005 0.01 0.015 0.02 0 0.5 1 1.5 2 2.5 3 3.5 4 CME21 CME22 CME24 CME23 CME13 CME32 lo g ( σx / σx0 )
Axial stress (MPa)
-0.01 -0.005 0 0.005 0.01 0.015 0.02 0 0.5 1 1.5 2 2.5 3 3.5 4 CME21 CME22 CME24 CME23 CME13 CME32 lo g ( σy / σy0 )
-0.01 -0.005 0 0.005 0.01 0.015 0.02 0 0.5 1 1.5 2 2.5 3 3.5 4 CME21 CME22 CME24 CME23 CME13 CME32 lo g( σz / σz0 )
Axial stress (MPa)