Determining Phosphate Levels in Natural Water
Using a Novel Electrochemical Measurement
MASSACHUSETTSNSTITUTE
Device
OF TECHNOLOGYby
FEB
0 5
2020
Gee
Hoon Park
LIBRARIES
C
B.S.,
Seoul National University (2013)
S.M., Massachusetts Institute of Technology (2015)
Submitted to the Department of Mechanical Engineering
in partial fulfillment of the requirements for the degree of
Doctor of Philosophy
at the
MASSACHUSETTS INSTITUTE OF TECHNOLOGY
February 2020
© Massachusetts Institute of Technology 2020. All rights reserved.
Signature redacted
A u th o r ...
Department of Mechanical Engineering
Sep 18, 2019
Signature
redacted-C ertified by ...
...
Ian W. Hunter
Hatsopoulos Professor of Mechanical Engineering
(is
Supervisor
Signature
redacted-A ccepted by ...
...
Nicolas G. Hadjiconstantinou
Chairman, Department Committee on Graduate Theses
Determining Phosphate Levels in Natural Water Using a
Novel Electrochemical Measurement Device
by
Gee Hoon Park
Submitted to the Department of Mechanical Engineering on Sep 18, 2019, in partial fulfillment of the
requirements for the degree of Doctor of Philosophy
Abstract
Current measurement of the phosphorus level in natural water are based on the phos-phomolybdenum blue (PMB) method. In this method, the phosphate and molybdate ion form 12-molybdophosphoric acid (12-MPA) which is reduced to yield intensely coloured PMB, and its intensity is correlated with the phosphate concentration us-ing spectrophotometry. Despite its well-established sensitivity and selectivity to the phosphate ion, commercially available in situ portable measurement devices suffer from their large footprints and limited working time. This is mainly because the wet chemistry of the PMB method requires a constant supply of liquid reagents of which volume determines the footprint and working time of the device. Such limi-tations of the existing methods make it difficult to access the temporal and spatial information of the phosphorus level in natural water which is crucial in the control of eutrophication.
In this thesis, we designed, fabricated, and evaluated two novel electrochemical phosphate detection devices that offer unique opportunities to be developed into portable, in-situ, and automated phosphate detection devices. The detection of phos-phate is based on the formation of 12-MPA, wherein reagents are supplied in situ
by the anodic dissolution of molybdenum (Mo). The first version of the device with
two Mo electrodes in two separate chambers demonstrated that reducing the sample volume of the device reduces the time of detection and the energy consumption per measurement based on the Mo oxidation, when compared to the current state of the art (2 min and 900 mJ versus 70 min and 18 J, respectively). The second version device is improved further by simplifying the system into a single chamber with a single Mo electrode, which additionally decreases the response time to 30 s and the energy consumption to 4 mJ.
The experimental results with these two devices demonstrate the capability of phosphate determination (0.1 to 25 pM) in a high conductivity background solution
(0.1 M NaCl), such as seawater, without significant interference from silicate ions. In
addition, the second version of the device broadens its application into other types of natural water with low conductivity, and provides a promissing possibility to be
further developed into an open-cell type sensor.
Thesis Supervisor: Ian W. Hunter
Acknowledgments
I would like to first thank Prof. Ian Hunter for both the opportunities and education he has provided. Through his endless passion in the research and inventions towards new technologies, he has given me lots of motivations and inspirations about what kind of engineer I would want to be.
I would also like to thank Prof. Yang Shao-Horn and Pro. Betar Gallant for
understanding and being patient about my ignorance in electrochemistry and filling me with many important advises and questions that were missed in my thesis.
I also thank Prof. David Trumper for giving me opportunities to gain a lot of important knowledge in mechatronics and control theories from his many classes as a student and TA.
Many thanks to former and current members of MIT Bioinstrumentation Lab for always being wonderful teachers, co-workers and friends.
Thanks to all my friends. Especially my buddies in Korea for always supporting me even though we are far away, Minkyun Noh for bringing me into MIT and being such a good mentor and friend ever since we met in undergrad, Nick Demas for always cheering me up and giving me positive energies, and Kyle Wilke for being a great friend who always tries to understand me.
I would also like to give tremendous thanks to my mother, father and my brother
for their endless supports and love. It is now my turn to give them all back to you. Lastly, my dear two best friends EJ and Damin. I can't find any other words for you guys, other than you two mean everything to me.
Contents
1 Background 1.1 Phosphorus . . . . 1.2 Eutrophication 1.2.1 Assessment of Eutrophication . . . . . 1.2.2 Control of Eutrophication . . . .1.3 Measuring Phosphorus in Natural Water . . .
1.3.1 Phosphorus in Natural Water . . . . .
1.3.2 Phosphorus Measurement Technologies
1.3.3 Current Shortcomings . . . .
1.3.4 Reagent-less Phosphate Detection . . .
1.3.5 Recent Advances in Portable Phosphate
1.4 Square Wave Voltammetry . . . .
1.5 Aim of This Thesis . . . .
1.6 Thesis Outline . . . .
Detection
2 Sensing Mechanism
2.1 In situ Generation of Reagent Using Anodic Dissolution of Mo 2.2 Microvolume Device . . . . 2.3 Important Electrochemistry . . . .
2.3.1 Molybdate Speciation . . . .
2.3.2 Optimal Condition of 12-MPA . . . .
2.3.3 Interference of Silicate . . . . 21 21 . . . . 2 3 24 28 34 34 36 38 41 44 44 49 49 51 51 57 58 58 61 63
3 Understanding Electrochemistry 3.1 Mo Oxidation . . . . 3.1.1 Experimental Setup.... 3.1.2 Experimental Results. 3.2 Micro pH Electrode . . . . 3.2.1 EIROF Fabrication.... 3.2.2 pH Meter . . . . 3.2.3 EIROF pH Measurement . . 3.3 12-MPA Measurement . . . . 3.3.1 Experimental Setup .... 3.3.2 Experimental Results. 3.4 Electrode Contamination . . . .
4 Micro-volume Device Development 4.1 Design Process . . . .
4.1.1 Requirements . . . . . 4.1.2 Design Challenges . . .
4.1.3 Design Strategy . . . . 4.2 Version 1 . . . . 4.2.1 Design and Fabrication 4.2.2 Experimental Setup . . 4.2.3 Experimental Results . 4.3 Simulation . . . . 4.3.1 Modeling . . . . 4.3.2 Governing Physics . 4.3.3 Simulation Results . 4.4 Devise Revision 1 . . . . 4.4.1 Optimization . . . . . 4.4.2 12-MPA Measurement 4.5 Device Revision 2 . . . . 69 69 69 72 73 74 75 76 79 79 80 82 89 89 89 91 92 94 94 95 97 99 100 100 105 108 108 120 127
4.6 Potentiostat . . . .
5 Double Molybdenum Phosphate Sensor 5.1 Experimental Methods . . . . 5.2 Molybdenum Oxidation . . . . . 5.2.1 Molybdenum Potential . . 5.2.2 Impedance Measurement . 5.3 Phosphate Detection . . . . 5.3.1 Negative Control . . . . . 5.3.2 Mo Optimization . . . . . 5.3.3 Phosphate Concentration . 5.3.4 Silicate Interference . . . . 5.4 Summary of DMPS . . . .
6 Single Molybdenum Phosphate Sensor
6.1 M otivation . . . . 6.2 Device Design . . . . 6.3 Phosphate Detection . . . . 6.3.1 Negative Control . . . . 6.3.2 Mo Optimization . . . . 6.3.3 Phosphate Detection . . . .
6.4 SM PS in Low Conductivity Background . . . .
6.5 Open-cell SMPS . . . .
6.5.1 Device Design . . . .
6.5.2 Experimental Results . . . .
6.6 Summary . . . .
7 Future Work and Conclusion
7.1 Future W ork . . . . 7.2 Conclusion . . . . Bibliography 127 133 133 137 137 139 140 140 144 146 150 152 157 157 160 160 160 163 167 172 178 179 179 181 187 187 190 193
List of Figures
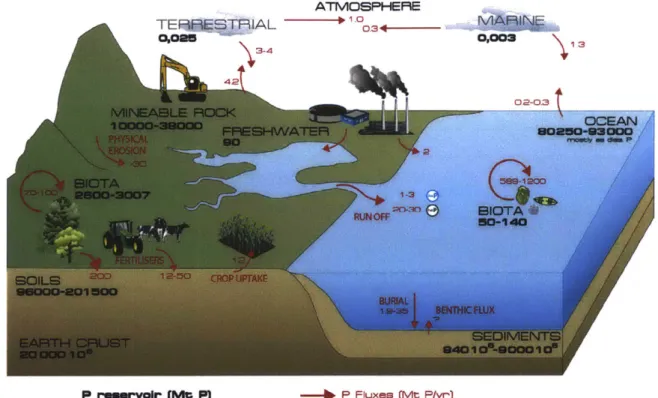
1-1 A schematic diagram of the phosphorus cycle . . . . 23
1-2 Consumption of phosphate fertilizers in Tg P205 in the world per con-tinent during the period 1960 to 2012. . . . . 24
1-3 Proportion of NES lakes that exhibited improvement, degradation, or
no change in phosphorus concentration (left) and chlorophyll a (right) based on the comparison of national eutrophication survey conducted in 1972 and 2007. ... .26
1-4 Tropic state of lakes based on chlorophyll concentration measured in the lower continental US in 2007. . . . . 27 1-5 Primary production in the Kattegat, Denmark. . . . . 28
1-6 Partial pressureof CO2 at a depth of 1 m in Lake 227. . . . . 29
1-7 Consumption of phosphorus in detergent manufacturing and number of States with phosphate detergent bans, 1940 to 1998. . . . . 30 1-8 Demostration of the vital role of phosphorus in the control of
eutroph-ication . . . . 31 1-9 Time courses of seasonal means of total phosphorus, chlorophyll a and
cyanobacterial biovolume in 8 lakes: Barton Broad, Lake Balaton, Onondaga Lake, Lake Washington, Lago Maggiore, Lake Constance, Schlachtensee, Lake Tegel. . . . . 33 1-10 Mean response of phytoplankton to nitrogen (+N), phosphorus (+P),
or N+P additions in 20 whole-lake experiments. . . . . 35 1-11 The various operationally defined P fractions in natural waters, based
1-12 Commercially available portable phosphate measurement devices. . . 41
1-13 Concentration profile of the isotropic Raman spectra in the P-O stretch-ing region of aqueous K3PO4 solutions. . . . . 42
1-14 Fourier transform infrared spectra measured in different concentrations of N a2H PO 4. . . . . 43
1-15 Photograph of the micro phosphate analyser. . . . . 45
1-16 Automated microfluidic flow loop analyzer. . . . . 46
1-17 Potential and current profile of square wave voltammetry. . . . . 48
2-1 Schematics of the operation of the phosphate detection device using annodic dissolution of molybdenum for the in situ generation of reagents. 53 2-2 Detection of 12-MPA using various electrochemical sensing techniques: (a) amperometry , (b) differential pulse voltammetry , and (c) square wave voltamm etry. . . . . 55
2-3 Image of the phosphate detection device sing annodic dissolution of molybdenum for the in situ generation of reagents. . . . . 56
2-4 Influence of acidity on the formation of 12-MPA . . . . 61
2-5 Formation of reduced molybdophosphoric acid at different ratio of H +/M oO 42 . . . .
62
2-6 Formation of molybdophosphoric acid at different ratioof MoO 4 2 -/P. 63 2-7 Cyclic voltammograms of 12-heteropolymolybdates at a glassy-carbon electrode. . . . . 65
2-8 Effect of acidity (concentration of perchloric acid) on reaction of rate of 12-M SA . . . . . 66
2-9 Apparent phosphate due to the interference of 100 mM silicate as a function of temperature and final solution pH with a H+:Mo ratio of about 70. ... .67
3-1 Fabricated (left) and CAD model (right)) of the prototype device for the Mo oxidation experiment. . . . . 71
3-2 Measured and expected pH of the 2nd chamber using the prototype
device delveloped in Section 3.1 under the oxidation current of 86 A/m2 with different molybdenum oxidation times. . . . . 73 3-3 Miniaturized pH electrode from UNISENSE. . . . . 74 3-4 Cyclic voltammogram measured during the deposition of IrO2 film on
a gold w ire. . . . . 76 3-5 Schematic and fabricated image of the pH meter circuit board. .... 77 3-6 Measured potential of the fabricated IrO2 electrode in pH 4 and 7
buffer solutions. . . . . 78 3-7 CAD model and fabricated prototype device for the formation and
detection of 12-M PA. . . . . 81 3-8 Evolution of cyclic voltammogram of 12-MPA measured on a gold
elec-trode. ... .83
3-9 Cyclic voltammogram of 12-MPA with different Mo oxidation times
measured on a gold electrode. . . . . 84
3-10 SEM images of electrochemically depostied 12-MPA on a graphite
pen-cil electrode. . . . . 85 3-11 Square wave voltammogram measured in the solution containing 0.1
M H2SO4 with/without 100 pM 12-MPA. . . . . 87
4-1 Schematic of the electrical impedance model of the device during the molybdenum oxidation. . . . . 92
4-2 Possible configurations of electrodes inside the 2nd chamber chamber. 93
4-3 Cad model and fabricated images of the first version of micro-volume device for the molybdenum oxidation experiment. . . . . 96
4-4 Measured and expected pH of the sample solution inside the 2nd cham-ber chamcham-ber after the molybdenum oxidation. . . . . 98
4-5 Possible design options to metigate the proton loss during the molyb-denum oxidation. . . . . 100
4-7 Image showing boundary conditions of the simulation model. . . . . . 105
4-8 Effect of the surface area of the 2nd chamber PEM. . . . . 111
4-9 Effect of the thickness of the 2" dchamber PEM. . . . . 114
4-10 Effect of the radius of the 2nd chamber while maintaining the chamber volum e constant. . . . . 117
4-11 Effect of the revision 1 on the measured pH of the soution inside the 2 nd chamber. Molybdenum oxidation was conducted at 2 kA/m 2. . . 120
4-12 Comparsion of applied voltages during the molybdenum oxidation.. 121
4-13 Installation of sensing electrodes inside the 2nd chamber of the micro-volume phosphate detection device with the first design revision. . . . 122
4-14 Evolution of square wave voltammogram (0.4 to 0.1 V, 25 Hz, 25 mV amplitude, 1 mV Estep)of 12-MPA measured with the Rev.1 device. . 124 4-15 Evolution of peak heigh at around Estep of 0.08 and 0.22 V. . . . . 125
4-16 Simulation of pH during the molybdenum oxidation (1.6 kA/m2, 10 s) inside the device with revision 2. . . . . 126
4-17 Installation of sensing electrodes inside the 2nd chamber of the micro-volume phosphate detection device with the second design revision. . 128 4-18 Simplified circuit diagram of the potentiostat. . . . . 130
4-19 Schematic of the potentiostat circuit. . . . . 131
5-1 Images of fabricated DMPS. . . . . 135
5-2 Schematic of the experimental setup using DMPS. . . . . 136
5-3 Schematic of the experimental set up for the molybdenum potential measurement during the molybden oxidation. . . . . 138
5-4 Measured potential of the molybdenum electrode and applied voltage during the 1st molybdenum oxidation. . . . . 139
5-5 Measured impedance between the molybdenum electrode and the Ag|AgCl (1 M KCl) reference electrode in 0.1 M NaCl solution. . . . . 141
5-6 Schematic illustrating the experimental process of SWV measurement w ith D M PS. . . . . 142
5-7 Evolution of square wave voltammogram measured with DMPS in 0.1
M NaCl containing no phosphate ions. . . . . 143
5-8 Linear sweep voltammograms recorded on a rotating gold disk elec-trode for isopolyoxomolybdates . . . . . . 144
5-9 Evolution of square wave voltammogram measured with DMPS in 0.1
M NaCl containing 10 pM phosphate ions. . . . . 145
5-10 Evolution of square wave voltammogram measured with DMPS in 0.1
M NaCl containing 100 pM silicate ions with different oxidation time for the 1 st molybdenum oxidations (10, 20, and 40 s). . . . . 147
5-11 Evolution of square wave voltammogram measured with DMPS in 0.1
M NaCl containing 10 pM phosphate ions with different oxidation time for the t molybdenum oxidations (20, 40, and 60 s). . . . . 148
5-12 Evolution of square wave voltammogram measured with DMPS in 0.1
M NaCl containing 10 pM phosphate ions. . . . . 149
5-13 Square wave voltammogram (0.4 to 0.1 V, 40 Hz, 25 mV amplitude, 5 mV Estep) measured with DMPS in 0.1 M NaCl containing different
concentrations of phosphate ion. . . . . 151
5-14 Square wave voltammogram measured with DMPS demonstrating the repeatability. . . . . 152 5-15 Square wave voltammogram (0.4 to 0.1 V, 40 Hz, 25 mV amplitude,
5 mV Estep) measured with DMPS in 0.1 M NaCl containing different
concentrations of phosphate ions and silicate ions. . . . . 153
6-1 volution of square wave voltammogram (0.4 to 0.1 V, 40 Hz, 25 mV
amplitude, 5 mV Estep)measured with DMPS in 0.1 M NaCl containing
10 pM phosphate ions with different Mo2 oxidation currents. . . . . . 159
6-2 Images of fabricated electrodes in SMPS. . . . . 161
6-3 Images of fabricated SMPS. . . . . 162
6-4 Evolution of square wave voltammogram measured with SMPS in 0.1 M NaCl containing no phosphate ions. . . . . 164
6-5 Evolution of square wave voltammogram measured with DMPS in 0.1 M NaCl containing 10 AM phosphate ions. . . . . 165 6-6 Evolution of square wave voltammogram measured with DMPS in 0.1
M NaCl containing 10 pM phosphate ions. . . . . 166 6-7 Evolution of square wave voltammogram measured with DMPS in 0.1
M NaCl containing 100 AM silicate ions with different molybdenum oxidation current (2.5, 6.25, 12.5, 25, 50, and 100 A/m2 for 8 s). . . . 168 6-8 Evolution of square wave voltammogram measured with DMPS in 0.1
M NaCl containing 10 AM phosphate ions with different molybdenum oxidation current (2.5, 6.25, 12.5, 25, 50, and 100 A/m2 for 8 s). . . . 169 6-9 Evolution of square wave voltammogram measured with two different
SMPSs in 0.1 M NaCl containing different phosphate ions. . . . . 170 6-10 Evolution of (normalized) square wave voltammogram measured with
two different SMPSs in 0.1 M NaCl containing different phosphate ions.171
6-11 Calibration curves based on the normalized peak height of SWV reaponses
measured at different times after the molybdenum oxidation with SMPS 1 and SM PS 2. . . . . 173 6-12 Square wave voltammogram measured with SMPS 1 in 0.1 M NaCl
containing 50 pM silicate ions with(red)/without(blue) 50 pM silicate ion s. . . . . 174
6-13 Electrical conductivity of water. . . . . 175
6-14 Square wave voltammogram measured with SMPS 2 in 1 mM NaCl containing different concentrations of phosphate ions (0.1, 0.2, 0.5, 1,
5, and 10 pM ). . . . . 177
6-15 Electrical conductivity of water. . . . . 178
6-16 Images of fabricated electrodes in OC-SMPS . . . . 180
6-17 Square wave voltammogram measured with OC-SMPS in 0.1 M NaCl
6-18 Square wave voltammogram measured with OC-SMPS in 0.1 M NaCl
containing different concentrations of phosphate ions (8.3, 16.4, 40, and
62.5 iM) and silicate ions (100 pM). . . . . 183
7-1 Example of printed micro electrodes. . . . . 188 7-2 Preliminary results of phosphate detection using correlation-based
List of Tables
1.1 Various methods applied to determination of phosphorus. . . . .
2.1 Predicted predominant molybdate species present as a function of pH.
3.1 Measured pH of the 2nd chamber with different molybdenum oxidation tim es. . . . .
4.1 Comparioson of the efficiency of the molybdenum oxidation. . . . . . 4.2 Initial values and important parameters for COMSOL@ simulation. . 4.3 Measured pH of the sample volume inside the 2nd chamber chamber of the device revision 2 after the molybdenum oxidation at 2 kA/m2 with different oxidation times. . . . .
5.1 Comparison of the performance of DMPS. . . . .
6.1 Comparioson of the performance of DMPS. . . . .
39 60 80 97 106 127 155 185
Chapter 1
Background
1.1
Phosphorus
Phosphorus is an essential nutrient element used by all living organisms for their growth and energy transport. Humans and all other vertebrates need phosphorus to build their bones and teeth which contain up to 50% by volume and 70% by
weight of hydroxyapatite, Caio(PO4)6(OH)2 [1]. In addition, many other phosphorus compounds play important roles in fundamental biochemical functions. To name a few, phosphorus along with carbon and nitrogen compounds form a nucleotide which consists of almost all coenzymes. Nucleotides act as precursors in DNA and RNA synthesis and thereby play an important role in the storage and transmission of genetic information of the biological system. Adenosine triphosphate (ATP) is an important source of energy which serves as an inorganic phosphate carrier in many important enzymatic reactions. Phospholipids, a class of lipids that consists of a phosphate group, are the main characteristic components of the cell wall membranes. Sugar phosphates store and transfer the energy inside the biological system which drives the carbohydrate metabolism. Lastly, as hydrogen phosphate ion (HP042) can stay
stably inside the cell and hydrolyze slowly in the absence of enzymes, it provides a buffering capability to an intracellular cnvironmcnt.
Despite its importance to many living organisms, it is often not readily avail-able becoming a limiting factor for the primary production in terrestrial and aquatic
ecosystems [2]. The majority of phosphorus is stored in the terrestrial environment,
which retains 8.4x10¹⁷ to 40x1017 kg in sediments, 9.6x10⁴ to 20x1013 kg in soils
(<0.6 m deep), and 2.6 x10¹² to 3.0x 10¹² kg in terrestrial biota [3]. Fluorapatite is the
main mineral in igneous rocks that contains phosphorus in the form of Ca(PO4)30H, and the phosphorus is released into the soil by weathering. The dissolved phospho-rus is then transformed immediately into less bioavailable forms, although they are eventually incorporated into plants as an organic form. The aquatic environment is also an important reservoir for phosphorus, most of which is stored in the deep ocean
(300 to 3000 m, 8.7xi013 kg) [3] as forms of particulate and dissolved phosphorus.
Particulate phosphorus exists within minerals of the sediment and is difficult to be dissolved into marine water, because of the high pH and high ionic buffering of the marine water, which makes it rarely participate in biochemical reactions of the living organisms. Moreover, dissolved phosphorus is mostly taken up by phytoplankton near the surface of the water as a crucial ingredient for their photosynthesis resulting its concentration gradient of surface depletion and deep enrichment.
In nature, most phosphorus transfer used to occur between marine biota and ocean water, between soil biota and soil, from soil to the surface of the ocean, and erosion/weathering of rocks (Figure 1-1). However, the modern phosphorus cycle is mainly influenced and dominated by human activities, such as agriculture, wastewater treatment, and burning of fossil fuels, which have dramatically increased nutrient inputs to soil and natural water in general [4].
Especially in agriculture, the use of a fertilizer that contains phosphorus along with nitrogen and potassium has become a standard in the industry ever since its first development after World War 2 (Figure 1-2). Fertilizers with phosphorus are essential in stable harvesting as it can quickly replenish the phosphorus removed from soil by harvests enabling the next cycle of harvesting. On one hand, it has contributed to the mass production of quality foods and corresponding population growth of the world, but on the other hand, the agricultural runoff substantially increased the level of phosphorus transfer from the terrestrial environment to aquatic environment compared to the prehumen era [6]. Also, animal wastes generated from
ATMOSPHEFRE TERM0 AL 0.34 .. MINEABLE ROCK 10000-38000 FRSsHwA PHYSK51AL so ION BIOTA ) 2800-3007 1-3 RUNOFF -o E E FT USERS1 1250 CROP UPTAKE I1T 0-1 BURIALI BENTHICFLUX SEDI 834010-69 02-0.3 OCEAN/ 80260-83000, 1200 AU 40 vIENTS 310010
P rsmrvoir (Mc P) -- P Fluxes Mt P/yr)
Figure 1-1: A schematic diagram of the phosphorus cycle. Numbers represent the amount of phosphorus in Tg (1x10⁹ kg). Image obtained from [5].
large intensive feedlots are another important source of excess phosphorus input not only because the size of the industry is growing but also the trend of having fewer but larger farms boosts the concentration of the run-off from the soil to the water [7].
1.2
Eutrophication
Eutrophication is one of the six major environmental problems in lakes, estuaries and coastal waters throughout the world [9]. It describes the phenomenon in water where the rate of supply of organic matter to an ecosystem is increased [10]. Importantly, phosphorus, along with nitrogen and carbon, is considered to be the main nutrient that causes eutrophication in water.
Although organic matter is the critical foundation which supports the coastal and marine food webs of the ecosystem, the over-supply tothe water system has substan-tially negative consequences. The high level of nutrients can stimulate the growth of different types of micro-organisms including dense nuisance and toxic algae causing
,Aos .003 13 SOILS 2 00 91000-801500 EARTH CRUST .20000100
-C
u Fertilizer use, Tg P205 * World 40- e Europe o America 30- o Asia 00 A Africa 0 00 AOceania
•
000 20 - + 010-
00 * 0000 0 % Da 00 000W %d 00 o 0 %o 0* 1960 1970 1980 1990 2000 2010 YearFigure 1-2: Consumption of phosphate fertilizers in Tg (1x10⁹ kg) P205 in the world per continent during the period 1960 to 2012. Image obtained from [8].
a decrease of the light penetration and beneficial submerged aquatic vegetation. In
addition, the growth of micro-organisms reaches the state where it cannot be
bal-anced by the consumption from species in the higher rank of the food web and that excess organic matter sinks to the bottom of water. As a result, the oxygen level in the water decreases as it is decomposed by bacteria which consumes oxygen in the process.
The oxygen is critical to every living organism in water and the decrease of it (hypoxia, < 3 mg/Lof 02 in water) or the absence of it (anoxia) can significantly disturb the ecosystem in water by causing the death of fish and other important organisms, the degradation of their habitat, and the alteration of their migration pattern. Moreover, from an economic perspective, it can lead to the decrease in fishery production and negatively impact the life pattern and tourism of local communities.
1.2.1 Assessment of Eutrophication
Eutrophication of natural water, lakes in particular, can be assessed by using Carl-son's Trophic State Index (TSI) [11], which is the most widely used trophic index. It is based on the measurement of important parameters related to eutrophication:
Secchi depth transparency (SD, m), total phosphorus concentration (TP, pg/L), and chlorophyll a concentration (CHL, pg/L). The measurements are converted to the trophic status index using equations below,
TSISD = 60 - 33.2 log1oSD, (1.1)
TSITP = 4.2 + 33.2 log1OTP, (1.2)
TSICHL 30.6 + 22.6 log1 0CHL. (1.3)
The water is defined as "oligotrophic" if TSI of measured parameters range between
0 to 40. It indicates the good water quality which shows the least amount of biological
productivity. TSI of 40 to 60 is considered to be "mesoeutrophic," which indicates the fair water quality with a moderate level of biological productivity. When TSI of the water exceeds 60, it is called "eutrophic," and TSI over 80 is "hypereutrophic" meaning the poorest water quality with the highest biological productivity.
The United States Environmental Protection Agency (EPA) conducted the eu-trophication survey of the nation's lakes in 1972 and 2007 to evaluate and compare the quality of the nation's water [12]. The former survey in 1972 was originally intended to determine the effect of the upgrade in wastewater treatment plants (WWTP) on the trophic condition (using Carlson's TSI) of water by surveying 800 lakes. In 2007,
EPA randomly selected 200 lakes within the same group surveyed in 1972 and
con-ducted the same evaluation of the trophic condition to determine how it had changed over the years. According to the results of the surveys, 50% of the lakes showed a de-crease in total phosphorus concentration whereas 25.9% showed inde-crease. The trophic state based on the measured Chlorophyll a concentration indicated the improvement in 22.6% of the lakes and degradation in 26.3% (Figure 1-3).
More specifically, the percentage of lakes classified as hypereutrophic decreased from 49% to 34.9% but eutrophic lakes increased from 16% to 26.9% (Figure 1-3) indicating that most lakes with the poorest water quality had recovered from their worst state but still a large number of lakes remained at eutrophic or hypereutrophic
Change in Phosphorus Change in Trophic State
(1972-2007) (Chloroh )
Decrease: 22.6% I Decrease: 25.9%
Increase: 26.3% U Increase: 23.6%
UNo Change: 51.1% 0 No Change: 50.4%
Figure 1-3: Proportion of NES lakes that exhibited improvement, degradation, or no change in phosphorus concentration (left) and chlorophyll a (right) based on the comparison of national eutrophication survey conducted in 1972 and 2007 by the
USEPA. Graphs are regenerated from [12].
state (65% to 62%). These results are surprising given the momentous improvements
in environmental science and engineering including the monitoring and waste man-agement techniques.
Figure 1-4 shows the trophic state of lakes in the lower continental US in 2007. The survey showed 13% of lakes are oligotrophic, 37% are mesotrophic, 30% are eutrophic, and 20% are hypereutrophic. Interestingly, man-made lakes were more eutrophic than natural lakes suggesting that man-made lakes require more careful management of the water system.
An alternative and more direct assessment method of eutrophication is by using a primary production which measures "the extent to which primary energy input to the aquatic environment is transformed into the biological/ecological sphere" [13] .In practice, the primary production can be defined as the flux of inorganic carbon into planktonic algae per unit time using the so-called `C method by S. Nielsen presented in 1952 [14]. In this method, a known amount of radioactive isotope 4C is added to the water sample, which will be consumed by planktonic algae along with `C in the sample. By measuring the `C incorporated into the algal cells after two hours of incubation, the uptake of 1 4C02 can be estimated by,
Trophic
State Chlorophyll
Oligotrophic (<= 2 pg/L) Oligotrophic (> 7-30 pg/L) Mesotrophic (> 2-7 pg/L) Oligotrophic (> 30 pg/L) 12.8% 12.8% 12.8% 12.8% 6353 18128 14918 9924 12.8% 12.8% 4319 12234 12.8% 12.8% 7412 5145 12.8% 12.8% 2034 5894 7500 4779 Number 7500 ~ of LakesNational (47546) Natural (29308) Man-Made (20238)
Figure 1-4: Tropic state of lakes based on chlorophyll concentration measured in the lower continental US in 2007. Graphs are regenerated from [12].
Primary production (g C m~2 month~) 50 -0-1954-1960 -o-1984-1993 40 30 20 10 00 J F M A M J J A S O N D Month
Figure 1-5: Primary production in the Kattegat, Denmark, through the year. Image adapted from [13].
Using this method, primary productions in the Kattegat, Denmark at two time periods 1954 to 1960 and 1984 to 1993 were calculated and showed that the algal
production during spring and summer increased significantly from the first to second
period [13].
1.2.2
Control of Eutrophication
As the definition of eutrophication implies, the best control method of the
eutroph-ication is to control the rate of supply of organic matter that contains phosphorus, nitrogen and carbon. However, in recent years there has been considerable debate over the actual practice of eutrophication control. In other words, which element among phosphorus, nitrogen, and carbon to control to most effectively alleviate the eutrophication is controversial in the field.
First of all, it has been proved by Schindler and Brunskill [15] in the early 70s
and widely accepted since then that the carbon control as a way to decrease the
eu-trophication is the least effective way compared to other methods, phosphorus and
nitrogen control. In their study, a natural lake which had extremely low
concentra-tions of natural dissolved inorganic carbon (less than 0.6 mg/L in the epilimnion in
10 10*
.6 Atmosphedec
8 ,equilibdum
Lake 227
my June July Aug. Sept. Oct. Nov. Dec. Month
Figure 1-6: Partial pressure of CO2 at a depth of 1 m in Lake 227, calculated from
total C02, pH, and temperature; (dashed line) partial pressure of atmospheric CO2.
Image adapted from [15].
(as NaNO3) to induce the eutrophication but no carbon was supplied. They noticed
the increase of suspended and dissolved carbon content after 12 days of fertilization with phosphorus and nitrogen in the lake which was completely isolated from inflow and outflow. From the results they have concluded that the only possible source of
CO2 for phytoplankton production is the invasionof CO2 from the atmosphere, which led to the argument that decreasing the carbon content in water cannot exclusively solve the eutrophication.
This result shifted the focus of eutrophication control from the carbon to phos-phorus and nitrogen control. Interestingly, the carbon control had been argued for by the detergent industry as they preferred to avoid the idea of controlling phosphorus which was heavily used in most detergent at that time
[15].
However, contrary to their arguments, starting from Schindler's study in 1976
[16], much research has collected undeniable evidence that phosphorus or nitrogen
or both play decisive roles in the control of eutrophication of natural water, which resulted in various national and international legislative frameworks (Figure 1-7). In
D. Schindler's first [16] and other follow-up studies [17], whole-lake experiment where
an entire lake is tested as opposed to taking a certain amount of water samples were conducted on 79 lakes in northern America and some European countries during a year (the shortest) to more than 20 years to determine the importance of P and N in
a) z z 0 < L 0.25 - -25 2 0.20 - -20
2
p0.15 15 O z 0 co .1 - 10 Zza-j20.05 - -5 1940 1950 1960 1970 1980 1990 2000 YEAR EXPLANATION * States with ban- Phosphorus consumption-Open
circle indicates estimated value
Figure 1-7: Consumption of phosphorus in detergent manufacturing and number of
Stateswithphosphatedetergentbansfrom1940to1998.Image adaptedfrom[6.
eutrophication control of a lake.
The main conclusion from these massive and long experiments is that reducing the input of phosphorus-related organic matter to the water is the most effective method for eutrophication control. The experiments included the addition of (1) nitrogen + phosphorus, (2) reduced nitrogen
+
phosphorus, (3) phosphorus, and (4) nitrogen into the water. Also, there was another set of experiments where the amount of added (5) phosphorus, (6) nitrogen+
phosphorus and (7) nitrogen were reduced over a period of time. All the addition experiments ((1) to (4)), showed positive eutrophic response as an increase in chlorophyll a concentration with a different increase rate, the highest in (1) and lowest in (3), but no response in experiment (4). Moreover, experiments with reducing nutrients ((5) to (7)) showed that the concentration of chlorophyll a tracked the decline in P leaving excess NO3 when P or P+N was reduced, but no change in biomass was observed if N alone was reduced.9.
1
sI
--- PhosphonisIWM"
Figure1-8: (Left)Lake226,demonstratingthevitalroleofphosphorusineutrophication. Thefar basin,fertilizedwith phosphorus, nitrogen, and carbon, was covered by analgal bloom within two months. Noincreases inalgae orspecies changes wereobservedinthenearbasin, which receivedsimilarquantitiesofnitrogen and carbonbutnophosphorus.(Right)Chlorophyll
aconcentrations in lake 304. In1968,1969,and 1970 the lake was notfertilized.In1971and 1972,it received annual additions of 0.40 g of phosphorus, 5.2 g of nitrogen, and 5.5 g of carbon per square meter. In 1973, additions of nitrogen and carbon were continued at the same rate but phosphorus was not added. Both images regenerated from [16].
of eutrophication control is as follows. When there is a high ratio of phosphorus to
nitrogen-based nutrients in water, N2 fixing bacteria, cyanobacteria blooms. This
in-creases the fixation of N2 from the atmosphere into the surface water which solves the nitrogen-limited condition of water meaning reducing nitrogen can be less effective
in limiting the increase of primary production in water [17]. In addition, Fastner et
al. [18] in 2016 also showed in their case studies of eight lakes in Europe that the reduction of phosphorus load by the diversion of inflows carrying phosphorus,
up-graded sewage treatment or phosphorus precipitation in the major tributary resulted
in the decrease of cyanobacterial blooms, and recommended to maintain the total
phosphorus concentration below 20 to 50 pg/L for the prevention of eutrophication.
The importance of phosphorus control in preventing the eutrophication of natural
water has led to actions in setting standards for various national and international
legislative frameworks and guidelines, such as the EU Water Framework Directive [19],
EU Marine Strategy Framework Directive [20] and UK Technical Advisory Group on the Water Framework Directive [21]. In addition, the United States EPA recommends to maintain the total phosphorus concentration below 30 pg/L in natural water to
reduce the risk of eutrophication [22].
Nitrogen is also an important nutrient in every living organism for their various biochemical activities, which makes it another popular ingredient for fertilizers
com-monly used in the agriculture industry [23]. Although it seems much agreement has
been made on the effect of phosphorus control in eutrophication of natural water,
that of nitrogen is still in debate. Conley et al. in 2016 argued that the nitrogen
fixation by cyanobacteria cannot always balance the need of nitrogen in lakes mean-ing the nitrogen limited condition can be reached by reducmean-ing the influx of nitrogen
to water. Inconsistent with Schindler's argument, results from their whole lake
ex-periment shows that nitrogen addition can solely trigger the eutrophication without
the help of phosphorus, although the effect is more pronounced in phosphorus and
phosphorus+ nitrogen addition experiments [23]. In addition, much effort is made to define the relative effect of nitrogen and phosphorus on the growth of phytoplankton with respect to the amount of nitrogen fixation and ratio of nitrogen and phosphorus
0 ., 3.0 Is 2.5 -2.0 0 -1.5 sn 1.0 0' 5 nEIrn . 19/5 1980 1985 1990 1995 2000 2005 2010 Yew 700- . 1955 190 195 1970 1975 19 1985 1990 1995 Yew 1965 1990 1995 2000 2006 Yew 1980 1965 1990 1995 2000 2005 2010 Yea
,-I
6 15 E .4 -3 -2 -0 -7 -6 j 51 -3 2 2 01 .7_j 50 40- 30- 20- 10--J 4~1 S120 3w100 40 20 700- *150-3w. 100. -1 - 50-0 19 300- *200-150 100 S50 1980 1966 1990 199 2000 20 2010 20 Yaw Sdtwwmm 90 1966 1990 1995 2000 2005 Yew 1975 1960 1985 1990 1995 2000 2005 2010 Year Lake asar0c ilI
I
E-+TP +CN.-a cyanobacteial biovolumeFigure 1-9: Time courses of seasonal means of total phosphorus (TP), chlorophyll a (Chl a) and cyanobacterial bio-volume in 8 lakes: Barton Broad, Lake Balaton, Onondaga Lake, Lake Washington, Lago Maggiore, Lake Constance, Schlachtensee, Lake Tegel. Image adapted from [18].
1980 1985 1990 1995 2000 2005 2010 -0.15 -0.10 -0.06j -3.0 -2.5 -2.0 -1.5 -1.0j -0.5 0.0 15 -25 -20 E E 115 -10 -5
sJ
-0 3 Lake Washington 60 50 40-30, 20, 10-650 600. 150-30 I50-14 -I 12 10 Sa 4 0 1 0-86 0 -6 0 4 0 .2 5 .4 .3 2 100- 1 Lake TeAexternal inputs.
Moreover, Conley et al. made another argument that in estuaries and coastal seas, the control of nitrogen is as critical as that of phosphorus [24]. Coastal and estuarine
ecosystems are different from pristine lakes when it comes to the recovery. In high
salinity, N2 fixation by cyanobacteria is rare; hence nitrogen can be limited in summer whereas phosphorus is supported by the recycling process. They pointed out that
only focusing on phosphorus for eutrophication control allows large and uncontrolled inputs of nitrogen to natural waters resulting in the increase in unconsumed nitrogen
by the algae which is eventually transported to downstream of estuarine and coastal
marine ecosystems and causes eutrophication problems. However, it is important to note that more funds and sophisticated technology are required to remove nitrogen along with phosphorus compared to only removing phosphorus [25].
1.3
Measuring Phosphorus in Natural Water
For these various reasons discussed in the previous sections, phosphorus has been considered as a critical nutrient in water quality management. Hence the reliable and accurate monitoring of the phosphorus level is required as the first step in controlling phosphorus in natural waters. Not to mention, developing a device that can provide such functionality is a vital task and challenge to instrumentation engineers, which has motivated and driven the whole idea of this thesis.
1.3.1
Phosphorus in Natural Water
In water, phosphorus never exists by itself. It is mainly incorporated in the form
of either dissolved or particulate phosphorus. The distinction between dissolved and
particulate phosphorus is determined by their size. A molecule of phosphorus that
can pass through 0.2 or 0.45 pm filter [26] is considered to be in the dissolved form
and those that cannot pass the filter is defined as particulate phosphorus. Dissolved phosphorus includes inorganic phosphorus in the form of orthophosphate, or sim-ply phosphate (P043-), condensed phosphorus, that is covalently bonded multiple
* Lake S Left aftLak
1 304 ELA 11 Lake E AsN"
2 226s ELA 12 Lundejen Newey
S manuseu weden 13 ftelndeer Sweden
4 Lower Beer fweden 14 226 N
5 261 ELA Is 227 ELA
6 Fr NW16 303 ELA
7 Hope Quebec 17 P+N NT
a Legeune Quebee Is ide Quebec
9 Mryj@oN Quebec 1 Guniure Sweden
10 H6eMaure Swden 20 em boakla.
0 *"W 0' +
8
1 2 3 4 5 6 7 8 9 10 1112 13I
I
|t
||
||
1 3 7 8 10 14 15 16 17 18 19 20+NP
Treatment and Lake Number
Figure 1-10: Mean response of phytoplankton to nitrogen (+N), phosphorus (+P), or N+P additions in 20 whole-lake ex-periments. Responses of chlorophyll, algal biomass, or primary production are expressed relative to controls. Image adapted from [23]. C.ii
I iImi
400% 0% .L r -i-in, ' I i
i
I
I II
phosphate molecules, and organic phosphorus, such as nucleic acids, proteins, phos-pholipids, phosphoramide, and sugar phosphates. Particulate phosphorus include clay and silt-associated organic and inorganic phosphorus, precipitates of authigenic origin, and P-containing biological matter [5]. Even with its variously defined forms, the total phosphorus level in natural water is typically determined by decomposing all the different phosphorus-related compounds into inorganic phosphate and measuring its concentration.
1.3.2
Phosphorus Measurement Technologies
Numerous studies have developed technologies to detect phosphate or other types of phosphorus-related compounds. The detection mechanisms of these technolo-gies include spectrophotometry, electrochemistry, fluorescence spectroscopy, infra-red/Raman spectroscopy, NMR spectroscopy, and enzyme-based biology. The de-tection range of each technology and the type of water to which the technologies can be applied cover a wide range as shown in Table 1.1.
However, the most commonly used method for determining phosphorus level in natural water is a spectrophotometric determination of Phospho-molybdenum blue (PMB) molecule [27] (PMB method). In this method, phosphate ions and acidified molybdate ions forms 12-molybdophosphoric acid (12-MPA) in an acidic environment,
PO3- + 12 MoO±- + 27 H+ 7 H3P04(MoO3)1 2 + 12 H20. (1.5)
This complex is further reduced by the reductant into phosphomolybdenum blue which exhibit blue color in water,
H3PMo(VI)12040 + Reductant 0 [H4PMo(VI)sMo(V)4040]-. (1.6)
The determination of phosphorus/phosphate concentration is done by spectrophoto-metrically measuring the intensity of blueness of the test solution. As shown in Table
[SAMPLE os.
Ortho P Cbndensed P 2-annnoechyP 2 k Baccerie
(zTotal
p MNW Filtrmtion 40 2 or 0.45 area No yes Digestion -HN* 7 en -u:ac:ewe. Y 0haMt-aMddeolon.Asin. b=eFRPeabl P Total Particulate P 1 CTPP) 'Total Organic P _____ F__ terable Organic P
(TOP) [1OFOP)
Particulate Organic P I
(POP)I
C~FaCIonsed by Awhamery FroFo musuGl desuod by uia11 n
Figure 1-11: The various operationally defined P fractions in natural waters, based on filtration and/or digestion. Image adapted from [5].
C.'3
Total FINerat P
Total Feative P
different applications.
1.3.3
Current Shortcomings
Despite the fact that the current technology, the PMB method, can be applied to most natural waters with a good sensitivity and selectivity to phosphate ions, there are still great demands for the improvement of the technology. First, phosphorus concentra-tion in natural water fluctuates with the change in physico-chemical condiconcentra-tions such as temperature, salinity, pH, dissolved carbon dioxide, and total dissolved calcium concentration, which are correlated with the season and related biological activities (e.g. consumption by phytoplankton) [78]. Also, most phosphorus loadings from diffuse and point sources happen as a short and local event, such as storm. Con-sequently, obtaining the temporal and spatial information of the phosphorus level becomes crucial in water quality management, which requires reliable in situ and portable measurement device.
However, the current technology based on the wet chemistry of PMB typically requires manual sampling, and the transport and storage of the sample [79], followed
by laboratory-based analysis. Therefore, phosphorus analysis that covers a
physi-cally large area with a long monitoring period can incur large costs associated with resources and labor. Especially for oceanic applications, where the area of inter-est can span up to 1x10 m 2 [80] or more, a very expensive and time-consuming
ship-based sampling limits the amount and quality of the information taken from the measurements.
In fact, there are few commercially available in situ measurement devices on the market using the PMB method (Figure 1-12). Although their detection range and limit of detection fulfill the requirement for most applications, the size of the devices increases with their working time, simply because an increase in measurements yields an increase in the volume of reagents for the PMB method. For example, a portable phosphate analyzer manufactured by HANNA Instruments [81] requires two vials of 50 mL reagent and standard for 100 measurements whereas another device by Hach
[82]
Table 1.1: Various methods applied to determination of phosphorus.
Detection Reagents Linear or RSD % LOD (pM) Sample Sampling Reference
technique Determination(1iM) rate(h-')
Amperometric 'rines and P12Dia 0.16-24.8 2.5 0.008 Aqueous 30 [28]
membrane electrode-AcP (0.31) solutions
Amperometric MWD/DR: Perox or HCLO4 30 3 (5.0) 0.1 Domestic waste water 21 [29]
Ampeomeric ER: Pur-Xan
Amperometric ER-ASR: Pur-Xan-Phos 0.031-15.5 5 (0.062) - 0.009; 0.0006 Aqueous solutions 20 [30
Biosensor-amp NADPH 0.56-190 - 0.56 sous - [31]
Maltose phosphorylase and
Biosensor-amp phosphatase, glucoseoxidase(GOx) 0.01-0. 0.0009 Aqueous solutions - [32]
and mutarotase
Purine nucleoside phosphorylase (PNP)
Biosensor-pot and xanthine oxidase (XOD) 0.47-2.37 - 0.09 Aqueous solutions - [33]
immobilised into polypyrrole films
Chemic-Lumi MP-CTAB 0.015-0.066 4.7 0.0001 seawater - [34]
Chemic-Lumi -dodecylpyridnunbromde 0.0006 - 0.014 14 0.00005 seawater - [35]
Chemic-Lumi PyrOxG/Lu 0003-1.0 2.3 (0.003-1.0) 0.003 Marsh and river water 30 [36]
Chemic-Lumi GODim/Lu 0.0003-0.93 4.3 (0.0003-0.93) 0.0003 River water 20 [34]
Chemic-Lumi MP-MUT-GODim/Lu 0.0003-0.930 4.3 (0.0003-0.930) 0.0003 River water 20 [34]
Chemic-Lumi PyrOxGim/Lu-ARP 0.003-1 2.3 (0.003-1) 0.003 River and marsh water - [36
Conductometry activity of the microalgae 0.037-76 - 0.037 Aqueous solutions - [37]
Chlorella vulgaris
Fluorescence DR: Perox + NaBH4,Mo/Thia 0.0016-0.35 <1 (0.20) 0.0003 Spring, mineral - [32]
and well water
Fluorescence Mo-RhB 0.0003-0.093 1.2 (0.025) 0.0003 Sea and river water 15 [38]
Fluorescence Mo-MG or RhB/ PVA 0.006-0.031 1.1(0.025) 0.0019 Aqueous solutions 15 [39
Fluorescence Ag NanoCluster Metal-Organic Shell <47 0.005 WaterHumanUrine, - [40]
______________Serum
Fluorescence PVC matrix membrane 6- 15 - 0.02 Aqueous solutions - [41]
Fluorescence Europium Adjusted Carbon Dots 0.037- 14 - 0.0047 Aqueous solutions - [42]
Fluorescence Europium BTB MOF 0.09 - 90 - 0.09 Aqueous solutions - [43]
Fluorescence Graphene Quantum Dots with Europium 0.04- 18 - - Aqueous solutions - [44]
FTIR HCl or NaOH 32.6--326 0.5 (163) Sugars and soft drink - [45]
NMR - Tested 4748 Soil - [46]
NMR >2.3 - - Soil - [47]
Potentiometric Pht-CoW 3.1-310 4.0 (31) 0.093 Fertilizer and waste water - [48]
Py:6.2-620 Aqueous
Potentiometric Cuwire electrode Tri:9.3-9300 solutions 72 [49]
Potentiometric Pb-ISE, Pb2+ 3.1-310 0.6 (-) - Aqueous solutions 20 [50]
Potentiometric Cd-ISE, Cd2+ 0.31--3100 0.23 (3100) - Aqueous solutions 160 [51]
Potentiometric GCE/Mo 0.031-15.5 - 0.062 Aqueous solutions - [52]
eieneaoo Reagents Deter on RSD % LOD (pM) Sample rate (ln Reference
Dtecion C Reanots c n eue Determination (AiM) __________ _____)_____rate_________ (h-____
Potentiometric Conanoparticlesandreduced 0.03-300 Tap and well waters [54]
graphene oxide___________
Potentiometric Mb rod 0.3-3 0.06 [55]
Potentiometric Polyaniline 0.03-3 0.03 Artificial [56]
seawater
Potentiometric Bis(dibromophenylstannyl) 0.015-30 0.015 [57]
methane/PVC
Potentiometric Chitosan-clay/PVC 0.03- 300 0.02 [58]
Potentiometric CuMAPc 0.003 Tap, river, drainage, [59]
underground waters
Potentiometric CuPc 0.00003-0.3 ____________0.00003 __________ [60]
Potentiometric CuPc/Au >0.000003 0.000003 [61]
Potentiometric CuBPMP 0.1-1.5 0.015 [62]
Potentiometric U02 Salophene 1.5-30 0.3 [62]
Raman - 474 - - Aqueous solutions - [63]
Spectrophotometry Mo-MG 0.028-0.102 1.2 (0.028-0.102) 0.019 seawater - [64]
Spectrophotometry Mo-V Up to 200 2 (10) 0.8 Waste water 8 [65]
Spectrophotometry Mo/Sn-Hy 0.005-0.10 <4 (0.01-0.032) 0.003 River water 12 [66
Spectrophotometry Mo/Sn-Hy 0.025-0.250 1.3 (0.025-0.25) 0.02 River water 38 [67]
Spectrophotometry D0 er-sc+H2SO4' 00.10-1.0 2.25-0.13(0.024-3.03) 0.001 waste water 20 [68
Mo-Sb/Asc-NaDS ______________________ waste_______ water______ ___
Spectrophotometry Spectophotmetr DR:Perox+H2SO4, 0-1.5 <1(0.50) 0.007 Soils leachates and runoff 40 40[9[69]
Spectrophotometry 3-Phytase, Mo/Sn-Hy 0.025-0.5 DRP: <2.5 PHP: <2.5 DRP: 0.003 Estuarylake 40 [70]
(0.025-0.5) PHP: 0.004 and river water
Spectrophotometry Mo/Sn-Hy, NaCl 60 g/l carrier 0.025-0.3 0.006 Estuarine waters 85 [71]
Spectrophotometry Mo/Asc 0.002-0.10 2.8 (0.048) 0.002 Estuarine water <30 [72]
Spectrophotometry Mo-V-MG 0.05-0.40 18 (0.10) 0.01 Drinking, ground and 30 [73]
waste water
Spectrophotometry Phospho-molybdenum blue 0.00002-0.018 4.8 0.00002 seawater - [74]
Spectrophotometry PMB-CTAB 0.0001-0.0015 4.5 0.00004 seawater - [75]
Spectrophotometry malachite green, surfactant12-molybdophosphatea- 0.001-0.037 3.4 - seawater - [76]
Phospho-molybdenum blue 0.003-0.042
Spectrophotometry -dodecyltrimethylammonium ASR: Up to 1.55 2.2 0.00005 seawater - [77]
400
mm
Figure 1-12: Commercially available portable phosphate measurement devices. Im-ages adapted from [821 (left) and [81] (right).
Therefore, commercially available portable phosphate measurement devices using the PMB method suffer from their large footprint and limited run-time, mainly caused
by the need of a constant supply of reagents.
1.3.4
Reagent-less Phosphate Detection
Since the main problem of the commercially available portable phosphate measure-ment device using the PMB method is the constant supply of reagents, the devel-opment of a measurement technique that does not require a reagent supply can be considered. A reagent-less phosphate detection device requires the sensing mechanism to detect the innate physical property of the phosphate ion, such as its size, color, fluorescence, molecular vibrational mode, or magnetic property. Among these proper-ties, the vibrational mode and magnetic property of different phosphate species have been studied using infra-red (IR) [63,83,84], Raman [63,83-86] and nuclear magnetic resonance (NMR) spectroscopy [47,87]. Such methods are very useful in the sense
20000 A K3PO4 in mol/L 15000 4.1103.266 1.498 0.715 &!10000 C +j 5000 0 1300 K 3PO4 in moVL 1100 B 0.2080 0.0892 900 0.0517 0.0240 700 0.0106 500 300 0 . I I I I I 750 800 850 900 950 1000 1050 1100 Raman shift cm1
Figure 1-13: Concentration profile of the isotropic Raman spectra in the P-O
stretch-ing region of aqueous K3PO4 solutions. Image adapted from [84].
that not only the concentration, but also the kind of phosphorus species can be iden-tified providing broader information about the phosphorus cycle in water. However, their critical limitation is that the detectable concentration range of the phosphate is typically three orders of magnitude higher (1 to 1000 mM) (Figure 1-13 and Figure 1-14) than what is needed for the natural water application (0.1 to 100 pM) (Table 1.1).
Also, Raman and NMR spectroscopy are relatively difficult to miniaturize the measurement setup into a portable, energy efficient and low-cost device. For
exam-ple, Raman spectroscopy normally requires a powerful laser to maximize the measured Raman signal, a signal from approximately one in 10 million of excited molecules in the sample such as 1.2 W laser system used in the study by Rudolph [63]. More-over, a typical NMR spectroscopy system can easily cost more than $10,000 with a size ranging from that of a typical desktop to a bedroom. Therefore, the potential development of a portable and in situ phosphate detection device using such sensing
50 fIII - Phosphate 100 mM 45 - Phosphate 1 mM Phosphate 100 uM 40 - Phosphate 10 uM 35 30 -c 25 -.0 0 20 - 15-10 5 -0 700 800 900 1000 1100 1200 1300 1400 1500 wavenumber (cm-)
Figure 1-14: Fourier transform infrared spectra measured in different concentrations of Na2HPO4 (Spectrum GX FT-IR system, Perkin Elmer).
methods is dependent on the significant improvement of the technologies themselves.
Another reagentless phosphate detection has been achieved using an ion selective
electrode, but they suffer from either a low sensitivity [48-50] or interference from other anions and pH change [57] making it difficult to be used as an in situ device.
On the other hand, most reagent-based phosphate detection methods are based on the mechanism where the reaction between reagents and phosphate ions either generate or degenerate measurable physical properties, such as luminescence, change in color, and redox potential (Table 1.1). It should be pointed out that if such a reaction is perfectly reversible, or even partially with an expectable and controllable behavior, the method is essentially reagentless or has a high potential to be developed as a portable and long working device.
![Figure 1-5: Primary production in the Kattegat, Denmark, through the year. Image adapted from [13].](https://thumb-eu.123doks.com/thumbv2/123doknet/14725521.571668/28.917.241.669.119.384/figure-primary-production-kattegat-denmark-year-image-adapted.webp)


![Figure 2-5: Formation of reduced molybdophosphoric acid at different ratio of [H+]/[MoO 4 ]; [P] =10.5 pM, [Mo]: (a) 0.28 mM (b) 1.4 mM (c) 4.2 mM (d) 8.4 mM (e) 12.1 mM](https://thumb-eu.123doks.com/thumbv2/123doknet/14725521.571668/62.917.140.774.118.504/figure-formation-reduced-molybdophosphoric-acid-different-ratio-moo.webp)

