Cite this as: Swiss Med Wkly. 2016;146:w14274
Vascular response to everolimus- and biolimus-eluting
coronary stents versus everolimus-eluting bioresorbable
scaffolds – an optical coherence tomography substudy
of the EVERBIO II trial
Zacharenia Kallinikou, Diego Arroyo, Mario Togni, Sonja Lehmann, Noé Corpataux, Malica Cook, Olivier Müller, Gérard Baeriswyl,
Jean-Christophe Stauffer, Jean-Jacques Goy, Serban Puricel, Stéphane Cook
Hospital and University Fribourg, Fribourg, Switzerland
Summary
QUESTIONS UNDER STUDY: Head-to-head optical
co-herence tomography (OCT) data comparing metallic stents
with bioresorbable vascular scaffolds (BVS) are lacking.
This study assessed vascular healing at 9-month
follow-up after implantation of everolimus- and biolimus-eluting
stents (EES; BES) and everolimus-eluting BVS.
METHODS: OCT was performed in 74 patients enrolled
in the EVERBIO II (NCT01711931) trial (23 with EES:
26 lesions, 7 625 struts; 23 with BES: 26 lesions, 6 140
struts; 28 with BVS: 33 lesions, 10 891 struts). OCT
im-ages were acquired using the pullback and nonocclusive
flushing technique and analysed offline.
RESULTS: BVS demonstrated fewer uncovered struts per
patient (12 ± 27 [3.8 ± 8.4%] vs 59 ± 55 [21.8 ± 13.7%]
in the EES&BES group, p <0.001), and thicker neointimal
hyperplasia (BVS 102 ± 44 µm vs EES&BES 66 ± 36 µm,
p <0.01). There was no significant difference with regard to
malapposed struts (2.1 ± 2.7% in the BVS vs 4.4 ± 8.8% in
the EES&BES group, p = 0.41). In a predefined signal
in-tensity scale, quantitative analysis of the “key component”
(black) revealed lower intensity in BVS than EES&BES
(14 ± 23% vs 13 ± 12%, p = 0.007). Intensity was lower in
polylactide-containing stents (BVS&BES) than in EES (15
± 19% vs 10 ± 10%, p <0.001).
CONCLUSIONS: BVS has fewer uncovered struts and
presents with a thicker neointimal coverage compared with
EES&BES. It is not known whether this improved capping
correlates with superior vascular healing.
Polylactide-con-taining stents (BVS and BES) demonstrate lower peristrut
intensity compared with EES.
Clinicaltrials.gov registration: NCT01711931
Key words: coronary artery disease; drug-eluting stent;
bioresorbable vascular scaffold; optical coherence
tomography
Introduction
The development of drug-eluting stents (DES) has been
as-sociated with a significant reduction in the rate of target
le-sion revascularisation [
1
]. Early generation DES however,
suffered a significant rate of late complications (stent
thrombosis and/or neoatherosclerosis) [
2
,
3
]. Newer
gener-ations of DES have improved short- and long-term safety.
Of these, second-generation everolimus-eluting stents
(EES) using a biocompatible durable polymer (fluorinated
copolymer) with thin strut (81 µm) and third generation
biolimus-eluting stents (BES) using an abluminally coated
biodegradable polymer (polylactide) with relatively thick
struts (112 µm) are currently considered the safest DES
[
4
–
13
]. The issue of neointimal proliferation and very late
stent thrombosis from lingering polymers and vascular
scaffolds has led to the development of completely
resorb-able stents, among which are the everolimus-eluting
biore-sorbable vascular scaffolds (BVS).
Several optical coherence tomography (OCT) studies have
evaluated the vascular healing response to EES, BES
[
14
–
16
] and BVS [
17
,
18
]. To date, head-to-head OCT
data comparing BVS with EES and/or BES are scarce. We
therefore sought to assess vascular healing in BVS
com-pared with EES&BES using OCT, 9 months after stent
im-plantation.
Methods
Patient population
This study was a substudy of the EVERBIO II trial
(Com-parison of Everolimus- and Biolimus-Eluting Coronary
Stents with Everolimus-Eluting Bioresorbable Vascular
Scaffold), a prospective, single centre, assessor-blinded,
randomised, superiority trial comparing EES&BES with
BVS, the results of which have previously been published
[
19
,
20
]. A total of 240 patients with coronary artery
dis-ease were recruited between November 2012 and
Novem-ber 2013 at the University and Hospital Fribourg
(Switzer-land). The only exclusion criterion was a reference vessel
size of >4.0 mm which precluded BVS implantation.
The inclusion period of the substudy extended from
Janu-ary 2013 to June 2014. The first 25–30 consecutive patients
in each treatment group willing to undergo additional
in-tracoronary imaging were included in the present substudy.
Assessment of OCT outcomes was not blinded.
The study complied with the Declaration of Helsinki and
was approved by the local ethics committee and all patients
gave written, informed consent. The trial is registered in
ClinicalTrials.gov, number NCT01711931.
OCT acquisition and analysis
Per protocol OCT acquisition was planned at 9-month
an-giographic follow-up. After the diagnostic angiography,
200 μg of i.c. nitroglycerin and 2 500–5 000 IU of
unfrac-tionated heparin were administrated. OCT was performed
with the Optis Illumen system (St. Jude Medical) according
to manufacturer guidelines using the Dragonfly™ Duo
OCT Imaging Catheter with “54 mm high resolution
mode” pullback, the nonocclusive flushing technique and a
pullback speed of 25 mm/s. OCT pullbacks were assessed
offline using a proprietary software (Lightlab Imaging, St.
Jude Medical). Lesions were analysed at cross-sectional
level with an interval of 0.5 mm and assessed for strut
coverage, malapposition and protrusion by a single analyst
(ZK) blinded to patient and lesion presentation. All frames
were reviewed by a second analyst (SC) with the final
decision based on consensus. Pullbacks were excluded in
cases where >30% of the total stent length was not
ana-lysable. Thickness of strut coverage was assessed for each
individual strut and was measured as the distance between
the endoluminal side of the strut in the midpoint of its
long axis and the intersection of the lumen contour with
the straight line between the endoluminal side of the strut
and the gravitational centre of the vessel. Struts were
con-sidered uncovered in the case of a partial or complete
ab-sence of tissue coverage (<10 μm, minimal axial
resolu-tion of OCT). Strut malapposiresolu-tion was defined as a distance
Figure 1
Representative images of OCT analysis of BVS and DES. This image shows the analysis of stent/scaffold area. After identifying all struts in a cross-section, stent/scaffold area was delineated by a curvilinear interpolation connecting the middle points of the struts at mid-strut depth.
BVS = bioresorbable vascular scaffold; DES = drug-eluting stent; OCT = optical coherence tomography
≥163 μm for BVS (strut thickness 153 μm), ≥122 μm for
BES (strut thickness 112 μm) and ≥91 μm for EES (strut
thickness 81 μm) based on the consensus derived from the
strut thickness plus the minimal axial resolution of OCT.
Strut protrusion was defined as strut extension into the
lu-men for more than 160 μm but with no obvious
separa-tion from the vessel wall. Cross-secsepara-tional areas of lumen,
stent and neointima were measured at intervals of 0.5mm
in the stented segment, as well as the luminal areas of the
proximal and distal nonstented reference segments.
Neoin-tima area was defined as stent area minus lumen area;
volumes were calculated using Simpson’s rule.
Represent-ative images of OCT analyses for both BVS and DES
are provided on figure 1. The peristrut low intensity area
(PLIA) was analysed quantitavely by measuring the
intens-ity of the “key” component of the CMYK colour
mod-el based on raw cross-sectional images, with an interval
of 1/10 of the lesion length at the mid-strut depth and at
equal distance between two contiguous struts. This
quantit-ative measure reflects the “darkness of the pixels”. Peristrut
intensity was reported as percentage decrease of intensity
units of the “key” component of the CMYK colour
mod-el. Further definitions with regard to OCT analysis can be
found in the appendix to this article.
Statistical analysis
The sample size calculation can be accessed in the
ap-pendix. The substudy is powered on superiority assuming
1% fewer uncovered struts for BVS than for EES&BES
(power: 90%, 2-sided alpha: 0.05).
Variables were compared between patients treated with ESS
or BES (EES&BES) and BVS. Categorical variables are
re-ported as counts and percentages, continuous variables are
reported as means and standard deviations. Normality was
assessed by means of visual inspection of histograms,
com-putation of QQ-plots and the Shapiro-Wilk test. Categorical
variables were compared using chi-square or Fisher’s exact
tests. Continuous variables were analysed using the
Stu-dent’s t-test or the Wilcoxon rank-sum test according to their
distribution. All statistical analyses were performed using
dedicated software (Stata version 13, StataCorp LP, College
Station, Texas) at a two-tailed significance level of α = 0.05.
In the case of multiple testing, the Bonferroni method was
employed. A multilevel linear mixed effects model with
ran-dom effects at patient and lesion level was employed to
com-pare strut coverage and apposition between patients treated
with EES/BES and patients treated with BVS. Univariate
comparison at strut level was carried out and is provided for
illustrative purposes as an appendix (table S3).
Hypothesis testing of EES versus BVS and BES versus
BVS is provided in the appendix (tables S1–S4) for
illus-trative purposes.
Results
Baseline patient characteristics
The patient flow chart is depicted in figure 2. A total of 74
patients, 23 patients with 26 EES-treated lesions, 23 patients
with 26 BES-treated lesions and 28 patients with 33
BVS-treated lesions, were included in the final OCT analysis.
Baseline clinical characteristics among patients undergoing
OCT were generally well balanced between the EES&BES
and the BVS group and are summarised in table 1. Baseline
characteristics of included patients were similar to those of
the overall trial population (table S1a; see appendix).
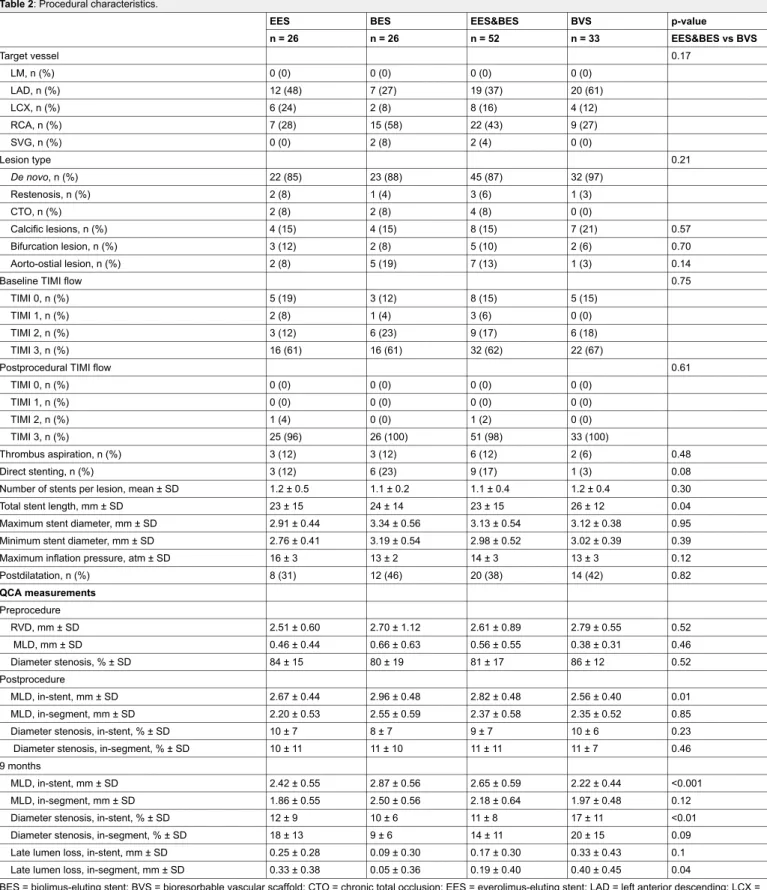
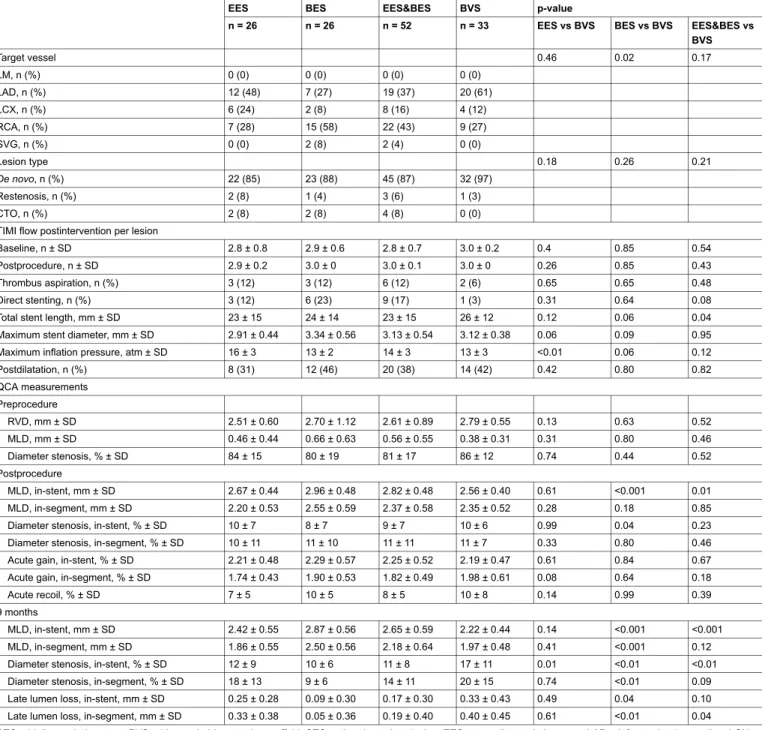
Baseline angiographic and procedural characteristics
Implanted devices were longer in the BVS group (26 ± 12
mm) compared with the EES&BES group (23 ± 15 mm, p
= 0.04) (table 2). At 9 months, BVS demonstrated a higher
percentage of in-stent diameter stenosis (17 ± 11% vs 11 ±
8%, p <0.01) and in-segment late lumen loss (0.40 ± 0.45
vs 0.19 ± 0.40 mm, p <0.01) compared with EES&BES.
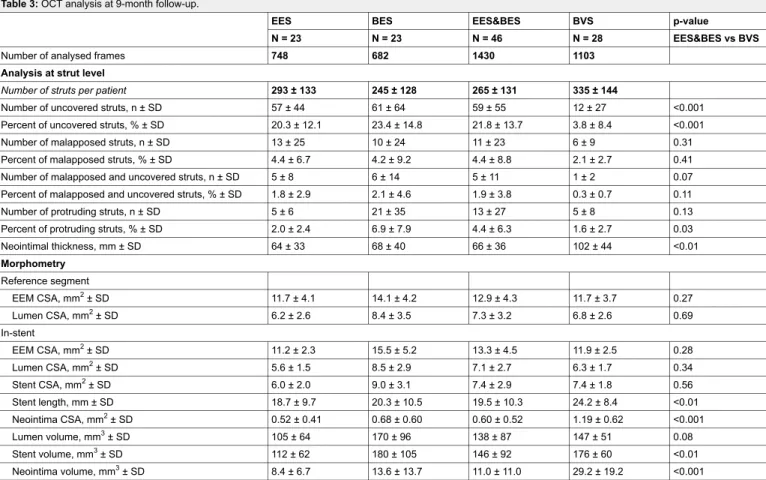
OCT findings
Morphometry
Quantitative analysis of lumen and stent areas at
cross-sectional level showed no differences between the groups,
whereas neointimal area was greater in the BVS compared
with the EES&BES group (1.19 ± 0.62 vs 0.60 ± 0.52 mm
2,
p <0.001) (table 3).
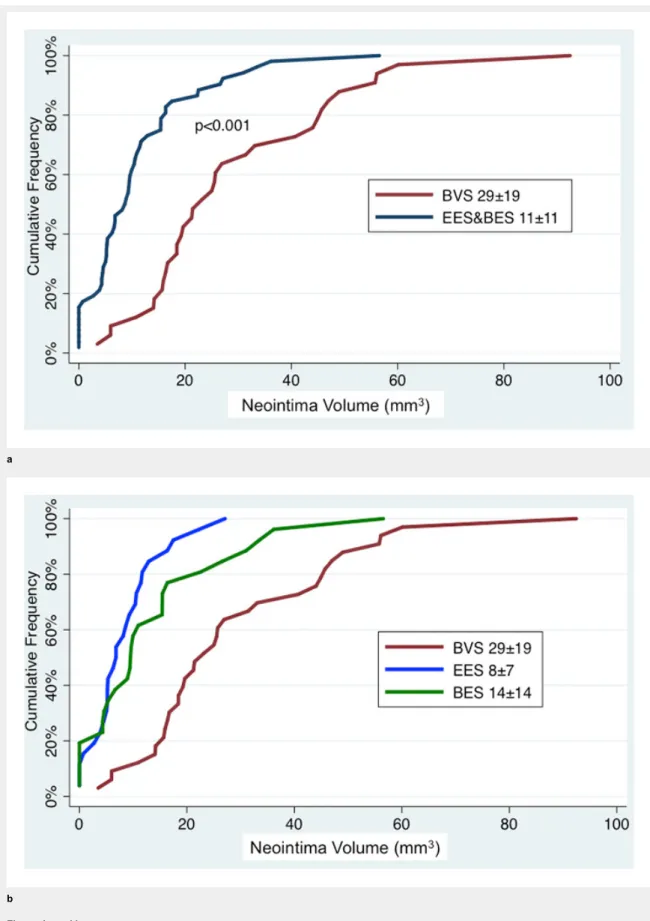
At lesion level, mean neointima thickness (102 ± 44 vs 66
± 36 µm, p <0.01; fig. 3) and mean neointima volume (29.2
± 19.2 vs 11.0 ± 11.0 mm
3, p <0.001; fig. 4) were
signific-antly greater in BVS- than in EES&BES-treated patients.
Figure 2
Patient flow chart.
BES = biolimus-eluting stent; BVS = bioresorbable vascular scaffold; EES = everolimus-eluting stent; OCT = optical coherence tomography
Figure 3a and b
Frequency distribution of mean neointima thickness at intervals of 50 µm.
BES = biolimus-eluting stent; BVS = bioresorbable vascular scaffold; EES = everolimus-eluting stent.
Strut coverage
A mean of 335 ± 144 BVS struts and 265 ± 131 EES&BES
struts were analysed per patient. In the BVS group 12 ± 27
(3.8 ± 8.4%) struts were uncovered compared with 59 ± 55
(21.8 ± 13.7%) in the EES&BES group (p <0.001, fig. 5).
Incomplete stent apposition
Protruding struts were significantly less frequent in BVS
than EES&BES (1.6 ± 2.7% vs 4.4 ± 6.3%. There was no
significant difference with regard to malapposed struts,
al-though the percentage was higher in EES&BES than BVS
(4.4 ± 8.8% vs 2.1 ± 2.7%, p = 0.41).
Peristrut intensity
A total of 9 370 peristrut intensity measurements were
car-ried out (EES 2 591, BES 2 880, BVS 3 899). At peristrut
level, BVS showed significantly decreased intensity when
compared with EES&BES (14 ± 23% vs 13 ± 12%, p =
0.007). However, this difference was dependent on the
rel-atively smallest intensity loss in EES-treated patients (EES
10 ± 10%, BES 16 ± 13%, BVS 14 ± 23%). Comparing
bioresorbable polymer coated devices (BES&BVS) to EES
showed a marked and significant difference in peristrut
in-tensity (EES 10 ± 10% vs BES&BVS 15 ± 19%, p <0.001).
Discussion
This first direct comparative OCT analysis comparing BVS
with DES had the following findings: (a) At 9-month OCT
a
b
Figure 4a and b
Cumulative frequency distribution of mean neointima volume at 9 months.
The numbers provided are mean ± standard deviation. BES = biolimus-eluting stent; BVS = bioresorbable vascular scaffold; EES = everolimus-eluting stent.
follow-up, BVS demonstrated a higher “capping” effect
with fewer uncovered and/or malapposed struts and thicker
neointimal hyperplasia, (b) peristrut intensity was,
however, significantly lower in BVS than EES&BES.
Several trials have previously investigated strut coverage
of EES and BES by use of OCT [
14
–
16
] but only a few
subtrials of the ABSORB Cohort B are available for the
second-generation everolimus-eluting BVS [
17
,
21
,
22
].
To date, there is no reported trial in humans that directly
compared OCT findings of BVS to any of the available
DES. Gomez-Lara and colleagues compared vascular
re-sponse to EES and BVS at 1 year by performing a
post-hoc analysis in 44 unmatched patients from RESOLUTE
All Comers and ABSORB Cohort B2 for whom OCT
ima-Figure 5
Graphical representation of strut coverage and malapposition in lesions.
Lesions = horizontal gray bars, uncovered struts = red lines, malapposed struts = blue lines, according to geographical location on stent/scaffold.
BES = biolimus-eluting stent; BVS = bioresorbable vascular scaffold; EES = everolimus-eluting stent
ging was available. They found no difference in neointimal
response as assessed from mean neointimal thickness over
stent struts (EES 126 vs BVS 136 μm). They further
repor-ted a low number of uncovered struts (EES 5.3% vs BVS
4.5%) or malapposed struts (EES 1.1% vs BVS 2.2%, p
<0.01) with both devices. In our study, BVS achieved high
lesion capping with a low percentage of uncovered struts
at 9-month follow-up. These results are in line with OCT
findings by Gomez-Lara et al. and other studies assessing
strut coverage of BVS [
17
,
21
,
22
]; the ABSORB Cohort
B trial reported a mean of 2% uncovered struts at 6 months
and 1% uncovered struts at 24 months.
When compared with EES&BES, BVS presented
signific-antly fewer uncovered struts in our study. This finding
con-tradicts the results by Gomez-Lara and colleagues and is
most likely driven by the high rate of uncovered struts
found with EES and BES, which is very different from
the available literature. In the post-hoc analysis from
RESOLUTE and ABSORB Cohort B, EES was associated
with 5.3% uncovered struts. The NEXT OCT substudy
re-ported 3 ± 7% uncovered struts in EES-treated and 9 ±
10% in BES-treated patients at 8–12 months (p <0.001)
[
16
]. Tada et al. recently reported no difference in
un-covered struts between EES and BES at 6–8 months (588
[15%] vs 479 [17%] unadjusted respectively, p = 0.34)
[
15
]. However,, this improved capping does not necessarily
reflect better vascular healing. Indeed, the visible covering
layer can be formed by loosely organised and possibly
pro-thrombotic elements such as fibrin.
Incomplete stent apposition and lack of neointimal strut
coverage are thought to be correlated with an increased
risk of late stent or scaffold thrombosis and myocardial
infarction [
23
,
24
]. In this trial, the rate of malapposed
struts was not significantly different in EES&BES
com-pared with BVS. BVS rates of malapposed struts seen in
our study were similar to previously reported data, but
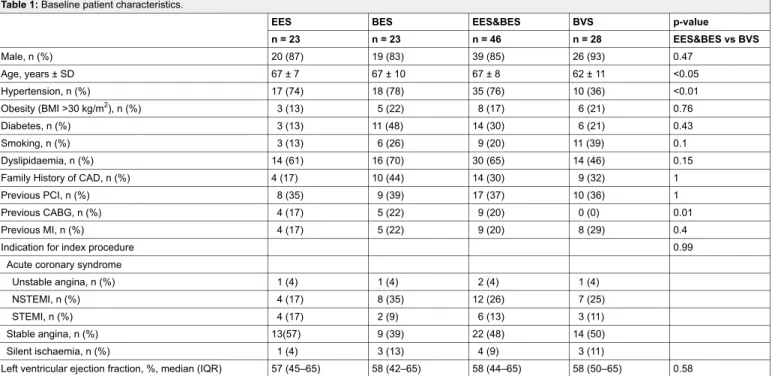
Table 1: Baseline patient characteristics.
EES BES EES&BES BVS p-value
n = 23 n = 23 n = 46 n = 28 EES&BES vs BVS Male, n (%) 20 (87) 19 (83) 39 (85) 26 (93) 0.47 Age, years ± SD 67 ± 7 67 ± 10 67 ± 8 62 ± 11 <0.05 Hypertension, n (%) 17 (74) 18 (78) 35 (76) 10 (36) <0.01 Obesity (BMI >30 kg/m2), n (%) 3 (13) 5 (22) 8 (17) 6 (21) 0.76 Diabetes, n (%) 3 (13) 11 (48) 14 (30) 6 (21) 0.43 Smoking, n (%) 3 (13) 6 (26) 9 (20) 11 (39) 0.1 Dyslipidaemia, n (%) 14 (61) 16 (70) 30 (65) 14 (46) 0.15
Family History of CAD, n (%) 4 (17) 10 (44) 14 (30) 9 (32) 1
Previous PCI, n (%) 8 (35) 9 (39) 17 (37) 10 (36) 1
Previous CABG, n (%) 4 (17) 5 (22) 9 (20) 0 (0) 0.01
Previous MI, n (%) 4 (17) 5 (22) 9 (20) 8 (29) 0.4
Indication for index procedure 0.99
Acute coronary syndrome
Unstable angina, n (%) 1 (4) 1 (4) 2 (4) 1 (4)
NSTEMI, n (%) 4 (17) 8 (35) 12 (26) 7 (25)
STEMI, n (%) 4 (17) 2 (9) 6 (13) 3 (11)
Stable angina, n (%) 13(57) 9 (39) 22 (48) 14 (50)
Silent ischaemia, n (%) 1 (4) 3 (13) 4 (9) 3 (11)
Left ventricular ejection fraction, %, median (IQR) 57 (45–65) 58 (42–65) 58 (44–65) 58 (50–65) 0.58
BES = biolimus-eluting stent; BMI = body mass index; BVS = bioresorbable vascular scaffold; CABG = coronary artery bypass graft; CAD = coronary artery disease; EES = everolimus-eluting stent; MI = myocardial infarction; NSTEMI = non-ST segment elevation myocardial infarction; PCI = percutaneous coronary intervention; SD = standard deviation; STEMI = ST segment elevation myocardial infarction
EES&BES rates of malapposed struts were considerably
higher than reported in the literature [
14
–
17
,
21
].
OCT assessment of neointimal coverage is a useful
sur-rogate for risk stratification of very late DES thrombosis
[
25
]. The current study showed better neointimal coverage
in BVS-treated than in EES&BES-treated lesions. Whether
neointimal coverage is equally important in stratifying the
risk for very late scaffold thrombosis is uncertain. It may be
that a distinctive pathophysiology and/or different
mechan-istic phenomena, not yet identified, lead to scaffold
throm-bosis.
The current study is the first to compare PLIA between
BVS, EES and BES and to address this issue with
quantit-ative OCT assessment. In a comparquantit-ative histological
obser-vation Teramoto et al. suggested that these areas of low
in-tensity may represent fibrin accumulations surrounded by
Table 2: Procedural characteristics.
EES BES EES&BES BVS p-value
n = 26 n = 26 n = 52 n = 33 EES&BES vs BVS Target vessel 0.17 LM, n (%) 0 (0) 0 (0) 0 (0) 0 (0) LAD, n (%) 12 (48) 7 (27) 19 (37) 20 (61) LCX, n (%) 6 (24) 2 (8) 8 (16) 4 (12) RCA, n (%) 7 (28) 15 (58) 22 (43) 9 (27) SVG, n (%) 0 (0) 2 (8) 2 (4) 0 (0) Lesion type 0.21 De novo, n (%) 22 (85) 23 (88) 45 (87) 32 (97) Restenosis, n (%) 2 (8) 1 (4) 3 (6) 1 (3) CTO, n (%) 2 (8) 2 (8) 4 (8) 0 (0) Calcific lesions, n (%) 4 (15) 4 (15) 8 (15) 7 (21) 0.57 Bifurcation lesion, n (%) 3 (12) 2 (8) 5 (10) 2 (6) 0.70 Aorto-ostial lesion, n (%) 2 (8) 5 (19) 7 (13) 1 (3) 0.14
Baseline TIMI flow 0.75
TIMI 0, n (%) 5 (19) 3 (12) 8 (15) 5 (15)
TIMI 1, n (%) 2 (8) 1 (4) 3 (6) 0 (0)
TIMI 2, n (%) 3 (12) 6 (23) 9 (17) 6 (18)
TIMI 3, n (%) 16 (61) 16 (61) 32 (62) 22 (67)
Postprocedural TIMI flow 0.61
TIMI 0, n (%) 0 (0) 0 (0) 0 (0) 0 (0) TIMI 1, n (%) 0 (0) 0 (0) 0 (0) 0 (0) TIMI 2, n (%) 1 (4) 0 (0) 1 (2) 0 (0) TIMI 3, n (%) 25 (96) 26 (100) 51 (98) 33 (100) Thrombus aspiration, n (%) 3 (12) 3 (12) 6 (12) 2 (6) 0.48 Direct stenting, n (%) 3 (12) 6 (23) 9 (17) 1 (3) 0.08
Number of stents per lesion, mean ± SD 1.2 ± 0.5 1.1 ± 0.2 1.1 ± 0.4 1.2 ± 0.4 0.30
Total stent length, mm ± SD 23 ± 15 24 ± 14 23 ± 15 26 ± 12 0.04
Maximum stent diameter, mm ± SD 2.91 ± 0.44 3.34 ± 0.56 3.13 ± 0.54 3.12 ± 0.38 0.95
Minimum stent diameter, mm ± SD 2.76 ± 0.41 3.19 ± 0.54 2.98 ± 0.52 3.02 ± 0.39 0.39
Maximum inflation pressure, atm ± SD 16 ± 3 13 ± 2 14 ± 3 13 ± 3 0.12
Postdilatation, n (%) 8 (31) 12 (46) 20 (38) 14 (42) 0.82 QCA measurements Preprocedure RVD, mm ± SD 2.51 ± 0.60 2.70 ± 1.12 2.61 ± 0.89 2.79 ± 0.55 0.52 MLD, mm ± SD 0.46 ± 0.44 0.66 ± 0.63 0.56 ± 0.55 0.38 ± 0.31 0.46 Diameter stenosis, % ± SD 84 ± 15 80 ± 19 81 ± 17 86 ± 12 0.52 Postprocedure MLD, in-stent, mm ± SD 2.67 ± 0.44 2.96 ± 0.48 2.82 ± 0.48 2.56 ± 0.40 0.01 MLD, in-segment, mm ± SD 2.20 ± 0.53 2.55 ± 0.59 2.37 ± 0.58 2.35 ± 0.52 0.85
Diameter stenosis, in-stent, % ± SD 10 ± 7 8 ± 7 9 ± 7 10 ± 6 0.23
Diameter stenosis, in-segment, % ± SD 10 ± 11 11 ± 10 11 ± 11 11 ± 7 0.46
9 months
MLD, in-stent, mm ± SD 2.42 ± 0.55 2.87 ± 0.56 2.65 ± 0.59 2.22 ± 0.44 <0.001
MLD, in-segment, mm ± SD 1.86 ± 0.55 2.50 ± 0.56 2.18 ± 0.64 1.97 ± 0.48 0.12
Diameter stenosis, in-stent, % ± SD 12 ± 9 10 ± 6 11 ± 8 17 ± 11 <0.01
Diameter stenosis, in-segment, % ± SD 18 ± 13 9 ± 6 14 ± 11 20 ± 15 0.09
Late lumen loss, in-stent, mm ± SD 0.25 ± 0.28 0.09 ± 0.30 0.17 ± 0.30 0.33 ± 0.43 0.1
Late lumen loss, in-segment, mm ± SD 0.33 ± 0.38 0.05 ± 0.36 0.19 ± 0.40 0.40 ± 0.45 0.04
BES = biolimus-eluting stent; BVS = bioresorbable vascular scaffold; CTO = chronic total occlusion; EES = everolimus-eluting stent; LAD = left anterior descending; LCX = left circumflex; LM = left main; MLD = minimal lumen diameter; QCA = quantitative coronary angiography; RCA = right coronary artery; RVD = reference vessel diameter; SD = standard deviation; SVG = saphenous vein graft; TIMI = Thrombolysis in Myocardial Infarction study group.
proteoglycan extracellular matrix and inflammatory cell
in-filtration, indicating delayed arterial healing [
26
]. In the
same preclinical study using a porcine model, they reported
a 3-fold higher rate of PLIA for early-generation DES than
for bare metal stents [
26
]. Tada et al. reported similar rates
of PLIA for EES and BES [
15
]. In the present study,
peris-trut intensity significantly differed between the three
plat-forms studied. There was a significantly lower peristrut
intensity found in BVS- and BES- compared with
EES-treated lesions. The lower intensity in devices with a
de-gradable polymer coating compared with a durable
poly-mer coating might suggest a prolonged inflammatory
pro-cess around the degradable polymer coating, which could
be a marker of delayed vascular healing.
The present study is limited in size with inevitable
uncer-tainty around point estimations. Another issue is the lack of
baseline OCT examination precluding any definitive
con-clusion regarding the cause of the incomplete stent
appos-ition found at 9-month follow-up. A systematic bias might
have been introduced by the differences in assessment of
malapposition between the metallic stents (estimation of
the abluminal border by adding the strut and polymer
thick-ness to the endoluminal border) and the BVS (direct
visu-alisation of the abluminal border and the lumen contour
behind it). Furthermore, neointimal hyperplasia may have
been overestimated in patients treated with BVS. Due to
the reduction of the black box signal (by filling of the strut
voids with connective tissue) that induces an abluminal
dis-placement of the endoluminal scaffold strut border,
meas-urement of neointimal hyperplasia becomes systematically
larger in BVS than in metallic stents.
Finally, the study was neither powered nor designed to
as-sess the impact of suboptimal stent coverage by neointima,
incomplete stent apposition and PLIA on subsequent late
clinical events, particularly late stent thrombosis.
Notwithstanding, specific strengths include meticulous
OCT measurements at longitudinal intervals of 0.5 mm
while standard intervals used by OCT investigators to date
was 1 mm. Moreover, this was a substudy with a
repres-entative sample of the EVERBIO II trial population, an
investigator-initiated and funded randomised controlled
tri-al in tri-all-comers.
Conclusions
BVS has fewer uncovered struts and presents with a thicker
neointimal coverage compared with EES&BES. It is not
known whether this improved capping correlates with
su-perior vascular healing. Polylactide-containing stents
(BVS&BES) demonstrated lower peristrut intensity
com-pared with EES. The clinical significance of these findings
needs further assessment.
Disclosure statement: The trial was an investigator-initiated
study supported by an unrestricted grant from the Fonds Scientifique Cardiovasculaire (Fribourg, Switzerland). The funding source had no role in the design of the study, data collection, data monitoring, data analysis, data interpretation, or writing of the report.
Dr. Cook has received speaker fees/honoraria from Abbott Vascular, Biosensors Int., and Boston Scientific. Dr. Cook receives support from the Swiss National Science Foundation
Table 3: OCT analysis at 9-month follow-up.
EES BES EES&BES BVS p-value
N = 23 N = 23 N = 46 N = 28 EES&BES vs BVS
Number of analysed frames 748 682 1430 1103
Analysis at strut level
Number of struts per patient 293 ± 133 245 ± 128 265 ± 131 335 ± 144
Number of uncovered struts, n ± SD 57 ± 44 61 ± 64 59 ± 55 12 ± 27 <0.001
Percent of uncovered struts, % ± SD 20.3 ± 12.1 23.4 ± 14.8 21.8 ± 13.7 3.8 ± 8.4 <0.001
Number of malapposed struts, n ± SD 13 ± 25 10 ± 24 11 ± 23 6 ± 9 0.31
Percent of malapposed struts, % ± SD 4.4 ± 6.7 4.2 ± 9.2 4.4 ± 8.8 2.1 ± 2.7 0.41
Number of malapposed and uncovered struts, n ± SD 5 ± 8 6 ± 14 5 ± 11 1 ± 2 0.07
Percent of malapposed and uncovered struts, % ± SD 1.8 ± 2.9 2.1 ± 4.6 1.9 ± 3.8 0.3 ± 0.7 0.11
Number of protruding struts, n ± SD 5 ± 6 21 ± 35 13 ± 27 5 ± 8 0.13
Percent of protruding struts, % ± SD 2.0 ± 2.4 6.9 ± 7.9 4.4 ± 6.3 1.6 ± 2.7 0.03
Neointimal thickness, mm ± SD 64 ± 33 68 ± 40 66 ± 36 102 ± 44 <0.01 Morphometry Reference segment EEM CSA, mm2± SD 11.7 ± 4.1 14.1 ± 4.2 12.9 ± 4.3 11.7 ± 3.7 0.27 Lumen CSA, mm2± SD 6.2 ± 2.6 8.4 ± 3.5 7.3 ± 3.2 6.8 ± 2.6 0.69 In-stent EEM CSA, mm2± SD 11.2 ± 2.3 15.5 ± 5.2 13.3 ± 4.5 11.9 ± 2.5 0.28 Lumen CSA, mm2± SD 5.6 ± 1.5 8.5 ± 2.9 7.1 ± 2.7 6.3 ± 1.7 0.34 Stent CSA, mm2± SD 6.0 ± 2.0 9.0 ± 3.1 7.4 ± 2.9 7.4 ± 1.8 0.56 Stent length, mm ± SD 18.7 ± 9.7 20.3 ± 10.5 19.5 ± 10.3 24.2 ± 8.4 <0.01 Neointima CSA, mm2± SD 0.52 ± 0.41 0.68 ± 0.60 0.60 ± 0.52 1.19 ± 0.62 <0.001 Lumen volume, mm3± SD 105 ± 64 170 ± 96 138 ± 87 147 ± 51 0.08 Stent volume, mm3± SD 112 ± 62 180 ± 105 146 ± 92 176 ± 60 <0.01 Neointima volume, mm3± SD 8.4 ± 6.7 13.6 ± 13.7 11.0 ± 11.0 29.2 ± 19.2 <0.001
BES = biolimus-eluting stent; BVS = bioresorbable vascular scaffold; CSA = cross-sectional area; EEM = external elastic membrane; EES = everolimus-eluting stent; OCT = optical coherence tomography
(SNSF) - CR32I3_150271 / 1. All other authors have no conflict of interest to declare.
Authors’ contribution: SP and SC contributed equally and
should be considered shared senior authors.
Correspondence: Professor Stéphane Cook, MD, Department
of Cardiology, University and Hospital Fribourg, CH-1708 Fribourg,stephane.cook[at]unifr.ch
References
1 Dibra A, Kastrati A, Alfonso F, Seyfarth M, Perez-Vizcayno MJ, Me-hilli J, Schomig A. Effectiveness of drug-eluting stents in patients with bare-metal in-stent restenosis: meta-analysis of randomized trials. J Am Coll Cardiol. 2007;49(5):616–23.
2 Joner M, Finn AV, Farb A, Mont EK, Kolodgie FD, Ladich E, et al. Pathology of drug-eluting stents in humans: delayed healing and late thrombotic risk. J Am Coll Cardiol. 2006;48(1):193–202.
3 Nakazawa G. Stent thrombosis of drug eluting stent: pathological per-spective. J Cardiol. 2011;58(2):84–91.
4 Kedhi E, Joesoef KS, McFadden E, Wassing J, van Mieghem C, Goed-hart D, Smits PC. Second-generation everolimus-eluting and paclitaxel-eluting stents in real-life practice (COMPARE): a randomised trial. Lancet. 2010;375(9710):201–9.
5 Park KW, Chae IH, Lim DS, Han KR, Yang HM, Lee HY, et al. Everolimus-eluting versus sirolimus-eluting stents in patients undergo-ing percutaneous coronary intervention: the EXCELLENT (Efficacy of Xience/Promus Versus Cypher to Reduce Late Loss After Stenting) ran-domized trial. J Am Coll Cardiol. 2011;58(18):1844–54.
6 Stone GW, Rizvi A, Newman W, Mastali K, Wang JC, Caputo R, et al. Everolimus-eluting versus paclitaxel-eluting stents in coronary artery disease. N Engl J Med. 2010;362(18):1663–74.
7 Byrne RA, Kastrati A, Massberg S, Wieczorek A, Laugwitz KL, Had-amitzky M, et al. Biodegradable polymer versus permanent polymer drug-eluting stents and everolimus- versus sirolimus-eluting stents in patients with coronary artery disease: 3-year outcomes from a random-ized clinical trial. J Am Coll Cardiol. 2011;58(13):1325–31. 8 Raber L, Juni P, Nuesch E, Kalesan B, Wenaweser P, Moschovitis
A, et al. Long-term comparison of everolimus-eluting and sirolimus-eluting stents for coronary revascularization. J Am Coll Cardiol. 2011;57(21):2143–51.
9 Chevalier B, Silber S, Park SJ, Garcia E, Schuler G, Suryapranata H, et al. Randomized comparison of the Nobori Biolimus A9-eluting coron-ary stent with the Taxus Liberte paclitaxel-eluting coroncoron-ary stent in pa-tients with stenosis in native coronary arteries: the NOBORI 1 trial –Phase 2. Circ Cardiovasc Interv. 2009;2(3):188–95.
10 Stefanini GG, Kalesan B, Serruys PW, Heg D, Buszman P, Linke A, et al. Long-term clinical outcomes of biodegradable polymer biolimus-eluting stents versus durable polymer sirolimus-biolimus-eluting stents in pa-tients with coronary artery disease (LEADERS): 4 year follow-up of a randomised non-inferiority trial. Lancet. 2011;378(9807):1940–8. 11 Serruys PW, Farooq V, Kalesan B, de Vries T, Buszman P, Linke A,
et al. Improved safety and reduction in stent thrombosis associated with biodegradable polymer-based biolimus-eluting stents versus dur-able polymer-based sirolimus-eluting stents in patients with coronary artery disease: final 5-year report of the LEADERS (Limus Eluted From A Durable Versus ERodable Stent Coating) randomized, nonin-feriority trial. JACC Cardiovasc Interv. 2013;6(8):777–89.
12 Smits PC, Hofma S, Togni M, Vazquez N, Valdes M, Voudris V, et al. Abluminal biodegradable polymer biolimus-eluting stent versus
dur-able polymer everolimus-eluting stent (COMPARE II): a randomised, controlled, non-inferiority trial. Lancet. 2013;381(9867):651–60. 13 Puricel S, Oberhansli M, Guntern P, Lehmann S, Goy JJ, Arroyo D, et
al. Long-term comparison of everolimus-eluting and biolimus-eluting stents. EuroIntervention. 2013;9(3):336–44.
14 Barlis P, Regar E, Serruys PW, Dimopoulos K, van der Giessen WJ, van Geuns RJ, et al. An optical coherence tomography study of a biodegrad-able vs. durbiodegrad-able polymer-coated limus-eluting stent: a LEADERS trial sub-study. Eur Heart J. 2010;31(2):165–76.
15 Tada T, Kastrati A, Byrne RA, Schuster T, Cuni R, King LA, et al. Randomized comparison of biolimus-eluting stents with biodegrad-able polymer versus everolimus-eluting stents with permanent polymer coatings assessed by optical coherence tomography. Int J Cardiovasc Imaging. 2014;30(3):495–504.
16 Kubo T, Akasaka T, Kozuma K, Kimura K, Fusazaki T, Okura H, et al. Vascular Response to Drug-Eluting Stent With Biodegradable vs. Dur-able Polymer. Circ J. 2014;78(10):2408–14.
17 Gomez-Lara J, Radu M, Brugaletta S, Farooq V, Diletti R, Onuma Y, et al. Serial analysis of the malapposed and uncovered struts of the new generation of everolimus-eluting bioresorbable scaffold with optical co-herence tomography. JACC Cardiovasc Interv. 2011;4(9):992–1001. 18 Gogas BD, Radu M, Onuma Y, Perkins L, Powers JC, Gomez-Lara J,
et al. Evaluation with in vivo optical coherence tomography and histo-logy of the vascular effects of the everolimus-eluting bioresorbable vas-cular scaffold at two years following implantation in a healthy porcine coronary artery model: implications of pilot results for future pre-clin-ical studies. Int J Cardiovasc Imaging. 2012;28(3):499–511. 19 Arroyo D, Togni M, Puricel S, Gerard B, Sonja L, Corpataux N, et al.
Comparison of everolimus-eluting and biolimus-eluting coronary stents with everolimus-eluting bioresorbable scaffold: study protocol of the randomized controlled EVERBIO II trial. Trials. 2014;15:9. 20 Puricel S, Arroyo D, Corpataux N, Baeriswyl G, Lehmann S,
Kallinikou Z, et al. Comparison of everolimus- and biolimus-eluting coronary stents with everolimus-eluting bioresorbable vascular scaf-folds. J Am Coll Cardiol. 2015;65(8):791–801.
21 Serruys PW, Onuma Y, Ormiston JA, de Bruyne B, Regar E, Dudek D, et al. Evaluation of the second generation of a bioresorbable ever-olimus drug-eluting vascular scaffold for treatment of de novo coronary artery stenosis: six-month clinical and imaging outcomes. Circulation. 2010;122(22):2301–12.
22 Serruys PW, Onuma Y, Dudek D, Smits PC, Koolen J, Chevalier B, et al. Evaluation of the second generation of a bioresorbable everolimus-eluting vascular scaffold for the treatment of de novo coronary artery stenosis: 12-month clinical and imaging outcomes. J Am Coll Cardiol. 2011;58(15):1578–88.
23 Cook S, Eshtehardi P, Kalesan B, Raber L, Wenaweser P, Togni M, et al. Impact of incomplete stent apposition on long-term clinical out-come after drug-eluting stent implantation. Eur Heart J. 2012;33(11):1334–43.
24 Cook S, Wenaweser P, Togni M, Billinger M, Morger C, Seiler C, et al. Incomplete stent apposition and very late stent thrombosis after drug-eluting stent implantation. Circulation. 2007;115(18):2426–34. 25 Guagliumi G, Sirbu V, Musumeci G, Gerber R, Biondi-Zoccai G,
Ikejima H, et al. Examination of the in vivo mechanisms of late drug-eluting stent thrombosis: findings from optical coherence tomography and intravascular ultrasound imaging. JACC Cardiovasc Interv. 2012;5(1):12–20.
26 Teramoto T, Ikeno F, Otake H, Lyons JK, van Beusekom HM, Fearon WF, Yeung AC. Intriguing peri-strut low-intensity area detected by op-tical coherence tomography after coronary stent deployment. Circ J. 2010;74(6):1257–9.
Appendix
Supplemental information about the methods
OCT acquisition and analysis
Each stent strut condition was classified into one of the following categories: (a) well-apposed to the vessel wall with neointimal coverage over
the strut, (b) well-apposed to the vessel wall without neointimal coverage, (c) malapposed to the vessel wall with neointimal coverage, (d)
mal-apposed to the vessel wall without neointimal coverage, (e) protruding to the vessel wall with neointimal coverage and (f) protruding to the
vessel wall without neointimal coverage. The maximum length of a segment with uncovered struts and strut malapposition was estimated as the
number of consecutive frames of 0.2 mm of uncovered and malapposed struts, respectively.
Statistical analysis
At the time of study initiation and based on available data from ABSORB Cohort B [
1
] (2% uncovered struts at 6 months; 1% at 24 months)
and data from studies assessing EES and BES (3‒4% uncovered struts at 9 months), [
2
–
4
] we estimated a difference of 1% uncovered struts
in favour of BVS. The analysis of 3 889 struts in the BVS and 7 778 in the EES&BES group would yield 90% statistical power at a two-sided
alpha level of 0.05 to detect that difference accounting for the unequal allocation ratio. Therefore, 39 patients in the EES/BES and 19 patients
in the BVS-group were needed (200 struts expected per patient). In order to account for unreadable pullbacks and underestimation of struts per
patient, we increased the number of patients to 47 in the EES&BES group and 29 in the BVS group.
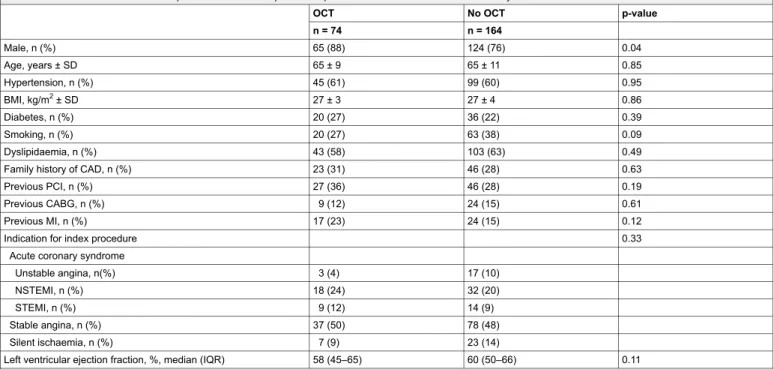
Supplementary tables
Table S1a: Baseline characteristics of patients included compared with patients not included in the OCT substudy.
OCT No OCT p-value
n = 74 n = 164 Male, n (%) 65 (88) 124 (76) 0.04 Age, years ± SD 65 ± 9 65 ± 11 0.85 Hypertension, n (%) 45 (61) 99 (60) 0.95 BMI, kg/m2± SD 27 ± 3 27 ± 4 0.86 Diabetes, n (%) 20 (27) 36 (22) 0.39 Smoking, n (%) 20 (27) 63 (38) 0.09 Dyslipidaemia, n (%) 43 (58) 103 (63) 0.49
Family history of CAD, n (%) 23 (31) 46 (28) 0.63
Previous PCI, n (%) 27 (36) 46 (28) 0.19
Previous CABG, n (%) 9 (12) 24 (15) 0.61
Previous MI, n (%) 17 (23) 24 (15) 0.12
Indication for index procedure 0.33
Acute coronary syndrome
Unstable angina, n(%) 3 (4) 17 (10)
NSTEMI, n (%) 18 (24) 32 (20)
STEMI, n (%) 9 (12) 14 (9)
Stable angina, n (%) 37 (50) 78 (48)
Silent ischaemia, n (%) 7 (9) 23 (14)
Left ventricular ejection fraction, %, median (IQR) 58 (45–65) 60 (50–66) 0.11
BMI = body mass index; CABG = coronary artery bypass graft; CAD = coronary artery disease; MI = myocardial infarction; NSTEMI = non-ST elevation myocardial infarction; OCT = optical coherence tomography; PCI = percutaneous coronary intervention; SD = standard deviation; STEMI = ST elevation myocardial infarction
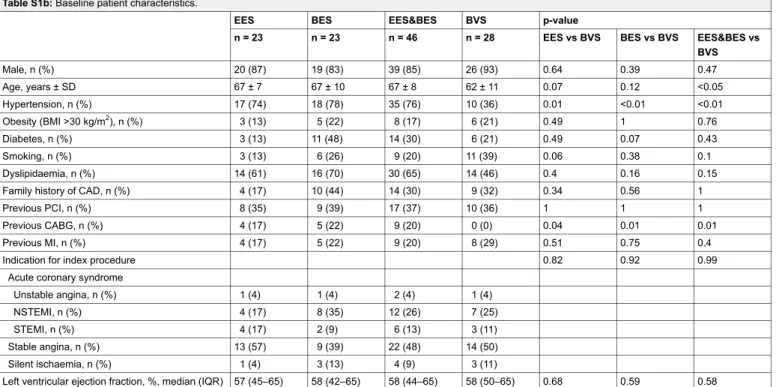
Table S1b: Baseline patient characteristics.
EES BES EES&BES BVS p-value
n = 23 n = 23 n = 46 n = 28 EES vs BVS BES vs BVS EES&BES vs BVS Male, n (%) 20 (87) 19 (83) 39 (85) 26 (93) 0.64 0.39 0.47 Age, years ± SD 67 ± 7 67 ± 10 67 ± 8 62 ± 11 0.07 0.12 <0.05 Hypertension, n (%) 17 (74) 18 (78) 35 (76) 10 (36) 0.01 <0.01 <0.01 Obesity (BMI >30 kg/m2), n (%) 3 (13) 5 (22) 8 (17) 6 (21) 0.49 1 0.76 Diabetes, n (%) 3 (13) 11 (48) 14 (30) 6 (21) 0.49 0.07 0.43 Smoking, n (%) 3 (13) 6 (26) 9 (20) 11 (39) 0.06 0.38 0.1 Dyslipidaemia, n (%) 14 (61) 16 (70) 30 (65) 14 (46) 0.4 0.16 0.15
Family history of CAD, n (%) 4 (17) 10 (44) 14 (30) 9 (32) 0.34 0.56 1
Previous PCI, n (%) 8 (35) 9 (39) 17 (37) 10 (36) 1 1 1
Previous CABG, n (%) 4 (17) 5 (22) 9 (20) 0 (0) 0.04 0.01 0.01
Previous MI, n (%) 4 (17) 5 (22) 9 (20) 8 (29) 0.51 0.75 0.4
Indication for index procedure 0.82 0.92 0.99
Acute coronary syndrome
Unstable angina, n (%) 1 (4) 1 (4) 2 (4) 1 (4)
NSTEMI, n (%) 4 (17) 8 (35) 12 (26) 7 (25)
STEMI, n (%) 4 (17) 2 (9) 6 (13) 3 (11)
Stable angina, n (%) 13 (57) 9 (39) 22 (48) 14 (50)
Silent ischaemia, n (%) 1 (4) 3 (13) 4 (9) 3 (11)
Left ventricular ejection fraction, %, median (IQR) 57 (45–65) 58 (42–65) 58 (44–65) 58 (50–65) 0.68 0.59 0.58 BES = biolimus-eluting stent; BMI = body mass index; BVS = bioresorbable vascular scaffold; CABG = coronary artery bypass graft; CAD = coronary artery disease; EES = everolimus-eluting stent; MI = myocardial infarction; NSTEMI = non-ST segment elevation myocardial infarction; PCI = percutaneous coronary intervention; SD = standard deviation; STEMI = ST segment elevation myocardial infarction.
Table S2: Procedural characteristics.
EES BES EES&BES BVS p-value
n = 26 n = 26 n = 52 n = 33 EES vs BVS BES vs BVS EES&BES vs BVS Target vessel 0.46 0.02 0.17 LM, n (%) 0 (0) 0 (0) 0 (0) 0 (0) LAD, n (%) 12 (48) 7 (27) 19 (37) 20 (61) LCX, n (%) 6 (24) 2 (8) 8 (16) 4 (12) RCA, n (%) 7 (28) 15 (58) 22 (43) 9 (27) SVG, n (%) 0 (0) 2 (8) 2 (4) 0 (0) Lesion type 0.18 0.26 0.21 De novo, n (%) 22 (85) 23 (88) 45 (87) 32 (97) Restenosis, n (%) 2 (8) 1 (4) 3 (6) 1 (3) CTO, n (%) 2 (8) 2 (8) 4 (8) 0 (0)
TIMI flow postintervention per lesion
Baseline, n ± SD 2.8 ± 0.8 2.9 ± 0.6 2.8 ± 0.7 3.0 ± 0.2 0.4 0.85 0.54
Postprocedure, n ± SD 2.9 ± 0.2 3.0 ± 0 3.0 ± 0.1 3.0 ± 0 0.26 0.85 0.43
Thrombus aspiration, n (%) 3 (12) 3 (12) 6 (12) 2 (6) 0.65 0.65 0.48
Direct stenting, n (%) 3 (12) 6 (23) 9 (17) 1 (3) 0.31 0.64 0.08
Total stent length, mm ± SD 23 ± 15 24 ± 14 23 ± 15 26 ± 12 0.12 0.06 0.04
Maximum stent diameter, mm ± SD 2.91 ± 0.44 3.34 ± 0.56 3.13 ± 0.54 3.12 ± 0.38 0.06 0.09 0.95
Maximum inflation pressure, atm ± SD 16 ± 3 13 ± 2 14 ± 3 13 ± 3 <0.01 0.06 0.12
Postdilatation, n (%) 8 (31) 12 (46) 20 (38) 14 (42) 0.42 0.80 0.82 QCA measurements Preprocedure RVD, mm ± SD 2.51 ± 0.60 2.70 ± 1.12 2.61 ± 0.89 2.79 ± 0.55 0.13 0.63 0.52 MLD, mm ± SD 0.46 ± 0.44 0.66 ± 0.63 0.56 ± 0.55 0.38 ± 0.31 0.31 0.80 0.46 Diameter stenosis, % ± SD 84 ± 15 80 ± 19 81 ± 17 86 ± 12 0.74 0.44 0.52 Postprocedure MLD, in-stent, mm ± SD 2.67 ± 0.44 2.96 ± 0.48 2.82 ± 0.48 2.56 ± 0.40 0.61 <0.001 0.01 MLD, in-segment, mm ± SD 2.20 ± 0.53 2.55 ± 0.59 2.37 ± 0.58 2.35 ± 0.52 0.28 0.18 0.85
Diameter stenosis, in-stent, % ± SD 10 ± 7 8 ± 7 9 ± 7 10 ± 6 0.99 0.04 0.23
Diameter stenosis, in-segment, % ± SD 10 ± 11 11 ± 10 11 ± 11 11 ± 7 0.33 0.80 0.46
Acute gain, in-stent, % ± SD 2.21 ± 0.48 2.29 ± 0.57 2.25 ± 0.52 2.19 ± 0.47 0.61 0.84 0.67
Acute gain, in-segment, % ± SD 1.74 ± 0.43 1.90 ± 0.53 1.82 ± 0.49 1.98 ± 0.61 0.08 0.64 0.18
Acute recoil, % ± SD 7 ± 5 10 ± 5 8 ± 5 10 ± 8 0.14 0.99 0.39
9 months
MLD, in-stent, mm ± SD 2.42 ± 0.55 2.87 ± 0.56 2.65 ± 0.59 2.22 ± 0.44 0.14 <0.001 <0.001
MLD, in-segment, mm ± SD 1.86 ± 0.55 2.50 ± 0.56 2.18 ± 0.64 1.97 ± 0.48 0.41 <0.001 0.12
Diameter stenosis, in-stent, % ± SD 12 ± 9 10 ± 6 11 ± 8 17 ± 11 0.01 <0.01 <0.01
Diameter stenosis, in-segment, % ± SD 18 ± 13 9 ± 6 14 ± 11 20 ± 15 0.74 <0.01 0.09
Late lumen loss, in-stent, mm ± SD 0.25 ± 0.28 0.09 ± 0.30 0.17 ± 0.30 0.33 ± 0.43 0.49 0.04 0.10
Late lumen loss, in-segment, mm ± SD 0.33 ± 0.38 0.05 ± 0.36 0.19 ± 0.40 0.40 ± 0.45 0.61 <0.01 0.04 BES = biolimus-eluting stent; BVS = bioresorbable vascular scaffold; CTO = chronic total occlusion; EES = everolimus-eluting stent; LAD = left anterior descending; LCX = left circumflex; LM = left main; MLD = minimal lumen diameter; QCA =quantitative coronary angiography; RCA = right coronary artery; RVD = reference vessel diameter; SD = standard deviation; SVG = saphenous vein graft; TIMI = Thrombolysis in Myocardial Infarction study group.
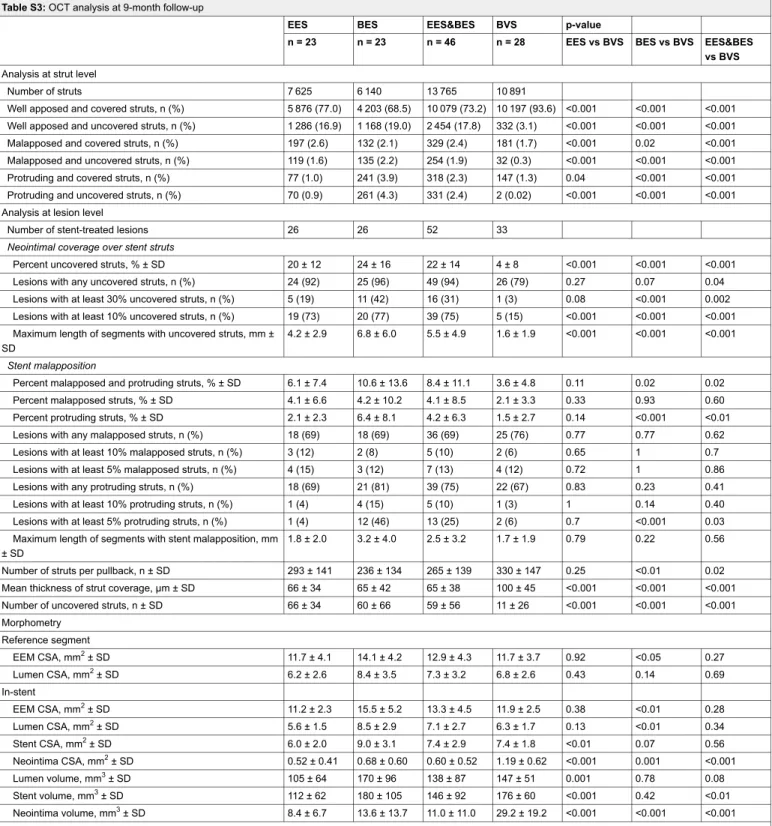
Table S3: OCT analysis at 9-month follow-up
EES BES EES&BES BVS p-value
n = 23 n = 23 n = 46 n = 28 EES vs BVS BES vs BVS EES&BES vs BVS
Analysis at strut level
Number of struts 7 625 6 140 13 765 10 891
Well apposed and covered struts, n (%) 5 876 (77.0) 4 203 (68.5) 10 079 (73.2) 10 197 (93.6) <0.001 <0.001 <0.001 Well apposed and uncovered struts, n (%) 1 286 (16.9) 1 168 (19.0) 2 454 (17.8) 332 (3.1) <0.001 <0.001 <0.001
Malapposed and covered struts, n (%) 197 (2.6) 132 (2.1) 329 (2.4) 181 (1.7) <0.001 0.02 <0.001
Malapposed and uncovered struts, n (%) 119 (1.6) 135 (2.2) 254 (1.9) 32 (0.3) <0.001 <0.001 <0.001
Protruding and covered struts, n (%) 77 (1.0) 241 (3.9) 318 (2.3) 147 (1.3) 0.04 <0.001 <0.001
Protruding and uncovered struts, n (%) 70 (0.9) 261 (4.3) 331 (2.4) 2 (0.02) <0.001 <0.001 <0.001 Analysis at lesion level
Number of stent-treated lesions 26 26 52 33
Neointimal coverage over stent struts
Percent uncovered struts, % ± SD 20 ± 12 24 ± 16 22 ± 14 4 ± 8 <0.001 <0.001 <0.001
Lesions with any uncovered struts, n (%) 24 (92) 25 (96) 49 (94) 26 (79) 0.27 0.07 0.04
Lesions with at least 30% uncovered struts, n (%) 5 (19) 11 (42) 16 (31) 1 (3) 0.08 <0.001 0.002
Lesions with at least 10% uncovered struts, n (%) 19 (73) 20 (77) 39 (75) 5 (15) <0.001 <0.001 <0.001 Maximum length of segments with uncovered struts, mm ±
SD
4.2 ± 2.9 6.8 ± 6.0 5.5 ± 4.9 1.6 ± 1.9 <0.001 <0.001 <0.001 Stent malapposition
Percent malapposed and protruding struts, % ± SD 6.1 ± 7.4 10.6 ± 13.6 8.4 ± 11.1 3.6 ± 4.8 0.11 0.02 0.02
Percent malapposed struts, % ± SD 4.1 ± 6.6 4.2 ± 10.2 4.1 ± 8.5 2.1 ± 3.3 0.33 0.93 0.60
Percent protruding struts, % ± SD 2.1 ± 2.3 6.4 ± 8.1 4.2 ± 6.3 1.5 ± 2.7 0.14 <0.001 <0.01
Lesions with any malapposed struts, n (%) 18 (69) 18 (69) 36 (69) 25 (76) 0.77 0.77 0.62
Lesions with at least 10% malapposed struts, n (%) 3 (12) 2 (8) 5 (10) 2 (6) 0.65 1 0.7
Lesions with at least 5% malapposed struts, n (%) 4 (15) 3 (12) 7 (13) 4 (12) 0.72 1 0.86
Lesions with any protruding struts, n (%) 18 (69) 21 (81) 39 (75) 22 (67) 0.83 0.23 0.41
Lesions with at least 10% protruding struts, n (%) 1 (4) 4 (15) 5 (10) 1 (3) 1 0.14 0.40
Lesions with at least 5% protruding struts, n (%) 1 (4) 12 (46) 13 (25) 2 (6) 0.7 <0.001 0.03
Maximum length of segments with stent malapposition, mm ± SD
1.8 ± 2.0 3.2 ± 4.0 2.5 ± 3.2 1.7 ± 1.9 0.79 0.22 0.56
Number of struts per pullback, n ± SD 293 ± 141 236 ± 134 265 ± 139 330 ± 147 0.25 <0.01 0.02
Mean thickness of strut coverage, μm ± SD 66 ± 34 65 ± 42 65 ± 38 100 ± 45 <0.001 <0.001 <0.001
Number of uncovered struts, n ± SD 66 ± 34 60 ± 66 59 ± 56 11 ± 26 <0.001 <0.001 <0.001
Morphometry Reference segment EEM CSA, mm2± SD 11.7 ± 4.1 14.1 ± 4.2 12.9 ± 4.3 11.7 ± 3.7 0.92 <0.05 0.27 Lumen CSA, mm2± SD 6.2 ± 2.6 8.4 ± 3.5 7.3 ± 3.2 6.8 ± 2.6 0.43 0.14 0.69 In-stent EEM CSA, mm2± SD 11.2 ± 2.3 15.5 ± 5.2 13.3 ± 4.5 11.9 ± 2.5 0.38 <0.01 0.28 Lumen CSA, mm2± SD 5.6 ± 1.5 8.5 ± 2.9 7.1 ± 2.7 6.3 ± 1.7 0.13 <0.01 0.34 Stent CSA, mm2± SD 6.0 ± 2.0 9.0 ± 3.1 7.4 ± 2.9 7.4 ± 1.8 <0.01 0.07 0.56 Neointima CSA, mm2± SD 0.52 ± 0.41 0.68 ± 0.60 0.60 ± 0.52 1.19 ± 0.62 <0.001 0.001 <0.001 Lumen volume, mm3± SD 105 ± 64 170 ± 96 138 ± 87 147 ± 51 0.001 0.78 0.08 Stent volume, mm3± SD 112 ± 62 180 ± 105 146 ± 92 176 ± 60 <0.001 0.42 <0.01 Neointima volume, mm3± SD 8.4 ± 6.7 13.6 ± 13.7 11.0 ± 11.0 29.2 ± 19.2 <0.001 <0.001 <0.001
BES = biolimus-eluting stent; BVS = bioresorbable vascular scaffold; CSA = cross-sectional area; EEM = external elastic membrane; EES = everolimus-eluting stent; OCT = optical coherence tomography; SD = standard deviation
Supplementary references
1 Ormiston JA, Serruys PW, Onuma Y, van Geuns RJ, de Bruyne B, Dudek D, et al. First serial assessment at 6 months and 2 years of the second generation of absorb everolimus-eluting bioresorbable vascular scaffold: a multi-imaging modality study. Circ Cardiovasc Interv 2012;5(5):620–32.
2 Barlis P, Regar E, Serruys PW, Dimopoulos K, van der Giessen WJ, et al. An optical coherence tomography study of a biodegradable vs. durable polymer-coated limus-eluting stent: a LEADERS trial sub-study. Eur Heart J 2010;31(2):165–76.
3 Inoue T, Shite J, Yoon J, Shinke T, Otake H, Sawada T, et al. Optical coherence evaluation of everolimus-eluting stents 8 months after implantation. Heart 2011;97(17):1379–84. 4 Choi HH, Kim JS, Yoon DH, Hong KS, Kim TH, Kim BK, et al. Favorable neointimal coverage in everolimus-eluting stent at 9 months after stent implantation: comparison with
Figures (large format)
Figure 1
Representative images of OCT analysis of BVS and DES. This image shows the analysis of stent/scaffold area. After identifying all struts in a cross-section, stent/scaffold area was delineated by a curvilinear interpolation connecting the middle points of the struts at mid-strut depth. BVS = bioresorbable vascular scaffold; DES = drug-eluting stent; OCT = optical coherence tomography
Figure 2
Patient flow chart.
BES = biolimus-eluting stent; BVS = bioresorbable vascular scaffold; EES = everolimus-eluting stent; OCT = optical coherence tomography
Figure 3a and b
Frequency distribution of mean neointima thickness at intervals of 50 µm.
a
b
Figure 4a and b
Cumulative frequency distribution of mean neointima volume at 9 months.
The numbers provided are mean ± standard deviation. BES = biolimus-eluting stent; BVS = bioresorbable vascular scaffold; EES = everolimus-eluting stent.
Figure 5
Graphical representation of strut coverage and malapposition in lesions.
Lesions = horizontal gray bars, uncovered struts = red lines, malapposed struts = blue lines, according to geographical location on stent/ scaffold.