ANDEAN SPECIATION AND
VICARIANCE IN NEOTROPICAL
MACROCARPAEA
(GENTIANACEAE–HELIEAE)
1 Lena Struwe,2,3 Scott Haag,4 Einar Heiberg,5 and Jason R. Grant6 ABSTRACTThe genus Macrocarpaea (Griseb.) Gilg (Gentianaceae, Helieae) is among the largest woody genera of tropical gentians, with most of its species occurring in the wet mountainous forests of the Andes. Phylogenetic and dispersal-vicariance analyses (DIVA) of 57 of the 105 currently recognized species in the genus, using two data sets from nuclear DNA (ITS and 5S-NTS sequences) and morphology, show a single origin of the Andean species from an ancestral distribution that includes southeastern Brazil. Within the Andes, species divide into two major clades: (1) northern species from the cordilleras of northern Ecuador, Colombia, and Venezuela; and (2) southern species of the Andean Amotape–Huancabamba Zone in Ecuador and Peru, as well as the Andes of central and southern Peru and Bolivia. The Amotape–Huancabamba Zone is supported as the ancestral area for Macrocarpaea within the Andes. There are repeated speciation patterns within the Andes, and three Mesoamerican species derive from the northern clade, as is the single sampled species from the Guayana Shield. The position of the subclade of the three Caribbean species is less certain, but it currently nests among Andean species. An Atlantic coastal Brazilian clade is placed as sister group to all other Macrocarpaea, providing further support for an ancestral refuge in southeastern Brazil for the Helieae. The biogeographic analysis showed that local speciation is more common than long-distance dispersal, and allopatric speciation is more common than sympatric speciation. Using detailed, georeferenced herbarium collection data, patterns in environmental characteristics between clades and sister species were analyzed with Spatial Evolutionary and Ecological Vicariance Analysis (SEEVA), utilizing geographic information system (GIS) and statistical methods. Sister clades and taxa were evaluated for statistical significance in variables such as annual rainfall and temperature, elevation, temperature and rainfall seasonality, geological bedrock age, and soil type to evaluate ecological vicariance between sister groups. The results indicate that there are no general patterns for each variable, but that there are many significant divergences in ecological niches between both larger sister groups and sister species, and ecological niche conservation was also observed when subsequent nodes in the phylogeny were compared.
Key words: Biogeography, ecology, Gentianaceae, Macrocarpaea, Neotropics, niche, South America, speciation, vicariance.
The tropical Andes are one of the most biologically diverse areas in the world and a biodiversity hotspot (Myers et al., 2000; Rodrı´guez-Mahecha et al., 2004a, b; Jørgensen et al., 2007; Morawetz & Raedig, 2007), despite being a relatively young part of South America
due to recent geological uplift. Biodiversity in South America and Andean biogeography has been reviewed by Burnham and Graham (1999) and Young et al. (2002), highlighting the complex history, topography, and vegetation patterns of the Andes. The high
1This study was funded by the National Science Foundation (grant 0317612) and USDA-Rutgers University (Hatch
no. 102211) to L.S., and the Swiss National Science Foundation (grants 3100-052885, 3100-065395) and Swiss Academy of Sciences (SCNAT) to J.R.G. The authors wish to express their sincere thanks to Peter Smouse and Richard G. Lathrop for constructive discussions and collaboration with SEEVA development. We also thank the following herbaria and their staff for their valuable help in accessing their collections and providing information: AAU, AFP (Herbario ‘‘A´ lvaro Ferna´ndez Pe´rez,’’ Popaya´n, Cauca, Colombia), ALA, B, BM, BP, BR, BRIT, BSB, C, CAS, CAUP, CHOCO, CHRB, COAH, COL, CONN, CR, CUVC, CUZ, DAV, DUKE, E, EHH, F, FAUC, FI, FLAS, FMB, FR, G, GB, GH, GOET, HAC, HAL, HAM, HAO, HUA, HUCP, HUQ, HUT, IAN, INB, INPA, JAUM, JBSD, JE, K, L, LD, LINN, LOJA, LPB, LS, M, MA, MANCH, MARY, MBM, MEDEL, MER, MG, MICH, MIN, MO, MOL, MSB, MU, MY, NA, NEU, NO, NSW, NY, OXF, P, PH, PORT, PR, PRC, Q, QAP, QCA, QCNE, QPLS, QUSF, R, RB, RNG, S, SBBG, SEL, SP, SPF, TEX, U, UC, UCWI, UDBC, UPCB, UPS, UPTC, US, USM, VALLE, VEN, W, WIS, WU, YU, and Z.
2Department of Ecology, Evolution, and Natural Resources, Rutgers University, 14 College Farm Road, New Brunswick,
New Jersey 08901, U.S.A. struwe@aesop.rutgers.edu.
3Department of Plant Biology and Pathology, Rutgers University, 59 Dudley Road, New Brunswick, New Jersey 08901,
U.S.A.
4Center for Remote Sensing and Spatial Analysis, Rutgers University, 14 College Farm Road, New Brunswick, New Jersey
08901-8551, U.S.A.
5Department of Clinical Physiology, Lund University Hospital, 221 85, Lund, Sweden.
6Laboratoire de botanique e´volutive, Institut de Biologie, Universite´ de Neuchaˆtel, rue Emile-Argand 11, CP 158, 2009
biodiversity has been explained through habitat diversity resulting from large differences in bedrock types, soils, climate, and elevation, which are also fragmented due to the dissected topography. Species have spread north and south along this jagged mountain chain, and also up and down in elevation during colder times through repeated glaciations. Both allopatric and sympatric speciation processes could have resulted in such large species diversity. Generally speaking, the theory behind sympatric speciation suggests that competition among popula-tions led to subsequent ecological niche divergence, whereas allopatric speciation invoked a spatial barrier and not necessarily any ecological niche separation (Mayr, 1963). This is applicable not only to extant sister species pairs, but also to deeper clades in the phylogeny that represent ancient allopatric or sym-patric events.
Progress in methodological developments has now made it possible to evaluate phylogenetic patterns and speciation processes in a historical and spatial context including ecological data. In this study, we use molecular and morphological data for phylogenetic reconstruction using parsimony criteria, dispersal-vicariance analysis (DIVA) for reconstruction of ancestral areas (Ronquist, 1997), and Spatial Evolu-tionary and Ecological Vicariance Analysis (SEEVA) (Struwe, 2008).
In this paper, we will evaluate several hypotheses based on a comprehensive data set from Macrocarpaea (Griseb.) Gilg.
1. Continental patterns: What is the relationship between species in the Andes to species in Mesoamerica, the Caribbean, southeastern Bra-zil, and tepuis of the Guayana Shield? 2. Andean patterns: What is the ancestral
distri-bution area in the Andes and what large-scale Andean biogeographic patterns are present? 3. Speciation patterns: Is sympatric or allopatric
speciation most common in Andean species? Is dispersal or vicariance most common in Andean species?
4. Ecological niche patterns: Does allopatric spe-ciation indicate a relatively larger shift in ecological niche characteristics than sympatric speciation that occurs within the same area? Do vicariant (allopatric) versus overlapping (sym-patric) sister taxa have similar or divergent ecological niches?
Our study group, Macrocarpaea (Gentianaceae, Helieae), occurs in mountainous regions of the Neotropics at (30–)1500–3000(–3800) m elevation. It is composed of woody shrubs, small trees (up to 10 m), and herbs (one species; M. rubra Malme) with large (up to 7 cm long), campanulate, white, yellow, to
green flowers that are visited diurnally by humming-birds, butterflies, and insects, and nocturnally by bats and moths (Grant & Struwe, 2001; Grant, pers. obs.). Its woody habit is uncommon in the Gentianaceae and led to a comparative study of its wood anatomy indicating secondary derivation of woodiness from herbaceous ancestors (Carlquist & Grant, 2005). With 105 species currently recognized, Macrocarpaea is by far the most species-rich genus in the Helieae, while the majority of genera in this tribe are either monotypic or have less than 10 species, e.g., CelianthaMaguire and Yanomamua J. R. Grant, P. J. M. Maas & Struwe (Struwe et al., 2002; Grant et al., 2006). During monographic studies on Macrocarpaea, more than 3500 herbarium sheets were examined, resulting in the description of 70 new species (Grant & Struwe, 2001, 2003; Grant, 2003, 2004, 2005, 2007, 2008; Grant & Weaver, 2003). Fieldwork by Grant, especially in the Huancabamba region of Ecuador and Peru, continues to uncover new species that are often cryptically different from one another when seen as herbarium specimens, but are otherwise clearly distinct in the field. Likewise, molecular phylogenetics of Macrocarpaea (Struwe et al., 2009) has given strong support for its monophyly, for the establishment of an infrageneric classification (Grant, 2005), and to the understanding of difficult species complexes.
Macrocarpaea has a broad distribution in moun-tainous regions of the Neotropics and is comprised of generally narrowly endemic species. It occurs princi-pally in the Andes (87 species from Venezuela, Colombia, Ecuador, Peru, and Bolivia), with outlying species in the Pantepui of the Guayana Shield (six species), in southern Mesoamerica (five species in Costa Rica and Panama), in the Atlantic forest of southeastern Brazil (four species comprising section TabacifoliaeEwan), and in the Greater Antilles of the Caribbean (three species: one each from Cuba, Hispaniola, and Jamaica). The three main centers of diversity are in the Colombian Andes (section Macrocarpaea, where 58% of the species of that section occur), the Amotape–Huancabamba region straddling southern Ecuador and northern Peru (section Choriophylla (Griseb.) J. R. Grant, 74% of its species), and the central Peruvian Andes (section MagnolifoliaeEwan, 50% of its species). The genus is absent from lowland Amazonia, Mexico, Mesoamerica north of Costa Rica, and southern temperate South America. Here, we use Macrocarpaea as a model for understanding South American, and particularly Andean, speciation, biogeography, and dispersal. Because Macrocarpaea has many narrowly distributed Andean endemics, it is an excellent candidate for this kind of study.
MATERIALS ANDMETHODS PHYLOGENETIC DATA AND ANALYSES
Fifty-seven of 105 total species (54%) of Macro-carpaea, representing all sections as defined by Grant (2005), were included in the phylogenetic analysis (Table 1). Five outgroups were selected for orientation of the phylogenetic trees (Nixon & Carpenter, 1993), based on previous phylogenetic work in the Gentia-naceae and all of tribe Helieae using trnL and matK chloroplast data as well as nuclear ITS markers (Struwe et al., 2002, 2009). Outgroups used include Symbolanthus jasoniiJ. E. Molina & Struwe from the Symbolanthus G. Don subclade of Helieae, and Chorisepalum psychotrioidesEwan and three species of Tachia Aubl. (T. grandiflora Maguire & Weaver, T. guianensis Aubl., and T. occidentalis Maguire & Weaver) assigned to the Macrocarpaea subclade (Struwe et al., 2002).
The DNA data in this study were developed for a detailed phylogenetic study of the genus by Grant. For molecular data we used two different nuclear genomic areas, ITS and NTS (for 5S RNA [5S-NTS]). These regions have successfully resolved phylogenetic relationships in tribe Helieae on both generic and tribal scales in the past (Struwe et al., 2002, 2009; Gould & Struwe, 2004). Additional sequences for 57 species of Macrocarpaea and the selected outgroups were downloaded from GenBank (see Table 1 for GenBank numbers). In total, 47 ITS and 56 5S-NTS taxon-specific sequences were obtained from Macro-carpaea. Sequences were aligned using ClustalX (Thompson et al., 1997) and Se-Al v.2.0 for Macintosh (Rambaut, 2002).
In addition to molecular data, nine morphological characters were coded for all included species (Table 2), and these were primarily selected from pollen and seed surface structure (Grant & Struwe, 2001, 2003; Grant, 2003, 2004, 2005, 2007; Grant & Weaver, 2003). Four morphological seed types were identified by Grant (2005), including two types without wings (flattened and rimmed), and two with wings (perimetrically winged and winged). Character 1 refers to the general shape of the seeds, varying from three-dimensional (rectangular to spheroid) to com-pletely flattened, as does character 4 separating seed types with either a square or long-linear outline. Character 2 refers to the presence or absence of seed wings, and character 3 is coded based on whether these wings occur on opposite ends as in a bowtie (winged type) or surround the seed entirely (perimet-rically winged). Character 5 is the weight of an individual seed in milligrams, generally less than 0.1 mg in Macrocarpaea and greater than 0.1 mg in Chorisepalum Gleason & Wodehouse, Tachia, and
Symbolanthus. Character 6 refers to features of the pollen exine surface, and character 9 identifies whether the pollen is shed as monads or as tetrads or polyads. Character 7 differentiates the axillary flower position of Tachia, as compared to all other genera that have multiflowered terminal inflorescenc-es, and character 8 codes for the color of the corollas. Character states were treated as unordered, and characters were regarded of equal weight. The two DNA alignments were combined with the data matrix of nine morphological characters and analyzed together simultaneously.
The phylogenetic, unconstrained parsimony analy-sis was performed in Winclada and NONA (Goloboff, 1999; Nixon, 1999, 2002) using 500 random repli-cates, five starting trees per replicate, MaxTrees as 10,000, and the tree-swapping algorithm was multiple tree bisection-reconnection (TBR) + TBR. Bootstrap-ping was done with 300 replicates in PAUP* v.4 (Swofford, 2000).
COLLECTION DATA
A total of 794 georeferenced herbarium collection records of the 57 Macrocarpaea species included were entered into an existing FileMaker Pro 7.0 (Claris Pro, Santa Clara, California) database. Each locality was georeferenced using printed and online maps, atlases, and gazetteers. Identification of all collections was confirmed by Grant, and an exsiccatae list with the georeferenced coordinates is available upon request. Only recorded locations known to the nearest minute, nearest second, or label with global positioning system (GPS) coordinates were included in the analysis. Coordinates were converted to a point shapefile in ArcGIS v. 9.2 (ESRI, Redlands, California), and distribution maps of each species and the genus were produced.
BIOGEOGRAPHIC ANALYSIS
Nodes present in the selected most parsimonious tree were classified as either representing sympatric, partially sympatric, or allopatric species distributions based on data from individual species maps. This classification was used in comparing impact indices and P values for environmental species and clade data during the SEEVA analysis.
For the DIVA analysis, the total genus distribution was divided into 10 biogeographic units based on age, spatial structure and geographic connectivity, and geological coherence. The identified areas were: A, southeastern Brazil; B, Pantepui of the Guayana Shield; C, Greater Antilles of the Caribbean; D, Mesoamerica; E, Cordillera Central in Colombia and
Cordillera Oriental in Ecuador; F, Choco´ and Cordillera Occidental in Colombia and Ecuador; G, Cordillera Oriental and Me´rida in Colombia and Venezuela; H, Amotape–Huancabamba region in Ecuador and Peru; I, Cordillera Central in central Peru; J, Bolivia and Cordillera Central in southern Peru; K, Amazon Basin in Brazil, Colombia, Peru, and Venezuela. A map of the areas in northwestern South America is presented in Figure 1.
Areas were delimited based on spatial, historical, and geological features; some outliers were clearly disjunct, such as the Caribbean (C), tepuis on the Guayana Shield (B), and southeastern Brazil (A). For areas that are part of the Andean mountain chain and the Mesoamerican land bridge, their distinction is less obvious. The boundary between Mesoamerica (D) and the Choco´ and Cordillera Occidental in northwestern Colombia (F) follows evidence that lowland Darie´n in eastern Panama has a stronger geological and historical connection to northern South America than to western Panama (Clapperton, 1993). The three cordilleras in Colombia and two in northern Ecuador were treated as separate areas because deep valleys separate the mountain ranges. The Cordillera de Me´rida range in Venezuela is an extension of the Cordillera Oriental of Colombia and is included in the same area. The division between the Andean area of the Amotape–Huancabamba Zone (H) to the south and the Andean areas in northern Ecuador and Colombia (E + F) is correlated with the Amotape Cross, a geological shear zone at ca. 3uS in the continental crust of the South American Plate (Clapperton, 1993). The southernmost limit of area H is from Rı´o Chicama on the western side and Rı´o Huallaga on the eastern side of the Andes and corresponds to a disjunction zone found in other biogeographic studies (Weigend, 2002). The two southernmost Andean areas (I, J) in Peru and Bolivia are separated at the latitude of Rı´o Pisco and Rı´o Entero, which corresponds to the geological Abancay Deflection, another shear zone (Clapperton, 1993).
A dispersal-vicariance analysis was run using the software DIVA v. 1.1 (Ronquist, 1996), limiting the maximum number of optimized areas at each node to three (maxareas 5 3) and optimizing dispersal and vicariance events on a selected most parsimonious tree, because DIVA requires a fully resolved tree for its analysis. This tree was selected from all most parsimonious trees by being overall the most similar to the majority-rule consensus tree. The DIVA distribu-tion matrix is shown in Table 3. The DIVA optimi-zation method uses the parsimony criterion to limit the numbers of events (5 steps) per tree based on the distribution of each species. Ancestral areas were optimized at each internal node in a way that limits
vicariance and dispersal events as far as possible (i.e., it provides the simplest explanation of the current distribution data given the phylogeny). At several nodes, there were several equally likely area optimi-zations and we selected from among these based on additional data from geological and spatial informa-tion.
SEEVA ANALYSIS
The theoretical background and statistical expla-nations and justifications for SEEVA are outlined in Struwe (2008) and Heiberg and Struwe (2008), with a short overview given here. Environmental data were extracted using GIS from all georeferenced collection localities of each species. Each variable was divided into four or five categories that were either quantita-tive (e.g., rainfall amounts, in equally sized quartiles for the data overall) or qualitative (e.g., soil types) depending on data set. A table was prepared in Microsoft Excel (Microsoft, Redmond, Washington) that lists the number of collections per species for each variable (e.g., annual rainfall) and within each variable, for each category (e.g., 1–340, 341–732, 733–1277, 1278–4000 mm). The table was imported into the software SEEVA v. 0.4 (Heiberg, 2008) for statistical analysis. The selected phylogenetic tree was then imported into SEEVA.
Environmental point data for nine variables were extracted for the 794 Macrocarpaea collections using the following base layers in ArcGIS 9.2: elevation (U.S. Geological Survey; unit: m; format: grid; scale: 30 arc second), soil type (ESRI/ArcAtlas; format: vector; scale: 1:5–10,000,000), geology (unit: bedrock geologic age; U.S. Geological Survey; format: vector; scale: 1:1–5,000,000), annual mean temperature (BIO1; unit: uC 3 10; format: grid; scale: 1 km), temperature seasonality (BIO4; standard deviation 3 100; format: grid; scale: 1 km), minimum temperature of coldest month (BIO6; unit:uC 3 10; format: grid; scale: 1 km), annual precipitation (BIO12; unit: mm; format: grid; scale: 1 km), precipitation of driest month (BIO14; unit: mm; format: grid; scale: 1 km), precipitation seasonality (BIO15; unit: mm; format: grid; scale: 1 km), and precipitation seasonality (coefficient of variation; format: grid; scale: 1 km). All climate data were retrieved from WORLDCLIM (Hijmans et al., 2005).
For each node in the phylogenetic tree, extracted environmental data were pooled to represent data for each monophyletic group (clade) and compared with their sister group for each node. Ecologic data are measured for statistically significant differences be-tween clades based on the distribution in the four or five categories. All variables were analyzed
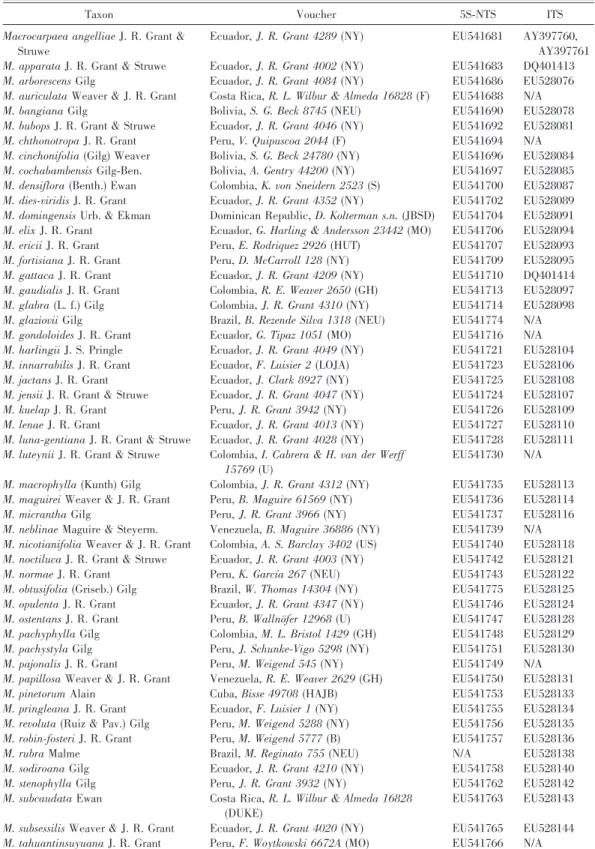
indepen-Table 1. Voucher and GenBank accession numbers for 5S-NTS and ITS sequences of Macrocarpaea and outgroups used for the phylogenetic analysis. N/A indicates sequences not available.
Taxon Voucher 5S-NTS ITS
Macrocarpaea angelliaeJ. R. Grant & Struwe
Ecuador, J. R. Grant 4289 (NY) EU541681 AY397760, AY397761 M. apparataJ. R. Grant & Struwe Ecuador, J. R. Grant 4002 (NY) EU541683 DQ401413 M. arborescensGilg Ecuador, J. R. Grant 4084 (NY) EU541686 EU528076 M. auriculataWeaver & J. R. Grant Costa Rica, R. L. Wilbur & Almeda 16828 (F) EU541688 N/A M. bangianaGilg Bolivia, S. G. Beck 8745 (NEU) EU541690 EU528078 M. bubopsJ. R. Grant & Struwe Ecuador, J. R. Grant 4046 (NY) EU541692 EU528081 M. chthonotropaJ. R. Grant Peru, V. Quipuscoa 2044 (F) EU541694 N/A M. cinchonifolia(Gilg) Weaver Bolivia, S. G. Beck 24780 (NY) EU541696 EU528084 M. cochabambensisGilg-Ben. Bolivia, A. Gentry 44200 (NY) EU541697 EU528085 M. densiflora(Benth.) Ewan Colombia, K. von Sneidern 2523 (S) EU541700 EU528087 M. dies-viridisJ. R. Grant Ecuador, J. R. Grant 4352 (NY) EU541702 EU528089 M. domingensisUrb. & Ekman Dominican Republic, D. Kolterman s.n. (JBSD) EU541704 EU528091 M. elixJ. R. Grant Ecuador, G. Harling & Andersson 23442 (MO) EU541706 EU528094 M. ericiiJ. R. Grant Peru, E. Rodriquez 2926 (HUT) EU541707 EU528093 M. fortisianaJ. R. Grant Peru, D. McCarroll 128 (NY) EU541709 EU528095 M. gattacaJ. R. Grant Ecuador, J. R. Grant 4209 (NY) EU541710 DQ401414 M. gaudialisJ. R. Grant Colombia, R. E. Weaver 2650 (GH) EU541713 EU528097 M. glabra(L. f.) Gilg Colombia, J. R. Grant 4310 (NY) EU541714 EU528098 M. glazioviiGilg Brazil, B. Rezende Silva 1318 (NEU) EU541774 N/A M. gondoloidesJ. R. Grant Ecuador, G. Tipaz 1051 (MO) EU541716 N/A M. harlingiiJ. S. Pringle Ecuador, J. R. Grant 4049 (NY) EU541721 EU528104 M. innarrabilisJ. R. Grant Ecuador, F. Luisier 2 (LOJA) EU541723 EU528106 M. jactansJ. R. Grant Ecuador, J. Clark 8927 (NY) EU541725 EU528108 M. jensiiJ. R. Grant & Struwe Ecuador, J. R. Grant 4047 (NY) EU541724 EU528107 M. kuelapJ. R. Grant Peru, J. R. Grant 3942 (NY) EU541726 EU528109 M. lenaeJ. R. Grant Ecuador, J. R. Grant 4013 (NY) EU541727 EU528110 M. luna-gentianaJ. R. Grant & Struwe Ecuador, J. R. Grant 4028 (NY) EU541728 EU528111 M. luteyniiJ. R. Grant & Struwe Colombia, I. Cabrera & H. van der Werff
15769(U)
EU541730 N/A
M. macrophylla(Kunth) Gilg Colombia, J. R. Grant 4312 (NY) EU541735 EU528113 M. maguireiWeaver & J. R. Grant Peru, B. Maguire 61569 (NY) EU541736 EU528114 M. micranthaGilg Peru, J. R. Grant 3966 (NY) EU541737 EU528116 M. neblinaeMaguire & Steyerm. Venezuela, B. Maguire 36886 (NY) EU541739 N/A M. nicotianifoliaWeaver & J. R. Grant Colombia, A. S. Barclay 3402 (US) EU541740 EU528118 M. noctilucaJ. R. Grant & Struwe Ecuador, J. R. Grant 4003 (NY) EU541742 EU528121 M. normaeJ. R. Grant Peru, K. Garcı´a 267 (NEU) EU541743 EU528122 M. obtusifolia(Griseb.) Gilg Brazil, W. Thomas 14304 (NY) EU541775 EU528125 M. opulentaJ. R. Grant Ecuador, J. R. Grant 4347 (NY) EU541746 EU528124 M. ostentansJ. R. Grant Peru, B. Wallno¨fer 12968 (U) EU541747 EU528128 M. pachyphyllaGilg Colombia, M. L. Bristol 1429 (GH) EU541748 EU528129 M. pachystylaGilg Peru, J. Schunke-Vigo 5298 (NY) EU541751 EU528130 M. pajonalisJ. R. Grant Peru, M. Weigend 545 (NY) EU541749 N/A M. papillosaWeaver & J. R. Grant Venezuela, R. E. Weaver 2629 (GH) EU541750 EU528131 M. pinetorumAlain Cuba, Bisse 49708 (HAJB) EU541753 EU528133 M. pringleanaJ. R. Grant Ecuador, F. Luisier 1 (NY) EU541755 EU528134 M. revoluta(Ruiz & Pav.) Gilg Peru, M. Weigend 5288 (NY) EU541756 EU528135 M. robin-fosteriJ. R. Grant Peru, M. Weigend 5777 (B) EU541757 EU528136 M. rubraMalme Brazil, M. Reginato 755 (NEU) N/A EU528138 M. sodiroanaGilg Ecuador, J. R. Grant 4210 (NY) EU541758 EU528140 M. stenophyllaGilg Peru, J. R. Grant 3932 (NY) EU541762 EU528142 M. subcaudataEwan Costa Rica, R. L. Wilbur & Almeda 16828
(DUKE)
EU541763 EU528143
M. subsessilisWeaver & J. R. Grant Ecuador, J. R. Grant 4020 (NY) EU541765 EU528144 M. tahuantinsuyuanaJ. R. Grant Peru, F. Woytkowski 6672A (MO) EU541766 N/A
dently through a modified chi-square analysis that gives an impact index (i) that measures the magnitude in trends and differences between clades on a scale from 0 to 1 for each variable and each node. P values were calculated using Fisher’s exact test. Statistical significance was established at P , 0.05.
RESULTS
PHYLOGENETIC DATA AND ANALYSES
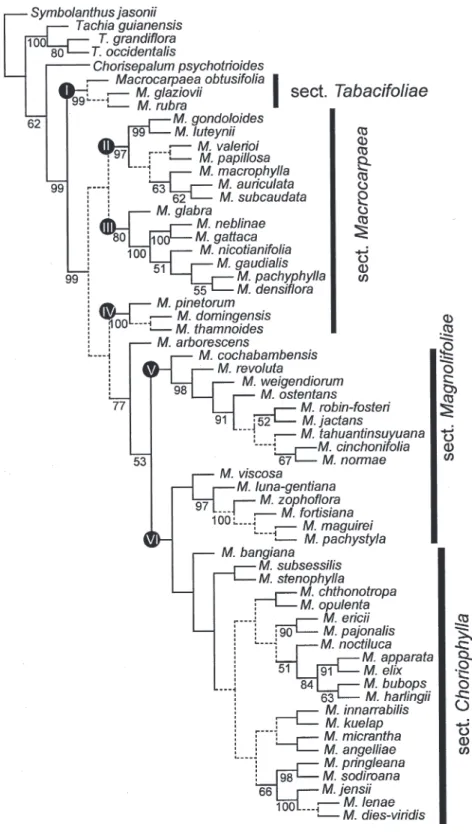
The lengths of the alignments were 687 nucleotides for ITS and 599 nucleotides for 5S-NTS. The combined molecular analysis yielded 160 most parsimonious trees (1252 steps, consistency index [CI] 5 0.65, retention index [RI] 5 0.74; Fig. 2). Five major clades are identified as monophyletic groups (Fig. 2, I–VI). Clade I represents three species with flattened seeds and pollen of the Glabra-type from southeastern Brazil (Macrocarpaea sect. Tabacifoliae sensu Grant, 2005; for distribution data, see Figs. 3, 4) and is sister to the rest of the genus. Next is a large dichotomy that is poorly supported between northern species with rimmed or perimetrically winged seeds and Glabra-type pollen (clades II and III) and southern species with winged or perimetrically winged seeds and Corymbosa- or Glabra-type pollen (clades V and VI). The Caribbean clade (clade IV) with rimmed seeds and Glabra-type pollen is weakly supported as sister to the clade with the more southern species. Clades II and III are each monophyletic, potentially sister groups, and include species primarily from the northern Andes, the tepuis, and Mesoamerica. Clades II, III, and IV correspond together to Macrocarpaea sect. Macrocarpaea sensu Grant (2005). The only sampled species of six from the tepuis, M. neblinae Maguire & Steyerm. is sister to M. gattaca J. R. Grant from the Andes in clade III, and all Mesoamerican species are placed in clade II. Within the southern
clade, M. arborescens Gilg is sister to all other species, which are divided into two clades: clades V and VI. Macrocarpaeasect. Magnolifoliae is paraphyletic in the sense of Grant (2005; including the viscosa clade of clade VI), and clade V. Clade VI corresponds to Macrocarpaeasect. Choriophylla.
BIOGEOGRAPHIC ANALYSIS
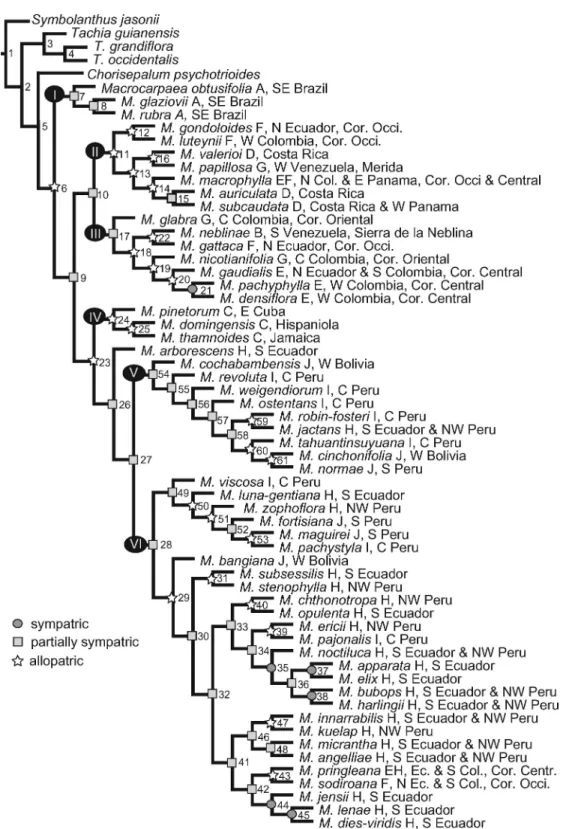
Nodes on the selected most parsimonious tree were classified into either allopatric (nonoverlapping), partially sympatric (slightly overlapping), or sympatric (overlapping) distributions based on the extant, detailed spatial distribution of each species. Past distributions for common ancestors to extant species most likely are at least somewhat different from the current species distribution, but because such histor-ical information is unavailable, no better estimate is possible from the current species distributions. In addition, the DIVA analysis provided hypotheses of dispersal and vicariance events that were taken into account when nodes were classified. The classification of nodes into sympatric versus allopatric species distributions resulted in six sympatric, 25 partially sympatric (5 partially allopatric), and 24 allopatric nodes (Fig. 3). When this is done for the 19 species pairs in the phylogenetic tree, there are four sympatric, three partially sympatric, and 12 allopatric species pairs, given this phylogeny and species sampling. Allopatry is more common than true sympatry with a ratio of 3:1 to 4:1, but this does not account for the partially sympatric/allopatric distributions.
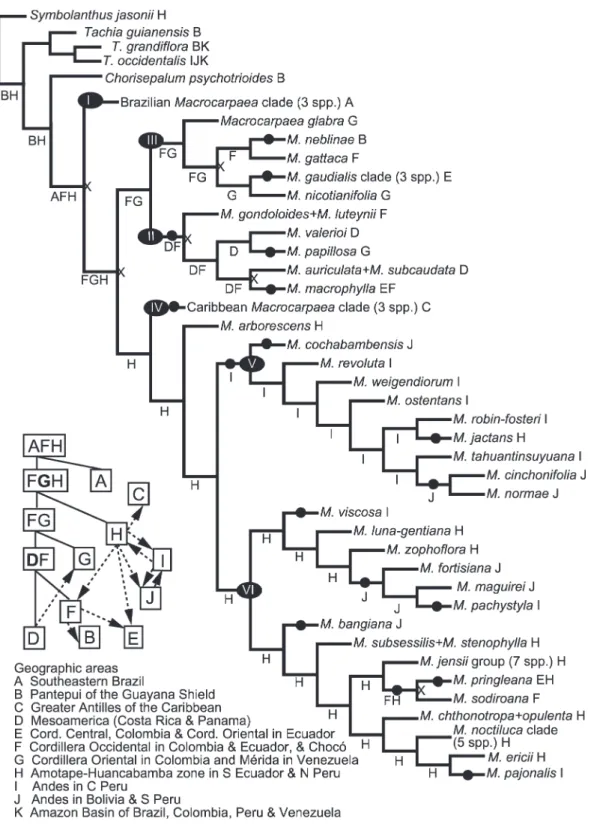
The DIVA analysis resulted in an exact solution during the optimization, and an optimal reconstruction for our data required a total of 29 dispersal events. Within Macrocarpaea, there are 17 dispersal events and six vicariance events. Ancestral area reconstruc-tions and invoked dispersal events are shown in Figure 4.
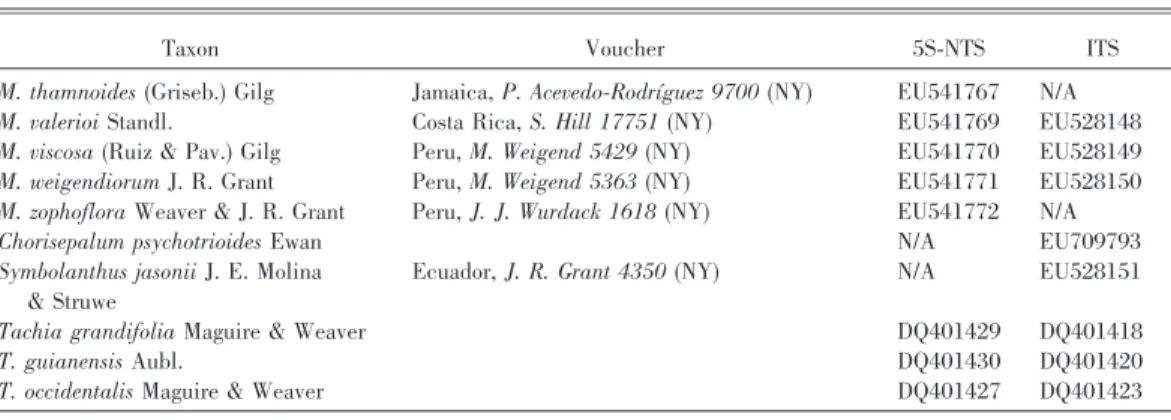
Taxon Voucher 5S-NTS ITS
M. thamnoides(Griseb.) Gilg Jamaica, P. Acevedo-Rodrı´guez 9700 (NY) EU541767 N/A M. valerioiStandl. Costa Rica, S. Hill 17751 (NY) EU541769 EU528148 M. viscosa(Ruiz & Pav.) Gilg Peru, M. Weigend 5429 (NY) EU541770 EU528149 M. weigendiorumJ. R. Grant Peru, M. Weigend 5363 (NY) EU541771 EU528150 M. zophofloraWeaver & J. R. Grant Peru, J. J. Wurdack 1618 (NY) EU541772 N/A Chorisepalum psychotrioidesEwan N/A EU709793 Symbolanthus jasoniiJ. E. Molina
& Struwe
Ecuador, J. R. Grant 4350 (NY) N/A EU528151
Tachia grandifoliaMaguire & Weaver DQ401429 DQ401418 T. guianensisAubl. DQ401430 DQ401420 T. occidentalisMaguire & Weaver DQ401427 DQ401423
The selected optimization (Fig. 4) shows an ances-tral area for Macrocarpaea in southeastern Brazil (A), Cordillera Occidental in Colombia and Ecuador (F), and the Amotape–Huancabamba Zone in northern Peru and Ecuador (H). The first vicariance event lies between the Brazilian species (clade I) and Andean– Caribbean–Mesoamerican species. The major division within the Andean species into two subclades is a north-south vicariant event as well. The Caribbean species (clade IV; C) are supported as likely derived from Andean species (H). Dispersal patterns among Andean areas invoked from the DIVA analysis are outlined in Figure 1. Patterns within the northern clades (clades II and III; E, F, and G) are complicated and also involve one dispersal to and one from Mesoamerica (D), and one to the Guayana Shield (B). Vicariance and dispersal between the northern Ecuadorian and Colombian cordilleras are detected but represent only two dispersals: one from Cordillera Occidental (F) to Cordillera Central (E) and one from Cordillera Oriental (G) to Cordillera Central (E).
The Amotape–Huancabamba Zone (H) is support-ed as the ancestral area for the southern clade. Clade V dispersed early southward from H to central Peru (I) and later to southern Peru and Bolivia (J) twice, with one back-dispersal northward to H. A similar pattern is found in clade VI, which is largely restricted to the Amotape–Huancabamba Zone (H) and shows four dispersals southward (two both to I and J) and one back-dispersal from J to I. Northward dispersals to northern Ecuador and Colombia (E and F) from the southern clade are only found in two cases.
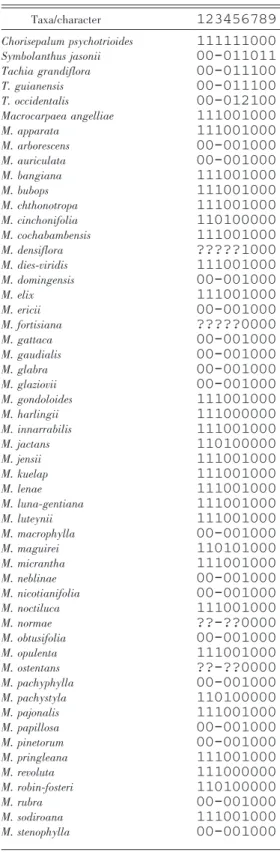
Table 2. Morphological data matrix of 57 Macrocarpaea species and five outgroups from Chorisepalum, Symbolan-thus, and Tachia.*
Taxa/character 123456789 Chorisepalum psychotrioides 111111000 Symbolanthus jasonii 00-011011 Tachia grandiflora 00-011100 T. guianensis 00-011100 T. occidentalis 00-012100 Macrocarpaea angelliae 111001000 M. apparata 111001000 M. arborescens 00-001000 M. auriculata 00-001000 M. bangiana 111001000 M. bubops 111001000 M. chthonotropa 111001000 M. cinchonifolia 110100000 M. cochabambensis 111001000 M. densiflora ?????1000 M. dies-viridis 111001000 M. domingensis 00-001000 M. elix 111001000 M. ericii 00-001000 M. fortisiana ?????0000 M. gattaca 00-001000 M. gaudialis 00-001000 M. glabra 00-001000 M. glaziovii 00-001000 M. gondoloides 111001000 M. harlingii 111000000 M. innarrabilis 111001000 M. jactans 110100000 M. jensii 111001000 M. kuelap 111001000 M. lenae 111001000 M. luna-gentiana 111001000 M. luteynii 111001000 M. macrophylla 00-001000 M. maguirei 110101000 M. micrantha 111001000 M. neblinae 00-001000 M. nicotianifolia 00-001000 M. noctiluca 111001000 M. normae ??-??0000 M. obtusifolia 00-001000 M. opulenta 111001000 M. ostentans ??-??0000 M. pachyphylla 00-001000 M. pachystyla 110100000 M. pajonalis 111001000 M. papillosa 00-001000 M. pinetorum 00-001000 M. pringleana 111001000 M. revoluta 111000000 M. robin-fosteri 110100000 M. rubra 00-001000 M. sodiroana 111001000 M. stenophylla 00-001000 Taxa/character 123456789 M. subcaudata 111001000 M. subsessilis 00-001000 M. tahuantinsuyuana 110100000 M. thamnoides 00-001000 M. valerioi 00-001000 M. viscosa 111001000 M. weigendiorum 110100000 M. zophoflora ?????1000 * Question marks indicate missing data, and hyphens indicate inapplicable characters. Characters and character states are: 1. Seed shape (3-dimensional): angular or spheroid (0), flattened (1). 2. Seed wings: absent (0), present (1). 3. Seed wings: 2-sided (0), perimetrical (1). 4. Seed shape (outline): square (0), long-linear (1). 5. Seed weight: , 0.1 mg/seed (0), . 0.1 mg/seed (1). 6. Pollen exine: verrucose (0), reticulate (1), smooth (2). 7. Flower position: terminal (0), axillary (1). 8. Corolla color: green, white, or yellow (0), red or purple (1). 9. Pollen aggregation: monads (0), tetrads or polyads (1).
Figure 1. Map of northwestern South America and southern Mesoamerica with the areas used for biogeographic analysis identified by letters and solid lines indicating Macrocarpaea species distributions. Arrows with numbers indicate the number of dispersal events as hypothesized from the DIVA analysis (see Fig. 4). Biogeographic areas are: A, southeastern Brazil; B, Pantepui of the Guayana Shield; C, Greater Antilles of the Caribbean; D, Mesoamerica; E, Cordillera Central in Colombia and Cordillera Oriental in Ecuador; F, Choco´ and Cordillera Occidental in Colombia and Ecuador; G, Cordillera Oriental and Me´rida in Colombia and Venezuela; H, Amotape–Huancabamba region in Ecuador and Peru; I, Cordillera Central in central Peru; J, Bolivia and Cordillera Central in southern Peru; K, Amazon Basin in Brazil, Colombia, Peru, and Venezuela. Areas A, C, and K are not indicated on the map.
SEEVA ANALYSIS
Nine environmental variables were analyzed for 56 nodes within Macrocarpaea (nodes 6 to 61 vs. the outgroup nodes 1 to 5; Fig. 3; see Table 4 for impact index and P values). Allopatric nodes had an average
total impact index (i) of 0.39 (all variables and all nodes), whereas partly sympatric nodes had an average impact index of 0.26, and sympatric nodes 0.41. The differences in impact numbers indicate some differences between the groups, but there are only slightly larger environmental differences between sister clades of sympatric nodes than between sister clades of allopatric nodes. When terminal species pairs are analyzed, the results are more pronounced. The average impact index for allopatric species pairs was 0.49 (all variables and all nodes), for partly sympatric 0.40, and for sympatric 0.41. This finding indicates that allopatric species pairs may have ecological niches more divergent from each other than both sympatric and partly allopatric species. Allopatric terminal species pairs are the more ecologically different than when allopatric nodes are compared.
Four Andean terminal sympatric species pairs were analyzed: Macrocarpaea densiflora (Benth.) Ewan versus M. pachyphylla Gilg in Cordillera Central of Colombia (Fig. 3, node 21), M. apparata J. R. Grant & Struwe versus M. elix J. R. Grant in southern Ecuador (node 37), M. bubops J. R. Grant & Struwe versus M. harlingiiJ. S. Pringle in southern Ecuador (node 38), and M. dies-viridis J. R. Grant versus M. lenae J. R. Grant in southern Ecuador (node 45). For node 21, only temperature seasonality showed significant differences between the two sister species (i 5 0.54; P , 0.0001). Nodes 37 and 38 represent two sympatric species pairs that, in turn, are partially sympatric sister groups to each other, but the two species pairs show significant differences in what variables are different between species. Node 37 showed significant differences in all variables except precipitation seasonality, with the largest differences in soil type (i 5 1.0; P , 0.001). In contrast, node 38 only shows significant differences in three variables: elevation (i 5 0.34; P 5 0.0037), mean annual temperature (i 5 0.29; P 5 0.0028), and minimum temperature of the coldest month (i 5 0.25; P 5 0.0047). Node 45 has five significant variables: bedrock geological age (i 5 0.50; P , 0.001), temperature seasonality (i 5 0.51; P , 0.001), annual precipitation (i 5 0.58; P 5 0.0083), precipitation of the driest month (i 5 0.51; P , 0.0001), and precipitation seasonality (i 5 0.51; P , 0.001). A similar lack of a general pattern is seen when allopatric or partially sympatric species pairs are analyzed (Table 4).
The environmental differences between the more strongly supported nodes are presented here (cf. Fig. 2). Clades II and III are in the northern Andes, tepuis, and Mesoamerica, and joined by node 10 (Fig. 3). SEEVA analysis of the two clades (Table 4)
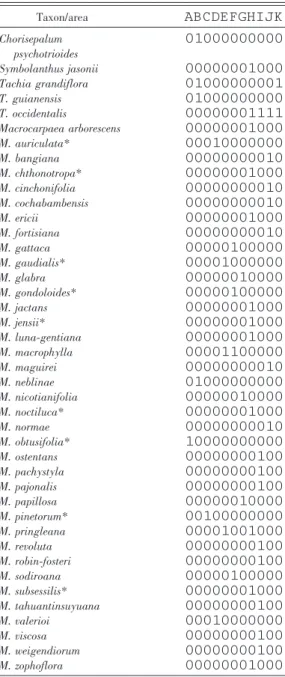
Table 3. Distribution data matrix used for the DIVA analysis, with 0 indicating absent and 1 present for each specific area. See further information in Materials and Methods and Figure 4 for area definitions. Taxon names marked with * represent a larger clade; see text for further explanation. Taxon/area ABCDEFGHIJK Chorisepalum psychotrioides 01000000000 Symbolanthus jasonii 00000001000 Tachia grandiflora 01000000001 T. guianensis 01000000000 T. occidentalis 00000001111 Macrocarpaea arborescens 00000001000 M. auriculata* 00010000000 M. bangiana 00000000010 M. chthonotropa* 00000001000 M. cinchonifolia 00000000010 M. cochabambensis 00000000010 M. ericii 00000001000 M. fortisiana 00000000010 M. gattaca 00000100000 M. gaudialis* 00001000000 M. glabra 00000010000 M. gondoloides* 00000100000 M. jactans 00000001000 M. jensii* 00000001000 M. luna-gentiana 00000001000 M. macrophylla 00001100000 M. maguirei 00000000010 M. neblinae 01000000000 M. nicotianifolia 00000010000 M. noctiluca* 00000001000 M. normae 00000000010 M. obtusifolia* 10000000000 M. ostentans 00000000100 M. pachystyla 00000000100 M. pajonalis 00000000100 M. papillosa 00000010000 M. pinetorum* 00100000000 M. pringleana 00001001000 M. revoluta 00000000100 M. robin-fosteri 00000000100 M. sodiroana 00000100000 M. subsessilis* 00000001000 M. tahuantinsuyuana 00000000100 M. valerioi 00010000000 M. viscosa 00000000100 M. weigendiorum 00000000100 M. zophoflora 00000001000
Figure 2. One of 160 most parsimonious trees from the phylogenetic analysis based on combined molecular (ITS and 5S-NTS) and morphological data. Outgroups are Chorisepalum, Symbolanthus, and Tachia. This tree was used in the SEEVA and DIVA analyses. Dotted branches collapse in the strict consensus tree, and numbers below branches indicate bootstrap support above 50%. Current infrageneric classification for Macrocarpaea is indicated on the right. Clades marked I–VI correspond to nodes discussed in the text. The northern clade includes clades II + III, and the southern clade includes M. arborescens plus clades V + VI.
reveals that all variables show significant differences. Impact indices above 0.40 are found for four variables: elevation, soil type, annual mean temper-ature, and minimum temperature of coldest month.
Node 27 (Fig. 3) divides clades V and VI from each other and represents a division between a northern (primarily area H, clade V) and southern clade (areas I + J, clade VI). Seven of nine variables show differences in ecological trends between these two clades (Table 4), and the largest impact indices (5 differences) are found for temperature seasonality (i 5 0.37) and precipitation seasonality (i 5 0.32). Node 42 separates a clade of three southern Ecuadorian species from a clade that dispersed from this area (H) into northern Ecuador and southern Colombia (E, F, and H; Macrocarpaea pringleana J. R. Grant and M. sodiroanaGilg). This major difference in distribution is associated with significant environmental differ-ences in six of the nine variables (67%): soil type, annual mean temperature, temperature seasonality, annual precipitation, precipitation of the driest month, and precipitation seasonality. The largest differences are found in annual precipitation (i 5 0.35) and temperature seasonality (i 5 0.37).
DISCUSSION
CONTINENTAL SCALE PATTERNS
Similar biogeographic patterns can often be detected in taxa of a similar age and geographic origin. For South America, there are many different groups of this kind, from the Gondwanic relicts with connections to Africa, Antarctica, and Asia more than 100 million years ago (Ma) to recent arrivals from the northern temperate zone along the Rocky Mountains of North America and the Andes when the Isthmus of Panama closed only a few million years ago. Other groups have evolved in situ on the South American continent and spread to North America, the Caribbean islands, and even farther away to New Zealand, Australia, and Africa. South America was, in effect, an isolated continent for more than 90 million years (from ca. 95 Ma, mid-Cretaceous Cenomanian, to ca. 4 Ma, Miocene; Burnham & Graham, 1999). During this time, many organismal lineages were dispersing to the South American continent, evolved in situ, and dispersed within it.
We do not know the exact age of Macrocarpaea or its tribe Helieae due to the lack of fossils and secure phylogenetic dating. Given the position of the tribe in the family phylogeny and an estimated age of 42– 50 Ma for the whole Gentianaceae (Yuan et al., 2003), we can assume that the Helieae, and maybe the genus Macrocarpaeaas well, has been in South America for
at least 30 million years. Macrocarpaea is part of one of the more basal divergences in the tribe (the Macrocarpaea subclade), with only the southeast Brazilian genera Prepusa Mart. and Senaea Taub. positioned below it in the phylogeny (Struwe et al., 2009). This minimum age estimate (30 Ma) needs to be tested both in a larger molecular dating analysis of the whole Gentianaceae family and in a detailed analysis of Helieae, when fossils or other additional evidence become available.
The large-scale biogeographic patterns found in Macrocarpaeafit a scenario that is partly consistent with the geological history of South America. The DIVA analysis maps the disjunct areas (A, F, and H; Fig. 4) at the base of Macrocarpaea, supporting a disjunct ancestral area for the genus including the mountains of southeastern Brazil and northern Peru, Ecuador, and Colombia. It is too early to tell whether this disjunct area distribution is due to an ancient dispersal, or extinction in the in-between areas. The sister genus (Tachia) occurs in the connecting Amazon Basin area and is absent from southeastern Brazil, and therefore provides some support for a broad distribution of a common ancestor of Tachia and Macrocarpaea. An ancient dispersal event from an ancestor restricted to southeastern Brazil to the Andes is not strongly supported, because our DIVA result strongly supports the inclusion of the northern Andean areas in the ancestral area for Macrocarpaea. The supported scenario does not include the Bolivian Andes as a dispersal corridor northward from Brazil.
The first divergence in Macrocarpaea is between the three species in the coastal Atlantic forest of southeastern Brazil, an area known for its high biodiversity (Myers et al., 2000), and all other species in the genus (Andes, tepuis, Mesoamerica, and the Greater Antilles). Southeastern Brazil is part of the ancient Gondwanic crust in South America, together with the Guayana Shield, and these areas represent relatively long-term geological stability, with the lack of historical sea incursions (Clapperton, 1993). Southeastern Brazil has repeatedly been shown to include relictual, ancestrally placed lineages of gentians, not only in Macrocarpaea and Helieae, but also in Saccifolieae and Chironieae subtribe Coutou-beinae (Struwe et al., 2002). This southeastern Brazil– Andean pattern, with the Brazilian area being more ancestral, has also been found in other groups that show a large divergence in Neotropical forests (e.g., FuchsiaL. [Berry et al., 2004] and Gesneriaceae tribe Sinningieae [Perret et al., 2003, 2007]).
Several hypotheses have been proposed for the derivation of the tepui flora on the Guayana Shield, representing long-distance dispersal from the Andes, derivation from lowland white-sand areas (Kubitzki,
1989), and in situ relictual lineages (Maguire, 1970). Support for several of these hypotheses is found within the Helieae and related tribes, with some genera (e.g., Potalia Aubl.) supporting the lowland to highland theory (Struwe et al., 2002; Frasier et al., 2008).
The derivation of Mesoamerican species (Macro-carpaea auriculata Weaver & J. R. Grant, M. subcaudataEwan, and M. valerioi Standl.) from two lineages in the Colombian Andes is a common pattern in many plant groups and is likely due to dispersal northward along the Isthmus of Panama after its closing 3.1 Ma (Burnham & Graham, 1999). During the American interchange, many organismal groups moved either north or south, and other gentians that show a southern derivation include Potalia (Frasier et al., 2008) and Tachia (Struwe, unpublished data). According to preliminary data from DIVA-GIS analysis of available ecological niches (Struwe, pers. comm.), there are suitable habitats for Macrocarpaea north of Costa Rica, but these have not evidently been inhabited yet.
Three species of Macrocarpaea occur on the islands of the Greater Antilles: M. domingensis Urb. & Ekman (Hispaniola), M. pinetorum Alain (Cuba), and M. thamnoides(Griseb.) Gilg (Jamaica), and are included in this study. Their biogeographic relationships are still uncertain because their position as being derived from an Andean ancestor has poor branch support in the phylogenetic tree, but they are strongly supported as being closer to Andean lineages than to the Brazilian lineage or Central American species. Long-distance dispersal from the northern Andes to the Caribbean is the most likely scenario. Based on the location of the Caribbean clade in the phylogenetic result, this did not happen relatively recently. The ancestor of the Macrocarpaea species that occurs in the Greater Antilles did not have wind-dispersed seeds, so it was most likely dispersed inadvertently by birds. Similar long-distance dispersal patterns be-tween the Andes and Hispaniola have been found earlier in Fuchsia (Berry, 1982, 2004). The Caribbean area is a complex region of several different origins, and its general biogeography and geological history are under debate and still not fully understood (Iturralde-Vinent & MacPhee, 1999). Cuba and Hispaniola are older than Jamaica, and they were connected during the early Oligocene (Iturralde-Vinent & MacPhee, 1999), but this was most likely long before the arrival of Macrocarpaea on these islands.
ANDEAN PATTERNS
The Andean uplift started in the Miocene (ca. 20 Ma) and continued until the Holocene, generally
moving from the southern part of the mountain range toward the northern part, with the main northern upheaval ca. 2–8 Ma (Haffer, 1987). Other scientists support an earlier start at 40 Ma, with major northern uplift at 18 Ma, as suggested by Ghosh et al. (2006) and Gregory-Wodzicki (2000). The Andean forests of the northern Andes where Macrocarpaea occurs have been hypothesized to be of Miocene to lower Pliocene in age (van der Hammen, 1979), but their range in elevation shifted downward during the Pleistocene glaciations (Haffer, 1987). The Andean clade of Macrocarpaeais clearly separated into two subclades, a northern and southern one, divided at the Amotape– Huancabamba Zone. The geographic division of these two groups follows the Amotape Cross, a geological shear zone, which divides the Andes (and Ecuador) into two parts: the younger northern Andes (formed in Late Pliocene to Pleistocene) and older central Andes (Miocene to Pliocene; Young & Reynel, 1997).
Based on our DIVA analysis, the ancestral distribution within the Andes includes the Amo-tape–Huancabamba Zone (H), which is among the most species-rich areas in the Andes. Also included in the ancestral Andean area are the Cordillera Occi-dental of Colombia and Ecuador (F) and the Cordillera Oriental of Colombia and Cordillera de Me´rida in Venezuela (G). The deep split between the northern and southern clades of Macrocarpaea represents an ancient divergence that strongly correlates with current distribution patterns. The fact that only two dispersal events have crossed over from the south to the north, and none from the north to the south, is remarkable. This zone in central and northern Ecuador is also known for its absence of Tachia and Symbolanthus, two other Helieae genera that have suitable habitats in the boundary area. Possible explanations for this deep divide might be the early division of the Andes in this region between a northern and southern part, since they have been divided by sea incursions (early Miocene), mountain uplift and creation of valleys, and/or volcanism (Clapperton, 1993; Burnham & Graham, 1999), or perhaps a westward flow of the Amazon into the Pacific Ocean (Mapes et al., 2006).
Quaternary volcanism is absent from the Amotape– Huancabamba Zone (area H) and the central Peruvian area (H and I), but occurs in areas both north and south of these regions (Clapperton, 1993). Volcanism could affect extinction rates severely, and the lack of volcanism might partly explain the relatively higher species numbers in the Amotape–Huancabamba Zone. In addition, this area is characterized by humid isolated forest islands occurring in a highly dissected landscape (Jørgensen, pers. comm.). The species of the southern clade also have wind-dispersed, winged
Table 4. Results from SEE VA analysis of Neot ropical Ma crocarpaea data showi ng impact inde x (i ) and P values for each node in the phylo geny. Node number s and tree topol ogy corresp ond to Fi gure 3. Nine varia bles were an alyzed. Colu mn SP m arks termina l species pairs with a Y for presence . Colu mn D classi fies all nodes into all opatric (A), partia lly sympat ric (PS), or sy mpatric (S), followi ng results in Fi gure 3. Pl ease se e text for furt her explan ati ons. Impac t ind ex in bold face number s indicat es i . 0.5, an d statisti cally signif icant differe nces are indicat ed by P values (P , 0.05 ) in bold face. For em pty cells, there wa s no differen ce in env ironment al categories betw een spec ies so the analysis cou ld no t be run. Node SP D Elevation Soil type Geol ogy (age) Annual mean temper ature Tempe rature se asonalit y Minim um temperat ure of colde st m onth An nual prec ipitation Precip itation of driest month Precipit ation seasonal ity iP i P iP i P iP iP iPiP i P 6 – A 0.30 0.00 00 0.18 0.0000 0.25 0.0000 0.18 0.00 00 0.38 0.00 00 0.12 0.00 00 0.27 0.00 00 0.17 0.00 00 0.08 0.00 13 7 – PS 0.23 0.04 17 0.57 0.0000 0.20 0.0145 0.19 0.00 62 – – 0.29 0.00 00 0.20 0.01 38 0.37 0.00 00 0.28 0.00 00 8 Y PS 0.19 0.16 94 – – 0.41 0.0000 0.25 0.00 51 – – 0.23 0.00 15 0.37 0.00 00 0.32 0.00 00 0.37 0.00 00 9 – PS 0.11 0.00 00 0.32 0.0000 0.19 0.0000 0.15 0.00 00 0.19 0.00 00 0.09 0.00 05 0.19 0.00 00 0.04 0.40 49 0.17 0.00 00 10 – PS 0.43 0.00 00 0.44 0.0000 0.23 0.0000 0.43 0.00 00 0.36 0.00 00 0.45 0.00 00 0.37 0.00 00 0.26 0.00 00 0.25 0.00 00 11 – A 0.06 0.90 99 0.09 0.5672 0.42 0.0038 0.15 0.09 44 0.33 0.00 00 0.11 0.3123 0.16 0.03 66 0.09 0.46 50 0.25 0.00 02 12 Y A 0.37 0.00 00 0.52 0.0000 – – 0.45 0.24 24 – – 0.45 0.2424 0. 60 0.00 22 0.71 0.00 00 0.71 0.00 00 13 – A 0.23 0.00 03 0.18 0.0137 0.04 1.00 00 0.22 0.00 08 0.44 0.00 00 0.23 0.00 03 0.19 0.00 32 0.14 0.09 69 0.33 0.00 00 14 – A 0.27 0.00 78 0.27 0.0090 – – 0.22 0.05 06 0.46 0.00 00 0.20 0.0966 0.29 0.00 84 0.11 0.51 71 0.38 0.00 00 15 Y PS 0.42 0.05 49 0.78 0.0000 – – 0.36 0.17 65 0.35 0.09 16 0.36 0.1765 0.18 1.00 00 0.42 0.00 67 0.38 0.05 95 16 Y A 0.16 0.29 33 0.71 0.0000 – – 0.15 0.25 54 0.36 0.00 00 0.18 0.1842 0. 54 0.00 00 0.33 0.00 00 0.21 0.08 36 17 – PS 0.05 0.69 85 0.31 0.0000 0.29 0.0000 0.35 0.00 00 0.19 0.00 90 0.22 0.00 01 0.45 0.00 00 0.47 0.00 00 0.47 0.00 00 18 – A 0.37 0.00 05 0.25 0.0555 0.53 0.0000 0.49 0.00 00 0.35 0.00 33 0.33 0.00 02 0.45 0.00 00 0.24 0.03 09 0.30 0.00 15 19 – A 0.28 0.11 73 0.32 0.0762 0.35 0.0385 0.48 0.00 46 0.03 1.00 00 0.41 0.00 07 0.44 0.00 03 0.45 0.00 02 0.47 0.00 08 20 – A 0.33 0.16 33 0.47 0.0115 0.56 0.0152 0.33 0.16 33 0.54 0.00 24 0.28 0.1950 0.22 0.49 87 0.25 0.31 09 0.12 1.00 00 21 Y S 0.40 0.25 36 0.10 1.0000 0.37 0.25 00 0.40 0.25 36 0.54 0.00 00 0.41 0.1946 0.23 1.00 00 0.26 0.38 39 0.40 0.09 64 22 Y A 0.49 0.10 53 1.00 0.0000 1.00 0.0000 0.08 1.00 00 0.15 1.00 00 0.12 1.0000 0. 71 0.00 00 1.00 0.00 00 1.00 0.00 00 23 – A 0.22 0.00 00 0.12 0.0004 – – 0.20 0.00 00 0.30 0.00 00 0.16 0.00 00 0.14 0.00 00 0.12 0.00 01 0.12 0.00 00 24 – A 0.44 0.02 37 – – – – 0.31 0.03 60 – – 0.34 0.04 11 0.41 0.00 34 0.36 0.01 57 0.29 0.09 60 25 Y A 0.06 1.00 00 – – – – 0.34 0.20 01 – – 0.38 0.1370 0.54 0.00 10 0.51 0.00 34 0.34 0.06 51 26 – PS 0.20 0.00 00 0.21 0.0000 0.04 0.72 96 0.23 0.00 00 0.13 0.00 00 0.13 0.00 00 0.20 0.00 00 0.14 0.00 00 0.15 0.00 00 27 – PS 0.09 0.02 77 0.14 0.0000 0.06 0.34 41 0.05 0.40 24 0.37 0.00 00 0.16 0.00 00 0.10 0.00 48 0.29 0.00 00 0.32 0.00 00 28 – PS 0.19 0.00 00 0.10 0.0193 0.10 0.0369 0.16 0.00 01 0.17 0.00 02 0.22 0.00 00 0.14 0.00 05 0.13 0.00 04 0.16 0.00 00 29 – A 0.02 1.00 00 0.05 0.5973 0.10 0.0199 0.05 0.51 02 0.36 0.00 00 0.10 0.00 23 0.07 0.27 62 0.19 0.00 00 0.19 0.00 00 30 – PS 0.23 0.00 00 0.27 0.0000 0.16 0.0001 0.18 0.00 00 0.21 0.00 00 0.22 0.00 00 0.18 0.00 00 0.26 0.00 00 0.24 0.00 00 31 Y A 0.31 0.28 05 0.71 0.0000 1.00 0.0000 0.50 0.03 35 1.00 0.00 00 0.52 0.00 03 0. 52 0.00 00 0.13 0.48 85 0.52 0.00 00 32 – PS 0.15 0.00 04 0.18 0.0000 0.18 0.0000 0.21 0.00 00 0.12 0.00 43 0.22 0.00 00 0.25 0.00 00 0.19 0.00 00 0.16 0.00 01 33 – PS 0.16 0.00 19 0.10 0.2350 0.15 0.0276 0.12 0.07 14 0.18 0.00 60 0.09 0.2485 0.18 0.00 75 0.09 0.06 81 0.14 0.05 03 34 – PS 0.07 0.61 29 0.14 0.0450 0.21 0.0001 0.05 0.82 75 0.33 0.00 00 0.20 0.00 09 0.13 0.07 15 0.31 0.00 00 0.32 0.00 00
Node SP D Elevat ion Soil type Geolo gy (age) Annual me an temperat ure Temperat ure seasonal ity Mini mum temperat ure of coldest month Annual pre cipitation Precip itatio n of driest mo nth Precip itation seasona lity iP i P iP i P iPiP iPi P i P 35 – S 0.40 0.0000 0.34 0.00 00 0.21 0.00 09 0.32 0.00 00 0.33 0. 0000 0.32 0.00 00 0.32 0.0000 0.33 0.00 00 0.43 0.00 00 36 – PS 0.25 0.0180 0.39 0.00 00 0.32 0.00 02 0.43 0.00 00 0. 50 0. 0000 0.46 0.00 00 0.25 0.0191 0.54 0.00 00 0.41 0.00 00 37 Y S 0.58 0.0000 1.00 0.00 00 0.66 0.00 00 0.71 0.00 00 0. 71 0. 0000 0.71 0.00 00 0.53 0.0000 0.58 0.02 78 0.48 0.05 56 38 Y S 0.34 0.0037 0.10 1.00 00 0.19 0.2095 0.29 0.00 28 0.16 0.30 57 0.25 0.04 47 0.16 0.2331 0.27 0.08 45 0.05 1.00 00 39 Y A 0.23 0.3982 0.89 0.00 00 0.77 0.00 00 0.16 0.80 63 0.46 0. 0045 0.36 0.00 86 0.31 0.1003 0.63 0.00 00 0.58 0.00 00 40 Y A 0.71 0.0000 0.50 0.46 67 – – 0.71 0.00 00 –– 0.71 0.00 00 0.71 0.0000 0.71 0.00 00 1.00 0.00 00 41 – PS 0.18 0.0038 0.32 0.00 00 0.15 0.02 99 0.28 0.00 00 0.32 0. 0000 0.21 0.00 04 0.29 0.0000 0.18 0.00 43 0.24 0.00 00 42 – PS 0.18 0.0643 0.33 0.00 00 0.15 0.2160 0.22 0.00 66 0.37 0. 0000 0.07 0.79 10 0.35 0.0002 0.26 0.00 10 0.25 0.00 18 43 Y A 0.24 0.0351 0.36 0.00 09 0.21 0.0757 0.13 0.46 44 0. 57 0. 0000 0.17 0.20 79 0.43 0.0000 0.40 0.00 00 0.51 0.00 00 44 Y S 0.56 0.0020 0.18 0.77 71 0.67 0.01 52 0.58 0.00 01 0. 69 0. 0055 0.52 0.00 54 0.50 0.0104 0.69 0.00 55 0.23 0.00 00 45 Y S 0.38 0.3000 0.22 1.00 00 0.50 0.00 00 0.42 0.18 33 0. 51 0. 0000 0.22 1.00 00 0.58 0.0083 0.51 0.00 00 0.51 0.00 00 46 – PS 0.28 0.0018 0.12 0.42 83 0.33 0.00 08 0.35 0.00 00 0.12 0.50 47 0.40 0.00 00 0.37 0.0000 0.40 0.00 00 0.44 0.00 00 47 Y A 0.47 0.0007 0.50 0.00 22 –– 0.58 0.00 00 0.15 0.63 96 0.71 0.00 00 0.58 0.0000 0.71 0.00 00 0.59 0.00 00 48 Y PS 0.45 0.0001 0.39 0.00 58 0.62 0.00 00 0.46 0.00 00 0.46 0. 0000 0.44 0.00 00 0.37 0.0024 0.50 0.00 03 0.70 0.00 00 49 – PS 0.11 1.0000 0.33 0.07 54 – – 0.11 1.00 00 0.33 0. 0410 0.23 0.40 01 0.15 0.8458 0.35 0.02 96 0.32 0.04 29 50 – A 0.45 0.0000 0.64 0.00 00 1.00 0.00 00 0.46 0.00 11 0. 52 0. 0002 0.31 0.16 41 0.32 0.1183 0.47 0.00 06 0.47 0.00 15 51 – A 0.28 0.0000 0.19 1.00 00 – – 0.58 0.00 00 0.47 0.11 11 0.18 1.00 00 0.38 0.1111 0.47 0.00 00 0.47 0.11 11 52 – PS 0.53 0.0357 1.00 0.00 00 – – 0.32 1.00 00 0.24 1.00 00 0.32 1.00 00 0.43 0.0357 0.32 1.00 00 0.24 1.00 00 53 Y A 0.71 0.0000 –– – – 0.71 0.00 00 0. 71 0. 0000 0.71 0.00 00 0.58 0.0000 0.71 0.00 00 0.71 0.00 00 54 – PS 0.19 0.0951 0.14 0.42 83 0.29 0.00 51 0.14 0.38 62 0.16 0.25 28 0.16 0.29 55 0.19 0.1252 0.13 0.86 94 0.14 0.44 30 55 – PS 0.14 0.6036 0.25 0.16 83 0.14 0.6701 0.20 0.04 57 0.26 0. 0263 0.15 0.35 65 0.14 0.5626 0.10 0.51 29 0.10 0.64 55 56 – PS 0.19 0.0000 0.11 1.00 00 0.40 0.00 00 0.20 0.07 32 0. 58 0. 0000 0.22 0.00 00 0.28 0.0000 0.32 0.00 00 0.27 0.02 44 57 – PS 0.16 0.2065 – – 0.15 0.6507 0.15 0.50 62 0.44 0. 0038 0.24 0.01 48 0.31 0.0113 0.49 0.00 00 0.53 0.00 00 58 – PS 0.21 0.2203 0.48 0.00 58 0.40 0.00 02 0.14 0.73 73 0.32 0. 0140 0.05 1.00 00 0.29 0.0259 0.24 0.02 66 0.29 0.00 00 59 Y A 0.15 1.0000 – – 0.09 1.0000 0.26 0.15 38 0.48 0. 0000 0.39 0.07 69 0.37 0.0000 0.39 0.15 38 0.71 0.00 00 60 – A 0.24 0.3271 0.50 0.03 96 0.36 0.00 58 0.13 1.00 00 0.41 0. 0000 0.19 0.67 64 0.25 0.3027 0.11 1.00 00 – – 61 Y A 0.33 0.1292 0.54 0.04 41 0.59 0.00 00 0.37 0.06 91 – – 0.33 0.12 92 0.29 0.2862 0.14 1.00 00 – – Table 4. Cont inued.
Figure 3. The selected most parsimonious tree used in DIVA and SEEVA analyses, with numbered nodes and geographic distribution listed for each species. Biogeographic area coding for DIVA is indicated with letters A–K after species names (see text for definition of areas). Symbols (#, %, q) on nodes indicate sympatric, partially sympatric, or allopatric clades, based on exact species distribution within Macrocarpaea (not DIVA area classification), which is further analyzed in the SEEVA analysis.
Figure 4. Results of the DIVA analysis when mapped onto the selected most parsimonious phylogenetic tree. Areas optimized onto each branch are marked with letters (see legend and Fig. 3 for coding); when several optimizations were equally optimal, one was selected based on spatial and geological information (see Appendix 1 for all optimal DIVA reconstructions). Circles (
N
) on branches indicate dispersal events leading to speciation or enlargement of geographic distribution for a species, and 3 by a node indicates a vicariance event leading to speciation. The schematic diagram to the left shows an overview of area relationships, with bold letters (D, G) indicating expansion to new areas, solid lines indicating vicariance events, and arrows indicating dispersal events. Vicariances and dispersals are only marked for Macrocarpaea.seeds that presumably could lead to increased colonization of new areas and thereby increased allopatric speciation through island hopping. Howev-er, more instances of allopatric speciation are found in the northern clade than in the southern clade. Weigend (2002, 2004) showed that the Huancabamba depression is not a dispersal barrier to Andean species of middle elevations, and this conclusion is upheld by our data. This finding is in contrast to data from Eleutherodactylus Dume´ril & Bibron frogs (Young & Reynel, 1997; Duellman & Pramuk, 1999); however, it should be noted that this vertebrate group represents an immense Neotropical radiation with a very different speciation history.
SPECIATION PATTERNS
Within Andean Macrocarpaea, allopatric speciation is much more common than sympatric speciation, and this has also been shown for Gesneriaceae in southeastern Brazil (Perret et al., 2007). In some cases, allopatric speciation is linked to long-distance dispersal (e.g., M. neblinae on Sierra de Neblina in southern Venezuela, and M. valerioi in Costa Rica), but often allopatric sister taxa occur in more adjacent parts of the same mountain range (e.g., M. cinchoni-folia(Gilg) Weaver in western Bolivia and M. normae J. R. Grant in southern Peru). Such north-south patterns are common and indicate either dispersals along mountain ridges or historical splitting of larger ancestral populations into separate species after isolation. Both scenarios support the theory that mountain ranges such as the Andes represent virtual islands (Young et al., 2002). In the case of Macrocarpaea, most species occur on the slopes and not on the summits, but slopes may serve as isolated units as well. Isolated pa´ramos on Andean summits have long been considered analogs to island chains such as Hawaii and the Gala´pagos (Young et al., 2002), but our data also support this for lower elevations. Many of the pa´ramo plants are relatively recent immigrants from plant groups from the northern temperate zones, whereas the forested slopes include primarily Neotropical floristic elements that reach high species diversity in the Andes. Within Helieae, the highest species diversity is found in the Andes, but is largely represented by only two genera, Macrocarpaea and Symbolanthus (Molina & Struwe, 2008). The Amazon lowlands and the Brazilian and Guayana Shields have much fewer species, but they represent the ancestral evolutionary lineages (Struwe et al., 2002, 2009).
The seeds of Macrocarpaea can be divided into two major types: very small and winged or larger, angular, and heavier. Winged seeds, which promote dispersal
over larger distances, are found in clades V and VI, which show repeated dispersal patterns north-south within the southern clade. Such seeds are also found in the northern group at node 12 (Fig. 3), M. gondoloidesJ. R. Grant and M. luteynii J. R. Grant & Struwe, as an independently derived character trait. The northern group with heavier seeds shows fewer occasions of dispersal, but is also more poorly sampled. Because it was not possible to include all species in our study due to unavailability of material, species from the southern area are overrepresented.
Pollinator information for Macrocarpaea species is relatively scarce, but most species appear to be generalists and are pollinated by a multitude of animal groups and species (Grant, pers. obs.). Pollinator segregation therefore does not support sympatric speciation in Macrocarpaea, and it is more likely that ecological niche divergence or population isolation and subsequent fixation of different traits in smaller populations have led to different species. ECOLOGICAL NICHE PATTERNS
Results from the SEEVA analysis of sister species show that all species pairs have individual divergence patterns and environmental differences. Divergence in ecological niches is common both in allopatric and sympatric species in Macrocarpaea, and generally these divergences are not significantly different in size between the two speciation types, but these variables differ between species pairs. For example, divergences were found based on different altitudinal zones (M. apparata and M. elix; node 37, Fig. 3) and on different types of bedrock and in zones with different climate seasonality (M. dies-viridis and M. lenae; node 45, Fig. 3). Perret et al. (2007) also found a lack of increased divergence in sympatric species when compared with allopatric species.
The species differences found with SEEVA show only patterns, not processes, and variables should not be seen as the probable cause for speciation, unless further studies can show adaptation to specific environments or changes linked to paleoclimatological or geological events. We know that species have moved around on a geographic scale, especially during the Pleistocene, but their ecological niches might have been more stable due to niche conserva-tism. Using a different approach, Peterson et al. (1999) showed that speciation through geographic separation often appears before ecological niche separation in vertebrates and butterflies in Mexico, and our results indicate the same. Extracting environmental data from current locations therefore most likely represents historical ecological niches, if not the historical location of the population.
In future studies, it would be interesting to compare species pairs for particular areas from many different genera to determine whether ancestral populations reacted similarly to climatological and geological events in the past, and whether recurrent ecological niche divergence appeared in unrelated lineages. This would be possible, for example, in the Amotape– Huancabamba Zone, where we now have at least four different data sets from angiosperms (including the studies by Weigend, 2002, 2004).
Our study shows that explanations of speciation events need to be sought individually for each species pair, and that generalities are not necessarily applicable across a larger species group distributed over a large area. If we want to understand speciation patterns, the ecological niches of species, and threats and means to the conservation of these species, much more data need to be collected and analyzed (Young et al., 2002). One major difficulty is the lack of up-to-date revisionary, phylogenetic, and georeferenced data for most plant genera. Species-level phylogenies only represent a small percentage of Neotropical biodiversity, and there is a dire need for more taxonomic work that can be integrated with biogeog-raphy, ecology, and conservation.
Literature Cited
Berry, P. E. 1982. The systematics and evolution of Fuchsia section Fuchsia (Onagraceae). Ann. Missouri Bot. Gard. 69: 1–198.
———, W. J. Hahn, K. J. Sytsma, J. C. Hall & A. Mast. 2004. Phylogenetic relationships and biogeography of Fuchsia (Onagraceae) based on noncoding nuclear and chloroplast DNA data. Amer. J. Bot. 91: 601–614. Burnham, R. J. & A. Graham. 1999. The history of
neotropical vegetation: New developments and status. Ann. Missouri Bot. Gard. 86: 546–589.
Carlquist, S. & J. R. Grant. 2005. Wood anatomy of Gentianaceae, tribe Helieae: Diversification in relation to ecology, habit, and systematics; the effect of sample diameter. Brittonia 57: 276–291.
Clapperton, C. 1993. Quaternary Geology and Geomorphol-ogy of South America. Elsevier, Amsterdam.
Duellman, W. E. & J. B. Pramuk. 1999. Frogs of the genus Eleutherodactylus(Anura: Leptodactylidae) in the Andes of northern Peru. Sci. Pap. Nat. Hist. Mus. Univ. Kansas 13: 1–78. Frasier, C., V. A. Albert & L. Struwe. 2008. Amazonian lowland, white sand areas as ancestral regions for South American biodiversity: Biogeographic and phylogenetic patterns in Potalia(Gentianaceae). Organisms Diversity Evol. 8: 44–57. Ghosh, P., C. N. Garzione & J. M. Eiler. 2006. Rapid uplift of the Altiplano revealed through C-O bonds in paleosol carbonates. Science 311: 511–515.
Goloboff, P. 1999. NONA (NO NAME) ver. 2. Published by the author, Tucuma´n, Argentina.
Gould, K. R. & L. Struwe. 2004. Phylogeny and evolution of Symbolanthusand Wurdackanthus (Gentianaceae-Helieae) in the Guayana Highlands and Andes, based on ribosomal 5S-NTS sequences. Ann. Missouri Bot. Gard. 91: 438–446.
Grant, J. R. 2003. De Macrocarpaeae Grisebach (ex Gentianaceis) speciebus novis II: Typification of the Ruiz & Pavon names. Harvard Pap. Bot. 7(2): 423–436. ———. 2004. De Macrocarpaeae Grisebach (ex
Gentiana-ceis) speciebus novis V: Twenty-three new species largely from Peru, and typification of all species in the genus. Harvard Pap. Bot. 9(1): 11–49.
———. 2005. De Macrocarpaeae Grisebach (ex Gentiana-ceis) speciebus novis VI: Seed morphology, palynology, an infrageneric classification, and another twenty-three new species, largely from Colombia. Harvard Pap. Bot. 9(2): 305–342.
———. 2007. De Macrocarpaeae Grisebach (ex Gentiana-ceis) speciebus novis VII: Four new species and two natural hybrids. Harvard Pap. Bot. 11(2): 129–139. ———. 2008. De Macrocarpaeae Grisebach (ex
Gentiana-ceis) speciebus novis VIII: Two new species from Ecuador. Harvard Pap. Bot. 13(2): 253–259.
——— & L. Struwe. 2001. De Macrocarpaeae Grisebach (ex Gentianaceis) speciebus novis I: An introduction to the genus Macrocarpaea and three new species from Colom-bia, Ecuador, and Guyana. Harvard Pap. Bot. 5: 489– 498.
——— & ———. 2003. De Macrocarpaeae Grisebach (ex Gentianaceis) speciebus novis III: Six new species of moon-gentians (Macrocarpaea, Gentianaceae: Helieae) from Parque Nacional Podocarpus, Ecuador. Harvard Pap. Bot. 8(1): 61–81.
——— & R. E. Weaver Jr. 2003. De Macrocarpaeae Grisebach (ex Gentianaceis) speciebus novis IV: Eleven new species of Macrocarpaea (Gentianaceae: Helieae) from Central and South America, and the first report of the presence of stipules in the family. Harvard Pap. Bot. 8(1): 83–109.
———, P. J. M. Maas & L. Struwe. 2006. Yanomamua araca (Gentianaceae), a new genus and species from Serra do Araca´, an outlier of the Guayana Region in Amazonas, Brazil. Harvard Pap. Bot. 11(1): 29–37.
Gregory-Wodzicki, K. M. 2000. Uplift history of the Central and Northern Andes: A review. Bull. Geol. Soc. Amer. 112(7): 1091–1105.
Haffer, J. 1987. Quaternary history of tropical America. Pp. 1–18 in T. C. C. Whitmore & G. T. Prance (editors), Biogeography and Quaternary History in Tropical Amer-ica. Clarendon Press, Oxford.
Heiberg, E. 2008. SEEVA. Software for Spatial Evolutionary and Ecological Vicariance Analysis, ver. 0.4. Lund University, Lund, Sweden. ,http://seeva.heiberg.se., accessed 1 November 2008.
——— & L. Struwe. 2008. SEEVA Manual. Rutgers University, Newark, New Jersey. ,http://seeva.heiberg. se. and ,http://www.rci.rutgers.edu/,struwe/seeva., accessed 21 November 2008.
Hijmans, R. J., S. E. Cameron, J. L. Parra, P. G. Jones & A. Jarvis. 2005. Very high resolution interpolated climate surfaces for global land areas. Int. J. Climatol. 25: 1965–1978.
Iturralde-Vinent, M. A. & R. D. E. MacPhee. 1999. Paleogeography of the Caribbean region: Implications for Cenozoic biogeography. Bull. Amer. Mus. Nat. Hist. 238: 1–95.
Jørgensen, P. M., C. Ulloa Ulloa & C. Maldonado. 2007. Riqueza de plantas vasculares. Pp. 37–50 in R. M. Moraes, B. Øllgaard, L. P. Kvist, F. Borchsenius & H. Balslev (editors), Bota´nica Econo´mica de los Andes Centrales. Universidad Mayor de San Andre´s, La Paz.