HAL Id: tel-00609548
https://tel.archives-ouvertes.fr/tel-00609548
Submitted on 19 Jul 2011
HAL is a multi-disciplinary open access
archive for the deposit and dissemination of
sci-L’archive ouverte pluridisciplinaire HAL, est destinée au dépôt et à la diffusion de documents
Analysis of the non classical class I genes of the MHC in
swine
Hu Rui
To cite this version:
Hu Rui. Analysis of the non classical class I genes of the MHC in swine. Life Sciences [q-bio]. Université de Versailles-Saint Quentin en Yvelines, 2011. English. �tel-00609548�
UNIVERSITE DE VERSAILLES SAINT-QUENTIN-EN-YVELINES
Ecole Doctorale des Génomes Aux Organismes (DGAO)
UMR de Génétique Animale et Biologie Intégrative INRA, Département de Génétique Animale
AgroParisTech, Département Sciences de la Vie et Santé
THESE DE DOCTORAT
DE L’UNIVERSITE DE VERSAILLES SAINT–QUENTIN–EN YVELINES
Spécialité : Génétique moléculairePrésentée par : Rui HU
Pour obtenir le grade de Docteur de l’Université de Versailles Saint-Quentin-en-Yvelines
Etude des gènes de classe I non classiques du complexe majeur
d’histocompatibilité chez le porc
Analysis of the non classical class I genes of the MHC in swine
Soutenue le : vendredi 13 mai 2011
Directeur de thèse: Dr Claire Rogel-Gaillard, INRA Devant le jury composé de :
Président : Pr Bernard Mignotte, Université de Versailles Saint Quentin en Yvelines
Rapporteurs: Dr Keith BALLINGALL, Moredun Research Institute, Scotland, UK Dr Philippe Le BOUTEILLER, INSERM, Toulouse, France
Examinateurs : Dr Isabelle SCHWARTZ-CORNIL, INRA, Jouy-en-Josas, France Dr Isabelle HUE, INRA, Jouy-en-Josas, France
TABLE OF CONTENTS
Résumé ... 1
Avant-propos ... 5
Introduction ... 9
1- History of MHC research ... 9
1.1- In mouse and human ... 9
1.2- In swine ... 10
2- The MHC locus in mammals ... 11
2.1- Chromosomal mapping ... 11
2.2- Overall organization and size ... 11
2.3- The MHC class III region: a well conserved segment ... 13
2.4- The MHC class II region ... 14
2.4.1- HLA class II region ... 14
2.4.2- SLA class II region ... 14
2.4.3- BoLA and OLA class II ... 15
2.5- The MHC class I region ... 15
2.5.1- HLA class I region ... 15
2.5.2- SLA class I region ... 16
3- MHC class Ia genes and molecules ... 17
3.1- Organization and gene structure ... 17
3.2- Expression ... 19
3.3- Functions ... 20
4- MHC class Ib genes and molecules ... 26 4.1- Gene structure ... 26 4.2- HLA class Ib ... 27 4.2.1- HLA-E ... 27 4.2.2- HLA-F... 29 4.2.3- HLA-G ... 32 4.3- SLA class Ib ... 36 4.4- Polymorphism ... 37
5- Aim of the work ... 40
Materials and Methods ... 43
1- Transcription studies ... 43
1.1- Animals and samples ... 43
1.2- RNA extraction ... 43
1.3- Primer design ... 44
1.4- Reverse Transcription ... 46
1.5- PCR amplification ... 46
1.6- DNA fragment purification ... 47
1.6.1- Purification of DNA from agarose gels ... 47
1.6.2- Direct purification from PCR ... 47
1.7- PCR fragment cloning and sequencing ... 48
1.7.1- Ligation reaction ... 48
1.7.2- Preparation of electro-competent bacteria ... 48
1.7.3- Transformation of competent bacteria ... 49
1.7.4- Screening of recombinant bacteria ... 50
1.7.5- Plasmid DNA preparation ... 50
1.8- Sequence analysis ... 51
2- Protein studies ... 52
2.1- Protein structure prediction ... 52
2.2- Construction of expression vectors ... 52
2.2.2- Vectors for transfection in mammalian cells ... 53
2.2.3- Vectors for transfection in drosophila cells ... 53
2.3- Large scale preparation of plasmid DNA ... 55
2.4- Cell lines and transfection ... 56
2.4.1- Insect cells: the drosophila Schneider 2 cells (SC2) ... 56
2.4.1.a- Cell culture conditions ... 56
2.4.1.b- Transient transfection of SC2 cells ... 57
2.4.1.c- Stable transfection of SC2 cells ... 58
2.4.2- Mammalian cells: porcine PK15 cells ... 58
2.5- RNA extraction from transfected cells ... 59
2.6- Monoclonal antibody production specific for the SLA-Ib molecules ... 59
2.7- Western blot analysis for detection of expressed proteins in SC2 cells ... 59
2.8- Fluorescent Activating Cell Sorting (FACS) analysis ... 60
2.8.1- Detection of molecules on the cell surface ... 60
2.8.2- Detection of molecules in the cytoplasm by cell permeabilization ... 61
3- Polymorphism studies ... 62
3.1- Primer sets for long range PCRs specific for the SLA-Ib genes ... 62
3.2- Animals ... 63
3.3- Long Range PCR and cloning ... 63
Results ... 69
1- SLA Ib transcription ... 71
1.1- Characterization of SLA-Ib transcripts ... 71
1.1.1- Identification of alternative transcription for SLA-6 and -7 but not SLA-8 ... 71
1.1.2- SLA-6: five transcripts ... 72
1.1.2.b- SLA-6-1 to SLA-6-4 transcripts: alternative spliced variants ... 73
1.1.3- SLA-7: seven transcripts ... 74
1.1.3.a- SLA-7-001 and SLA-7: two different transcripts that stand for the full coding sequence 76 1.1.3.b- SLA-7-1 to SLA-7-5: alternative RNA variants with a complex pattern ... 76
1.1.4- SLA-8: a unique full length transcript ... 78
1.1.5- Validation of two splice sites by genomic DNA amplification of SLA Ib ... 78
1.2- Tissue specificity ... 80
1.2.1- Relative expression of SLA-Ib genes and comparison with SLA-Ia genes ... 80
1.2.2- Expression of the transcript variants in various tissues ... 81
1.2.2.a- SLA-6 ... 81
1.2.2.b- SLA-7 ... 83
2- SLA Ib protein ... 87
2.1- Protein structure ... 87
2.1.1- Predicted SLA-6 protein isoforms ... 87
2.1.2- Predicted SLA-7 protein isoforms ... 89
2.1.3- Predicted SLA-8 protein ... 91
2.1.4- Conclusion on protein prediction ... 91
2.2- Protein expression ... 92
2.2.1- Experimental design of the experiments ... 92
2.2.2- Construction of the expression vectors ... 93
2.2.2.a- Expression vectors for expression in mammalian cells ... 93
2.2.3- Protein expression in drosophila cells ... 95
2.2.3.a- Detection of target RNAs in transfected cells ... 95
2.2.3.b- Detection of target proteins in transfected cells ... 96
2.2.4- Protein expression in PK15 cells and antibody screening ... 99
3- SLA Ib polymorphism ... 105
3.1- cDNA sequencing: identification of coding SNPs (cSNPs) ... 105
3.1.1- SLA-6 ... 105
3.1.2- SLA-7 ... 106
3.1.3- SLA-8 ... 107
3.2- Characterization of the nucleotide polymorphism at the whole gene level ... 107
3.2.1- Experimental design ... 107
3.2.2- SLA-7 polymorphism ... 110
3.3- Copy Number Variation (CNV) of SLA Ib genes ... 115
3.3.1- SLA-7 SNP haplotypes ... 116
3.3.2- SNP quantification by pyrosequencing ... 116
Discussion ... 125
1- Polymorphism of SLA-Ib genes: characterization of SNPs and CNVs ... 125
2- A splicing pattern with various complexities according to genes ... 129
3- Tissue specificity of SLA-Ib gene transcription and variations observed between MeLiM and Large White animals ... 132
4- Comparison of SLA Ib to HLA Ib genes ... 135
5- Properties of the putative proteins encoded by SLA-Ib genes ... 136
Publication # 2 ... 171
Abstracts and posters ... 184
Supplementary files ... 189
Abstract / Résumé……….………...………..………211
LIST OF FIGURES
Figure I: General organization of MHC in human, pig and ovine ... 12Figure II: The genomic organization of the pig and human MHC class I regions ... 17
Figure III: The structure of MHC class I molecules ... 18
Figure IV: MHC class Ia gene structure ... 19
Figure V: MHC class I antigen presentation procedure ... 22
Figure VI: Comparative gene structure of SLA-Ia and Ib genes ... 26
Figure VII: HLA-E transcripts and protein structure ... 27
Figure VIII: HLA-F transcripts (A) and predicted protein structures (B)... 30
Figure IX: Alternatively HLA-G transcripts and protein isoform structure ... 34
Figure X: HLA-G immune cell interaction ... 35
Figure XI: Restriction map of the plasmid pVAX1-SLA6 ... 53
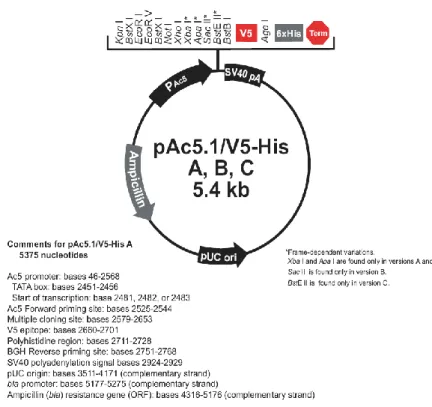
Figure XIII: Cloning of cDNAs into the expression vector (pAc5.1/V5-His vector) ... 55
Figure XIV: General strategy to study the polymorphism of SLA-Ib genes ... 62
Figure XV: PCR result of full-length cDNA of SLA Ib ... 72
Figure XVI: Five SLA-6 transcripts obtained from MeLiM pig ... 73
Figure XVII: SLA-7 transcripts obtained from MeLiM pig ... 75
Figure XVIII: SLA-8 transcript obtained from MeLiM pig ... 78
Figure XIX: Validation of splicing events by PCR amplification of SLA-6 (A) and SLA-7 (B) partial segments from genomic DNA ... 79
Figure XX: Detection of SLA-6 RNA variants in various tissues from MeLiM and Large White pigs by RT-PCR ... 82
Figure XXI: Detection of SLA-7 RNA variants in various tissues from MeLiM and Large White pigs by RT-PCR ... 84
Figure XXII: Detection of SLA-8 RNAs in various tissues from MeLiM and Large White pigs by RT-PCR ... 85
Figure XXIII: Prediction of SLA-6 protein encoded by the various splice variants... 89
Figure XXIV: Prediction of SLA-7 protein isoforms encoded by the splice variants SLA-7 (A, B) and SLA-7-1 (C, D) ... 90
Figure XXVII: Detection of B2M transcripts by RT-PCR ... 96
Figure XXVIII: Cell surface expression of B2M by FACS ... 98
Figure XXIX: Detection of SLA molecules by FACS in the cytoplasm (A) or on surface (B) of PK15 cells transiently transfected with the vector pVAX1-SLA6 ... 100
Figure XXX: Detection of SLA molecules by FACS on surface of PK15 cells transiently transfected with the vector pVAX1-SLA8 ... 101
Figure XXXI: The primer positions used in primer walking sequencing ... 108
Figure XXXII: Gel electrophoresis showing amplification of SLA-6, -7 and -8 genes by long range PCRs ... 109
Figure XXXIII: Different haplotypes of SLA-7 identified in the MeLiM pig 484 ... 116
Figure XXXIV: Primer design for pyrosequencing ... 119
Figure XXXV: Pyrosequencing result for SNP1535 and SNP1540 from MeLiM pig ... 120
LIST OF TABLES
Table I: SLA Ia polymorphism and haplotypes ... 25Table II: Expression patterns of HLA-Ib genes inferred from EST sources ... 31
Table III: The comparison of polymorphism between class Ia and class Ib genes ... 38
Table V: Gene specific primers used for transcription studies ... 45
Table VI: Universal and internal primers used for SLA Ib transcript sequencing ... 51
Table VII: cDNA sequence features ... 52
Table VIII: Antibodies used for FACS analysis ... 61
Table IX: Primer sets designed to amplify the SLA Ib genomic sequences ... 63
Table X: Primers for SLA Ib gene sequencing ... 64
Table XI: Primers for pyrosequencing PCR and sequencing ... 66
Table XII: The mixture for PCR amplification ... 68
Table XIII: Characteristics of the inserts sub-cloned into expression vectors ... 94
Table XIV: Screening of anti-SLA-6 monoclonal antibodies by FACS in PK15 cells transiently transfected with the pVAX1-SLA6 vector ... 102
Table XV: Screening of anti-SLA-8 monoclonal antibodies by FACS in PK15 cells transiently transfected with the pVAX1-SLA8 vector ... 103
Table XVI: SLA-6 Coding SNP Position ... 106
Table XVII: SLA-7 Coding SNP position ... 107
Table XVIII: Number of clones selected per animal for sequencing SLA-7 and SLA-8 genes Clone information ... 110
Table: XX: SNP position on SLA-8 gene ... 114
Tableau XXI: Allele frequency of SNPs at positions 3601, 1535 and 1540 by pyrosequencing ... 121
Tableau XXII: The relative frequency of the paralogous sequences of SNP 1535 ... 122
Résumé
Le complexe majeur d'histocompatibilité (CMH) a été intensément étudié depuis qu'il a été identifié comme un acteur majeur de la réponse immunitaire en distinguant les molécules du soi de celles du non soi. Le CMH est une région conservée chez les vertébrés supérieurs à mâchoires et son apparition est souvent reliée à l’émergence de la réponse immunitaire adaptative. Le CMH est sub-divisé en trois sous-régions, appelées régions de class I, II et III. Les régions de classe I et II contiennent les gènes qui codent pour les molécules d’histocompatibilité de classe I et II, respectivement. Les molécules de classe I présentent des peptides endogènes et viraux aux cellules T cytotoxiques et modulent l’activité des cellules natural killer (NK). Les molécules de classe II présentent des peptides exogènes aux cellules T helper CD4+. Outre ces gènes d’histocompatibilité, le CMH contient de nombreux autres gènes reliés ou non à la réponse immunitaire, dont les fonctions ne sont pas toutes élucidées.
Suite aux travaux de cartographie et de séquençage du CMH, il a été montré que les gènes de classe I se subdivisent en deux groupes qui distinguent les gènes de classe I classiques (Ia) qui codent pour les molécules dont les fonctions ont été décrites ci-dessus des gènes de classe I non classiques (Ib). D’après ce qui est connu pour l’espèce humaine, les molécules Ib du CMH connues sous le nom de HLA-E, -F et -G, ont des fonctions immuno-modulatrices lors de l’induction de la tolérance de la mère pour le foetus au cours de la grossesse, notamment en modulant l’activité des cellules NK. Des fonctions de tolérance
et 3 correspondant aux domaines alpha 1 et 2 qui forment le sillon dans lequel vient se positionner le peptide présenté aux cellules T cytotoxiques. A l’inverse, les gènes Ib du CMH ont un niveau faible de polymorphisme, présentent des variations de structure dans la région qui code pour la queue intra-cytoplasmique, ont une expression tissulaire restreinte exprimés et expriment des transcrits alternatifs. L’expression et le rôle de ces gènes de classe Ib est très peu étudié chez les animaux non modèles comme le porc, alors qu’ils revêtent un intérêt majeur s’ils sont capables d’induire ou de lever une immuno-tolérance.
L'objectif de la thèse a été de caractériser l'expression et le polymorphisme des gènes SLA-6, SLA-7 et de SLA-8 qui sont les trois gènes du CMH caractérisés comme de classe I non classique chez le porc. Nous avons mené ce travail en utilisant des échantillons biologiques provenant de porcs Large White et de porcs MeLiM qui développent spontanément des mélanomes. Nos résultats ont permis de démontrer que les trois gènes sont transcrits dans une large gamme de tissus, avec une prédominance dans les tissus lymphoïdes, le système digestif et les poumons. Les transcrits SLA-6 et -7 présentent des épissages alternatifs alors qu’un unique transcrit a été identifié pour le gène SLA-8. Les trois gènes expriment des transcrits qui codent pour des protéines complètes dont la prédiction de conformation est compatible avec la présentation de peptide à la surface des cellules. SLA-6 et -7 expriment des transcrits alternatifs qui codent pour des protéines putatives de propriétés variables dont certaines pourraient être solubles, de par l’absence de domaine trans-membranaire. Le gène SLA-7 s’est révélé le plus complexe. Les études de transcription ont permis la ré-annotation du gène avec huit exons au lieu de sept comme initialement décrit. De plus, nous avons montré l’existence d’un épissage alternatif dans l’exon 4 avec l’utilisation d’un site rare d’épissage (GA-AG au lieu de GT-AG), ainsi que l’existence d’un épissage alternatif dans la
région 3’ non codante, en aval du codon de terminaison. Les deux formes de transcrits dans la région 3’ non codante ont été trouvées co-exprimées dans les tissus de porcs MeLiM alors que seul le transcrit non épissé a été trouvé dans les tissus de porcs Large White. Nos résultats confirment un niveau faible de polymorphisme nucléotidique et démontrent l’existence d’un nombre variable de copies du gène SLA-7 selon les races de porc: au moins deux copies du gène chez les porcs MeLiM alors qu’une copie est présente chez le porc Large White inclus dans notre étude. Ces résultats indiquent que le polymorphisme du gène SLA-7 inclue à la fois des variations de nucléotides et de nombre de copies. Afin de progresser dans l’étude de l’expression des molécules SLA-Ib, nous avons mis au point des systèmes d’expression des molécules dans des cellules épithéliales de porc et dans des cellules de drosophile et avons fait produire par une société commerciale, au cours de la thèse, des anticorps dirigés contre chacune des molécules. Les anticorps monoclonaux anti-SLA-6 et -8 sont en cours de test et reconnaissent des molécules exprimées en surface mais nous ne pouvons encore conclure quant à leur réelle spécificité. Pour conclure, nous avons produits des données nouvelles sur les gènes SLA-Ib à l’échelle de la structure génomique et de la transcription et les expériences en cours sur l’expression des protéines devraient nous permettre prochainement de conclure quant aux propriétés de ces moélcules de s’exprimer à la surface des cellules. L’ensemble de ces études est une étape vers d’autres travaux qui viseront à étudier l’expression des gènes SLA-Ib au cours du développement embryonnaire, à l’interface foeto-maternelle, ainsi que dans les tumeurs en progression et régression dans le modèle biomédical MeLiM. Savoir si les molécules SLA-Ib sont les homologues
Avant-propos
The Major Histocompatibility Complex (MHC) has been intensively studied since it was first identified as a major actor of individual immune response against pathogens by distinguishing self from non self. The MHC can be considered one of the most well known genomic regions among living vertebrate organisms. However, knowledge about MHC is far from completed. Sequencing data and molecular immunology as well as a growing number of genetic association studies constantly provide new insights into MHC studies and functions. The MHC was first described as a genetic system due to a high polymorphism of MHC molecules. Before genome mapping and sequencing techniques could be applied to MHC analysis, studies on MHC were carried out with cellular, serological, and immunochemical analysis methods. Those methods revealed the biochemical and immunochemical features of MHC, but the genomic information remained limited. Genetic and physical maps were further drawn and during the last decade, the locus has been fully sequenced in many species. The first complete MHC was sequenced in the human in 1999 (MHC-Sequencing-Consortium 1999) followed by the mouse in 2002 (Waterston et al. 2002), the chimpanzee MHC class I region in 2003 (Anzai et al. 2003), the rat in 2004 (Hurt et al. 2004), the pig in 2006 (Renard et al. 2006), and the cattle in 2010 (Gao et al. 2010). These new datasets contributed to the identification of numerous genes, many of which do not encode MHC molecules or have an immunity-related function.
Sequencing data have clarified the number and genomic organization of genes in each MHC gene family and have provided a refined classification of MHC class I genes into classical
function and non-classical molecules have complementary functions not yet fully understood. Moreover, it is well established that classical genes have a universal function among species whereas non-classical genes may have either functions shared between species or species specific functions. Therefore, analyses of non-classical genes must be addressed species by species.
The pig is an important agricultural animal as well as a model animal for biomedical research (e.g. xenotransplantation). Swine is a known as a highly relevant species for human disease and physiology studies due of its high degree of similarity to humans. Since the initial studies, a large research community working on the pig MHC was organized and the pig MHC research has followed the same main steps as in other species: description of a genetic system, characterization of haplotypes, physical mapping, sequencing and gene annotation. As in other species, these findings have led to the refinement of the MHC gene series and identification of non-classical genes whose functions remain to be elucidated.
Very limited data are available on the three non-classical MHC class I genes referred to as SLA-6, SLA-7 and SLA-8 in swine. It is a major issue to know whether these genes have immunity-related functions that would be pig-specific or if they are functional homologues of class Ib genes in other species. In various species, the class Ib genes were reported to differ from class Ia genes by several features that include a limited polymorphism, a modified structure of the cytoplasmic tail, tissue specificity and expression of alternative splice transcripts. Moreover, all encoded molecules do not have the same ability to present peptides on cell surface. In order to increase knowledge on MHC class Ib genes and molecules in swine, our purpose was to analyse the SLA-6, -7 and -8 genes at the genomic, RNA and protein levels. The corresponding questions are summarized as follows:
At the genomic DNA level: are the SLA-Ib genes oligomorphic, as expected ?
At the transcription level: i)- do SLA-6, -7 and -8 express alternative variants and if
yes, which ones? ii) - in which tissues are the RNAs expressed?
At the protein level: are the SLA-Ib molecules expressed on cell surface and if yes,
do they present peptides?
In the introduction, history about the MHC discovery, MHC organization and knowledge about classical and non-classical class I genes will be summarized, mostly by comparing human and pig MHCs. The Material and Methods and Result sections have been divided in three parts related to transcription studies, protein expression, and gene polymorphism. Two articles have been accepted and are attached at the end of the manuscript. The last section aims at discussing new insights on MHC non-classical gene studies provided by the results presented in this report.
Introduction
1- History of MHC research
The MHC is a genomic region that contains a cluster of genes involved in the immune response (Horton et al. 2004). The MHC region was found in all jawed vertebrates examined to date (Kelley et al. 2005). The function of MHC molecules in presenting peptides to various T cell subsets has been identified as a crucial strategy to recognize peptides derived from foreign pathogens and to protect organisms from disease. Occurrence of MHC has often been related to the emergence of adaptive immunity as reviewed by Danchin et al (Danchin et al. 2004).
1.1- In mouse and human
MHC studies started more than 70 years ago. In 1936, Peter A. Gorer first reported the mouse antigen II as a major histocompatibility antigen that was named histocompatibility-2 (H-2) (Schutze et al. 1936). Later, studies showed that the H-2 contained a series of variable molecules and H-2 was further described as the H-2 complex. The mouse H-2 complex was the first major histocompatibility complex discovered (Klein 1986). A system analogous to the H2-complex was described in human by Jean Dausset (Dausset 1958) and further referred to as the Human Leucocyte Antigen Complex or HLA complex (Ivanyi J. and Pinter 1967).
foreign tissue grafts. Further studies revealed that MHC variability between the donors and acceptors lead to the rejection of the donor graft being identified as non-self by the immune system of the acceptor (Auchincloss et al. 1993, Gould and Auchincloss 1999, Haeney 1995).
The role of MHC in the immune system was unknown until the early 1970s when MHC was shown to control the immune reaction by antigen presentation (Benacerr.B and Mcdevitt 1972, Snell 1976). It was also shown that MHC molecules present peptides to T cell receptors, T cells recognize antigens presented by MHC molecules in a highly restricted manner, meaning that the interaction between T cells and antigen presenting cells originates from a syngeneic background. These findings gave rise to the concept of MHC restriction and MHC-restricted T cells (Archbold et al. 2008, Zinkernagel and Doherty 1974).
1.2- In swine
The first studies in swine started in 1940s and aimed to analyze correlations between allograft acceptance or rejection and known blood groups. In 1970, it was suggested that the blood system E could correspond to the pig MHC (Ivanyi P. 1970). The pig MHC was identified by immunizing piglets from the same litters with cutaneous grafts. The serums from immunized piglets were used to identify the various allelic forms of the class I molecules responsible for immunization. In a second step, longer graft acceptance was found for donor and acceptor animals harbouring similar alleles, confirming that the identified alleles were related to the histocompatibility molecules (Vaiman et al. 1970). The pig MHC was referred to as Swine Leucocyte Antigen complex or SLA complex.
2- The MHC locus in mammals
2.1- Chromosomal mapping
The MHC has been assigned to a chromosome for almost all species for which it has been characterized (review in Kelley et al. 2005). In human, the MHC maps to chromosome 6p21.1 (Lamm and Olaisen 1985). In mouse, the H2 complex maps to chromosome 17. In ovine, the MHC complex (Ovine Leukocyte Antigen or OLA complex) maps to chromosome 20 at position q15-q23 (Dukkipati et al. 2006). In cattle, the MHC (Bovine Leukocyte Antigen or BoLA complex) maps to chromosome 23 (Brinkmeyer-Langford C. et al. 2008).
In pig, the MHC maps to chromosome 7 (Geffrotin et al. 2004) and has been shown to be interrupted by the centromere (Rabin et al. 1985), the class I and III regions mapping to the p arm (7p11) and the class II region mapping to the q arm (7q11). This feature seems unique to the pig among all species in which MHC has been characterized so far.
2.2- Overall organization and size
The MHC locus has been divided into three regions according to the gene content referred to as class I, II and III, (Figure I). The class I and II regions contain MHC class I and II genes, respectively, and the class III region is located at the junction between class I and II and has been named class III in order to split the MHC into regions with similar names. The class III region does not contain histocompatibility genes. Recent reports resulting from sequencing
an interesting cluster of olfactory receptor genes mapped in the vicinity of extended class I region (Horton et al. 2004).
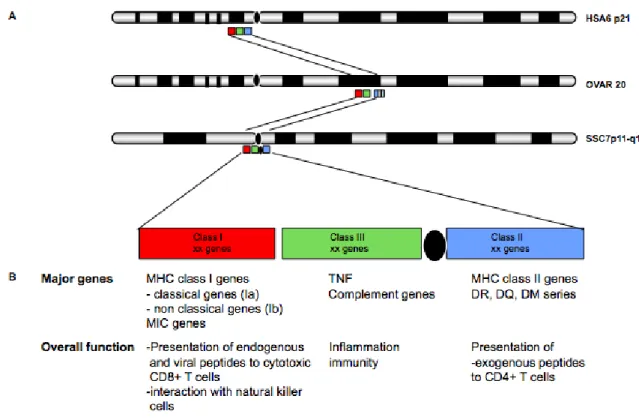
Figure I: General organization of MHC in human, pig and ovine
A. The general scheme of the MHC locus: cytogenetic position of the locus in human (HSA6p21), ovine(ovar20) and pig (SSC7p11-q11). The MHC region is divided into three sub-regions referred to as class I (red box), II (blue box), and III (green box). In human, all three classes MHC map to the long arm. In ovine, the difference from human is that the class II is divided into class IIa and class IIb. In pig, Class I and III map to the short arm while class II is divided from I and III by the centromere situating on the long arm. In the pig, B: The major genes and related functions specific to each MHC sub-region and the summary of major gene content and associated function.
The MHC locus spans several megabases (Mb) in mammalian species. In human, the HLA complex spans 3.6 Mb and 224 genes are annotated along with 128 genes predicted to be expressed (Singh-Gasson et al. 1999). By contrast, the organizational features of the MHCs
of cattle and other ruminants are unique in that class II genes occur in two segments rather than a single segment as observed in other mammalian species such as in human, mouse (Waterston et al. 2002), dog (Wagner 2003), and horse (Gustafson et al. 2003). The two segments are located about 20 cM apart and are designated class IIa and class IIb (Andersson et al. 1998, Band et al. 1998, Brinkmeyer-Langford C. L. et al. 2009, Skow et al. 1996). Class IIa is closely associated with the class I and class III regions, while class IIb is positioned closer to the centromere. The gene order of class IIb in both ovine and bovine regions show an opposite orientation relative to that of human (Gao et al. 2010).The OLA complex spans 2.4 Mb with prediction of 177 protein-coding genes (Gao et al. 2010).
The SLA complex spans 2.4 Mb with an overall organization similar to the HLA complex despite the interruption by the centromere; 151 SLA loci have been annotated and 121 predicted to be functional (Renard et al. 2006).
2.3- The MHC class III region: a well conserved segment
The HLA class III region spans 0.7 Mb in human and swine and encodes non-MHC molecules such as C2, C4 and B factor that belong to the complement system, TNF, LTA and LTB that are cytokines related with inflammation. The class III region also includes heat shock proteins (HSPs).
2.4- The MHC class II region
2.4.1- HLA class II region
The HLA class II region spans 0.9 Mb from C6orf10 to HCG24 and contains HLADRA, DRB1, DRB2, DRB3, DRB4, DRB5, DRB6, DRB7, DRB8, DRB9, DPB1, DMA, -DMB, -DOA, and -DOB. The classical molecules include the DP, DQ and DR series, and the non-classical molecules include the DM and DO gene series. The TAP1 and 2 genes (transporter associated with antigen processing) as well as the proteasome subunits PSMB7 and PSMB9 also map to the class II sub-region.
2.4.2- SLA class II region
The SLA class II sub-region spans 417 Kilobases (Kb) from the butyrophilin like (BTNL) gene cluster close to the centromere downstream to the last annotated locus DOA (Renard et al. 2006). In total, 25 loci are annotated. A single SLA-DRA gene and five SLA-DRB loci are described. DRB1 is full length and DRB4 has a deletion in exon 1. Exons 1 and 6 are missing in DRB3, while only exon 6 is missing in DRB5 and DRB2. Four of five DRB loci are oriented and clustered in a pattern similar to that of other mammals; the remaining SLA-DRB5 locus lies on the opposite strand within the DQ–DO interval. The SLA-DQ region comprises one DQA locus and two DQB loci of which only one is functional. The number of
DRB and DQB copies could vary between different SLA haplotypes, as observed in the
HLA (Horton et al. 2004). The SLA DQ–DO interval also contains a putative locus
(SBAB-554F3.8) and three pseudogenes (SBAB-554F3.9, SLA-DOB2, SLA-DYB) with similarities to TAP2, DO, and artiodactyl-specific DYB, respectively (Renard et al. 2006). From the most centromeric SLA-DRA gene in the class II gene cluster, the order of the expressed
SLA genes is DRB1, DQA, DQB1, DOB1, DMB, DMA and DOA. There are eight pseudogenes in the SLA class II region: SLA-DRB2, SLA-DRB3, SLA-DRB4, SLA-DRB5,
SLA-DQB3, SLA-DOB2, wDYA and wDYB. The class II region also comprises TAP1 and
TAP2 genes as well as PSMB7 and PSMB9 genes.
2.4.3- BoLA and OLA class II
In cattle and sheep, the class II DQ-DO interval is split into two subregions separated by 17– 30 cM (Amills et al. 1998, Jarrell et al. 1995, Wright et al. 1994), giving rise to two loci DYA and DYB that are thought to have evolved from DQ (Ballingall et al. 2004a, Ballingall et al. 2004b). By contrast to other mammalian species, a high polymorphism of DRA genes is observed in ovine species (Ballingall et al. 2004b, Lewin et al. 1999, Wright and Ballingall 1994).
2.5- The MHC class I region
Three categories of MHC class I genes are described, the classical genes (class Ia), the non classical genes (class Ib) and the MHC related class I genes (MIC). We will mostly describe the features of MHC class Ia and Ib genes.
2.5.1- HLA class I region
expressed HLA genes, HLA-A, HLA-B, HLA-C are classical class I (Ia) genes and HLA-E, HLA-F and HLA-G non classical class I (Ib) genes.
2.5.2- SLA class I region
The SLA class I region spans 1.1 Mb (Renard et al. 2006). The SLA class Ia genes include three functional genes SLA-1, -2 and -3 and four pseudogenes, SLA-4, -5, -9 and -11. SLA-5 has all characteristics to be functional but no expression has yet been reported. Two MIC genes are known but only MIC-2 is predicted to be functional while MIC-1 appears to be a pseudogene.
By contrast to human for whom class Ia and Ib genes are intermingled into three clusters, all SLA class Ia genes map to a unique cluster between TRIM26 and TRIM39 and all class Ib and MIC genes map to another unique cluster in the most centromeric part of the locus (Figure II). These features are in agreement with a class I gene duplication that occurred after speciation in a species-specific manner leading to MHCs that harbour a common framework represented by non MHC molecules and histocompatibility molecules with a species-specific organization (Danchin et al. 2004).
Variation in the number of SLA-1 genes has been recently reported in swine and an additional gene termed SLA-12 has been characterized (Tanaka-Matsuda et al. 2009). In pig, there is a unique well sequenced reference haplotype, namely H01 or Hp1a.0 (Ho et al. 2009). The corresponding annotation is available online at the Vertebrate Genome Annotation (VEGA) database (http://vega.sanger.ac.uk/index.html). More haplotypes have to be fully sequenced and annotated to better describe all pig MHC features.
A
B
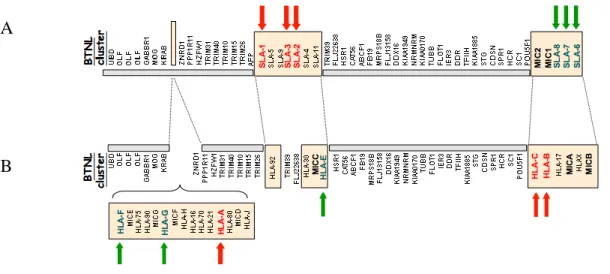
Figure II: The genomic organization of the pig and human MHC class I regions
A. The pig MHC class I region. B. The human MHC class I region. In both A and B the functional MHC class Ia genes are in red font and their position is indicated by red arrows. MHC class Ib genes are in green font and are marked by the green arrows. The orientation of the maps is from the telomere (left side) to the centromere (right side). The class I gene clusters are represented by boxes slightly shaded in pink. In human, the class I genes are distributed into three clusters whereas in swine, in only two clusters. The absence of MHC class I gene in the most telomeric cluster between KRAB and ZNRD1 is represented by an empty rectangle.
3- MHC class Ia genes and molecules
3.1- Organization and gene structure
MHC class Ia molecules are transmembrane glycoproteins of 44 Kilodaltons (KDa) that belong to the immunoglobulin superfamily. They are composed of an chain that is non covalently associated to a chain encoded by the 2-microglobulin (2M) gene that maps outside the MHC region. At the cell surface, the membrane-bound MHC class I molecule is a trimolecular complex that includes the chain, the chain and the peptide, as shown in
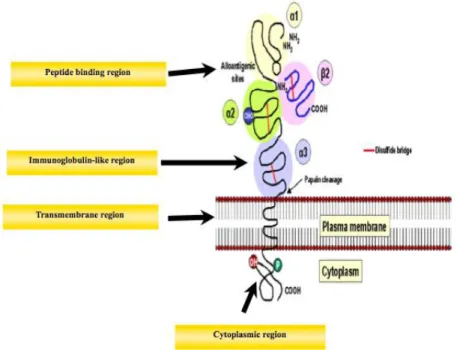
Figure III: The structure of MHC class I molecules
The MHC class I molecule is a heterodimer of a membrane spanning an α chain that is bound non covalently to the β2-microglobulin. The α1 and α2 domains fold together to create a groove, which can bind a peptide.
Adapted from http://www.ncbi.nlm.nih.gov/bookshelf/br.fcgi?book=imm&part=A346
The α chain of MHC class I molecules are encoded by MHC class I genes that have a common genomic organization in eight exons (Figure IV). Exon 1 corresponds to a leader peptide. Exons 2 and 3 encode the polymorphic 1 and 2 domains, respectively. Exon 4 corresponds to the α3 domain, which is an immunoglobulin-like region that binds to the T cell receptor. Exon 5 encodes the transmembrane domain and the remaining exons 6 through 8 stand for the cytoplasmic tail.
Figure IV: MHC class Ia gene structure
The 1 to 3 domains are encoded by exons 2 to 4, the transmembrane (TM) domain by exon 5, and the cytoplamic tail by exons 6 to 8.
3.2- Expression
(Collins et al. 1986). In contrast, the infection of viruses, such as human cytomegaloviruses or adenoviruses can decrease the MHC Ia expression level (Miller et al. 1998, Trgovcich et al. 2006). Down-regulation of MHC Class I molecules has been described in several malignancies (Ritz et al. 2001). For example, in ovarian cancer, down-regulation of MHC Class I was associated with advanced stage of the disease and poor survival (Raffaghello et al. 2007, Rolland et al. 2007). In cervical cancer, only partial loss of MHC Class I was significantly associated with decreased overall survival (Badley and Frelinger 1991). The role of cancer immune escape mechanism in endometrial carcinoma is relatively unknown (Bijen et al. 2010). Modification of expression of MHC class Ia genes has also been reported during pregnancy in human (Trowsdale and Moffett 2008).
3.3- Functions
3.3.1- Peptide presentation to cytotoxic CD8+ T lymphocytes
MHC Class I molecules bind peptide antigens and display themselves to cytotoxic CD8+ T lymphocytes (CTLs). The expressed MHC antigen with non-self peptides are recognized as foreign antigens by T lymphocyte MHC restricted T cell receptors (TCR), which initiates the specific immune response (Germain and Margulies 1993). Thus, MHC class Ia molecules play a major role by providing immune surveillance against intracellular pathogens or viruses. The processing of MHC peptide presentation is a complex procedure that relies on many steps and components. In cells, cytoplasmic and newly synthesized proteins are degraded by the proteasome to 8–9 amino acid long peptides (Yewdell and Bennink 2001). The resulting peptides are translocated into the endoplasmic reticulum (ER) by the transporter associated with antigen processing (TAP1 and TAP2) (Lankat-Buttgereit and
Tampe 2002). TAPs form the core of a multimeric peptide loading complex associating with the glycoprotein tapasin, which binds to nascent MHC class I heavy chain-B2M dimers. The loading complex also contains calreticulin, a lectin-like chaperone binding the monoglucosylated N-linked glycan on class I heavy chain (Radcliffe et al. 2002), and ERp57, a thioloxido reductase noncovalently associated with calreticulin and disulfide-linked to tapasin (Dick et al. 2002). TAP-transported peptides, trimmed by a specific ER aminopeptidase (ERAP) (Saric et al. 2002, Serwold et al. 2002), bind TAP-associated MHC class I-B2M, inducing their release. An intact loading complex within the ER is critical for efficient MHC class I peptide association. Cells and mice lacking tapasin or TAP are deficient in MHC class I Ag presentation (Garbi et al. 2000). The molecular complex released from the ER comprises the class I molecule associated with the B2M chain. This peptide ligand is then driven through the Golgi apparatus for a glycosylation step for final suitability to be presented at the outer cell surface for T cell recognition (Figure V).
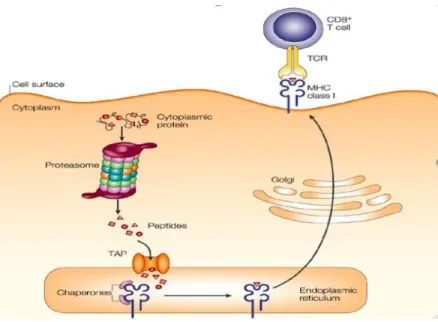
Figure V: MHC class I antigen presentation procedure
Cytosolic and nuclear proteins are degraded by the proteasome into peptides. The transporter for antigen processing (TAP) then translocates peptides into the endoplasmic reticulum (ER) while consuming ATP. MHC class I heterodimers wait in the ER for the third subunit, a peptide. Peptide binding is required for correct folding of MHC class I molecules and release from the ER and transport to the plasma membrane, where the peptide is presented to the immune system. TCR: T-cell receptor. Adapted from (Yewdell et al. 2003).
3.3.2- Modulation of Natural Killer (NK) cells
MHC class Ia molecules also regulate innate immunity as ligands for killer inhibitory receptors (KIRs) on NK cells. They bind to inhibitory receptors on NK cells that include KIR (killer cell Ig-like receptors) in man, C-type lectin-like Ly49 molecules in mouse, and CD94/NKG2A heterodimers in man and mouse (Anfossi et al. 2006, Uhrberg et al. 2001). Failure of MHC class Ia molecules to interact with these receptors may result in the killing of target cells as it occurs during tumour transformation or infection by certain viruses when target cells have lost or express insufficient amounts of MHC class Ia molecules. Each NK cell expresses at least one receptor specific for HLA class I molecules, while the co-expression of two or more self-reactive receptors is rare. This type of receptor distribution
allows the whole NK cell pool to detect the loss of even a single HLA class I allele on self cells, a frequent event in tumor transformation (Garrido et al. 1997). A common characteristic of the various HLA class I-specific inhibitory receptors is the presence, of immunoreceptor tyrosine-based inhibitory motifs in their cytoplasmic tail that enable them to recruit and activate SHP-1 and SHP-2 phosphatases (Lanier 1998, Long 1999, Moretta et al. 1996a). In turn, these phosphatases switch off the activating signalling cascade initiated by the various activating receptors. Provided that turning NK cells ‘off’ represents the major failsafe device to prevent the NK-mediated attack of normal HLA class I autologous cells, an ‘on’ signal must be generated upon interaction of NK cells with potential target cells. This signal is extinguished whenever appropriate interactions occur between inhibitory receptors and MHC class I molecules. On the other hand, the ‘on’ signal can be readily detected when NK cells interact with target cells that lack MHC class I molecules (Moretta et al. 1996b, Moretta and Moretta 2004, Moretta et al. 2004).
3.4- Polymorphism
One remarkable characteristic of MHC class Ia genes is their extremely high polymorphism, particularly in exons 2 and 3 that encode the 1 and 2 domains responsible for the peptide binding groove. This feature is not only a selective advantage for an individual to express class I molecules that bind different repertoires of peptides, but also for a population or species to have many class I variants segregating among its members (Bos and Waldman
terms of haplotypes (a specific combination of alleles of genes on the same chromosome) rather than individual allele specificities.
The human MHC Haplotype Project affirmed that HLA are the most polymorphic genes in the vertebrate genome with 300 total loci, including 122 gene loci with coding substitutions of which 97 were non-synonymous. In the HLA system, over several hundred alleles have
been identified in HLA Ia.The three expressed human MHC classical genes HLA-A, -B and
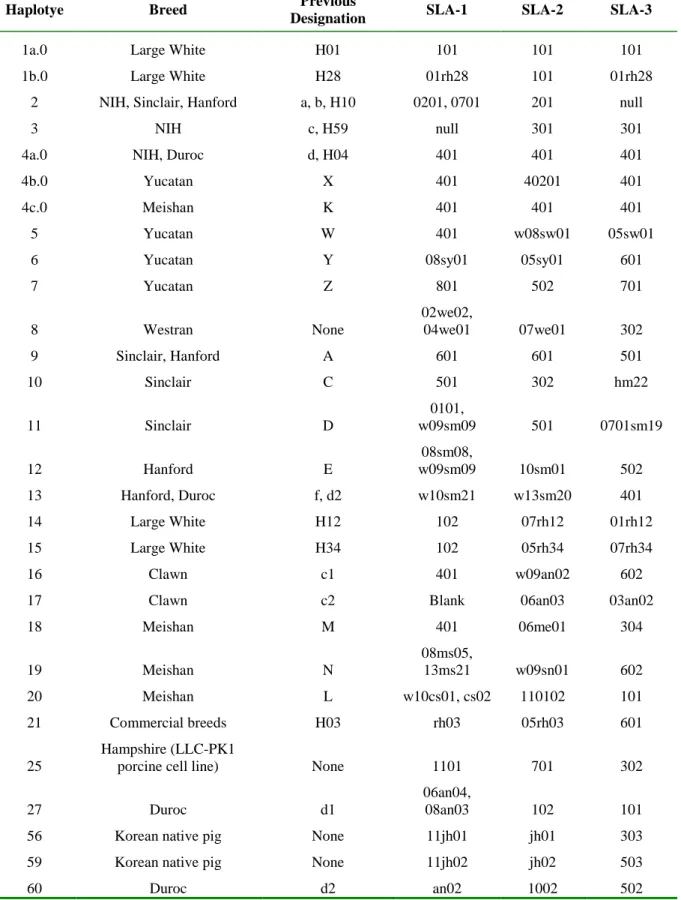
-C are highly polymorphic. Of the three classical class I genes, HLA-B is the most polymorphic with 1381 alleles known at this locus, and 960 for HLA-C. The amount of polymorphism within the peptide-binding region is extremely high, with 1001 HLA-A, 1605 HLA-B, and 690 HLA-C molecules characterised in human populations to date (IMGT/HLA database, http://www.ebi.ac.uk/imgt/hla/stats. html). The porcine MHC class Ia has fewer polymorphism than the human MHC class Ia molecules. To date, SLA-1 has 44 alleles matching to 44 proteins, SLA-2 has 46 alleles for 44 proteins, and 26 alleles corresponding to 26 proteins are reported for SLA-3 (http://www.ebi.ac.uk/ipd/mhc/sla/stats.html). Known SLA-Ia polymorphisms and organization into haplotypes are summarized in Table I.
Table I: SLA Ia polymorphism and haplotypes
Haplotye Breed Previous
Designation SLA-1 SLA-2 SLA-3
1a.0 Large White H01 101 101 101
1b.0 Large White H28 01rh28 101 01rh28
2 NIH, Sinclair, Hanford a, b, H10 0201, 0701 201 null
3 NIH c, H59 null 301 301
4a.0 NIH, Duroc d, H04 401 401 401
4b.0 Yucatan X 401 40201 401
4c.0 Meishan K 401 401 401
5 Yucatan W 401 w08sw01 05sw01
6 Yucatan Y 08sy01 05sy01 601
7 Yucatan Z 801 502 701 8 Westran None 02we02, 04we01 07we01 302 9 Sinclair, Hanford A 601 601 501 10 Sinclair C 501 302 hm22 11 Sinclair D 0101, w09sm09 501 0701sm19 12 Hanford E 08sm08, w09sm09 10sm01 502 13 Hanford, Duroc f, d2 w10sm21 w13sm20 401 14 Large White H12 102 07rh12 01rh12 15 Large White H34 102 05rh34 07rh34 16 Clawn c1 401 w09an02 602
17 Clawn c2 Blank 06an03 03an02
18 Meishan M 401 06me01 304 19 Meishan N 08ms05, 13ms21 w09sn01 602 20 Meishan L w10cs01, cs02 110102 101 21 Commercial breeds H03 rh03 05rh03 601 25 Hampshire (LLC-PK1
porcine cell line) None 1101 701 302
4- MHC class Ib genes and molecules
MHC class Ib genes belong to the MHC class I gene series and present various features that led authors to classify them as non classical. These features include a very limited polymorphism, more restricted tissue expression, modification of the gene structure in the cytoplasmic tail, and expression of alternative RNA variants that encode putative protein isoforms.
4.1- Gene structure
MHC class Ib gene structure is usually modified in the number of exons that code for the cytoplasmic tail. Class Ia genes harbour eight exons with the last three exons specifying the cytoplamsic tail whereas the class Ib genes have either seven or eight exons. In the pig, the three SLA-Ib genes were initially shown to harbour seven exons but recent evidence has indicated that SLA-6 presents seven exons while SLA-7 and SLA-8 present eight exons.
Figure VI: Comparative gene structure of SLA-Ia and Ib genes
In pig, class Ib genes were initially described with seven exons, the cytoplasmic tail being encoded by the last two exons instead of three exons for class Ia genes Exons are represented by grey ovals and introns by lines (Renard et al. 2006).
4.2- HLA class Ib
The HLA complex contains three expressed class Ib genes, HLA-E, -F and -G. The HLA-Ib molecules were found to be specifically expressed mostly at the foeto- maternal interface (Ishitani et al. 2003) during pregnancy and were further intensively studied for their role in the control and/or maintenance of immunotolerance of the foetus by the mother. More generally, these molecules are found expressed at immunotolerant sites (Moscoso et al. 2006a, Moscoso et al. 2006b) and seem to play an important role in the maintenance of solid tumours (Le Maoult et al. 2004).
4.2.1- HLA-E
The HLA-E gene comprises seven exons and the full transcript HLA-E 001 contains 7 exons
and encodes 358 amino acids as reported in the VEGA database
(http://vega.sanger.ac.uk/Homo_sapiens/Info/Index) (Fig. VII). Orthology between HLA-E and the mouse gene H2-QaI has been demonstrated (Joly and Rouillon 2006).
Figure VII: HLA-E transcripts and protein structure
Exons are represented by boxes and the colours correspond to the encoded protein domains. HLA-E protein structure is composed by all the parts necessary for cell surface expression.
RNAs are found in a wide range of tissues, as shown in Table II where the counts of HLA-E ESTs in different tissues are summarized, as provided by the NCBI EST Profile database (http://www.ncbi.nlm.nih.gov/UniGene). Although EST counts might not be a true indication of the protein activity, the expression patters in these 44 tissues could be a good indicator. HLA-E EST was detected in 43 tissues except in ear. The highest count of transcripts per million (TPM) of HLA-E was recorded in adipose tissue (2289) followed by tonsil (1941), spleen (1445) parathyroid (1363), lung (816) and blood (753). The level of HLA-E expression can be augmented upon stimulation with interferon gamma (Koller et al. 1988, Mizuno et al. 1988).
HLA-E associates with B2M, interacts with NK cell receptors, and binds the CD8 T cell receptors (Rodgers and Cook 2005). HLA-E molecules interact with both inhibitory (CD94/NKG2A heterodimers) (Lee et al. 1998) and activating (CD94/NKG2C heterodimers) NK cell receptors (Rodgers and Cook 2005). HLA-E is expressed on cell surface and presents peptides derived from the leader sequence of MHC class Ia (O'Callaghan et al. 1998) and G molecules. The acquisition of these peptides by HLA-E appears to be tightly controlled and dependent on the expression of other MHC class I molecules, which serve as a source of these peptides together with functioning antigen processing machinery (Sullivan C. A. et al. 2009). HLA-E was also shown to present peptides derived from pathogens like the cytomegalovirus, thus providing evidence for a role in bridging innate and adaptive immune responses (Sullivan L. C. et al. 2008).
HLA-E is expressed at the foeto-maternal interface (Moscoso et al. 2006a) and its expression varies in tumour cells compared to normal cells. For instance, HLA-E is more expressed in melanoma cells than melanocytes in which no or very low HLA-E molecules are detected on
the cell surface. HLA-E expression on the cell surface in melanoma cells decreased their susceptibility to cytolytic activity by T cells, confirming a tolerogenic function (Derre et al. 2006).
4.2.2- HLA-F
The HLA-F gene structure includes seven exons and the full length transcript HLA-F-001 encodes a protein of 346 aminoacids (Figure VIII). Five HLA-F RNA variants are reported in the VEGA database that partly correspond to truncated RNAs and spliced variants leading to modified HLA-F isoforms that are different from the full length protein. There is no exon 4 in the HLA-F-002 transcript, therefore it is predicted to encode an isoform that lacks an a3 domain.
A
B
Figure VIII: HLA-F transcripts (A) and predicted protein structures (B)
Six HLA-F transcripts have been annotated in the VEGA database (http://vega.sanger.ac.uk/Homo_sapiens/Info/Index). Exons are represented by rectangles the colour of which corresponds to the protein domains. Missing exons due to alternative transcription are represented by empty rectangles.
HLA-F is mostly expressed in lymphoid tissues such as spleen (352 TMP), lymph node (283 TMP), tonsil (235 TMP) and thymus (184 TMP) as inferred from the EST database (Table II). HLA-F transcripts are also found in many other tissues, which indicate that they are widely expressed like HLA-E transcripts, but with a lower abundance.
HLA-F molecules can associate with B2M but seem to act independently on peptide presentation. The encoded molecules are predominantly expressed inside the cells (Apps et al. 2008, Boyle et al. 2006, Wainwright et al. 2000). Peptide presentation by HLA-F molecules has not been reported, but the possibility has not ruled out (Rodgers and Cook 2005).
Table II: Expression patterns of HLA-Ib genes inferred from EST sources
Tissue # total EST # HLA-E EST TPM of HLA-E # HLA-F EST TPM of HLA-F # HLA-G EST TPM of HLA-G Adipose tissue 13105 30 2289 1 76 0 0 Adrenal gland 33195 15 451 3 90 0 0 Gscites 40013 7 174 1 24 0 0 Bladder 29757 8 268 2 67 0 0 Blood 123476 93 753 14 113 0 0 Bone 71655 33 460 5 69 0 0 Bone marrow 48798 11 225 1 20 0 0 Brain 1100969 214 194 22 19 2 1 Cervix 48171 14 290 3 62 0 0 Connective tissue 149254 46 308 7 46 0 0 Ear 16212 0 0 0 0 0 0 Embryonic tissue 215722 11 50 0 0 0 0 Esophagus 20208 10 494 3 148 0 0 Eye 211052 42 199 11 52 0 0 Heart 89625 34 379 3 33 0 0 Intestine 234477 119 507 24 102 8 34 Kidney 211769 65 306 13 61 0 0 Larynx 24144 7 289 0 0 0 0 Liver 207739 30 144 4 19 0 0 Lung 336969 275 816 41 121 1 2 Lymph 44269 26 587 1 22 0 0 Lymph node 91607 35 382 26 283 0 0 Mammary gland 153267 88 574 1 6 0 0
Tissue # total EST # HLA-E EST TPM of HLA-E # HLA-F EST TPM of HLA-F # HLA-G EST TPM of HLA-G Pancreas 214811 109 507 14 65 2 9 Parathyroid 20540 28 1363 0 0 0 0 Pharynx 41328 15 362 0 0 0 0 Pituitary gland 16584 3 180 2 120 0 0 Placenta 280828 91 324 0 0 18 64 Prostate 189352 37 195 0 0 0 0 Salivary gland 20155 6 297 0 0 0 0 Skin 210574 113 536 5 23 0 0 Spleen 53953 78 1445 19 352 0 0 Stomach 96622 58 600 11 113 1 10 Testis 330449 24 72 3 9 4 12 Thymus 81130 29 357 15 184 1 12 Thyroid 47472 22 463 2 42 0 0 Tonsil 16999 33 1941 4 235 0 0 Trachea 52412 4 76 1 19 0 0 Umbilical cord 13680 3 219 0 0 0 0 Uterus 232876 74 317 15 64 0 0
*TMP: transcript per million
4.2.3- HLA-G
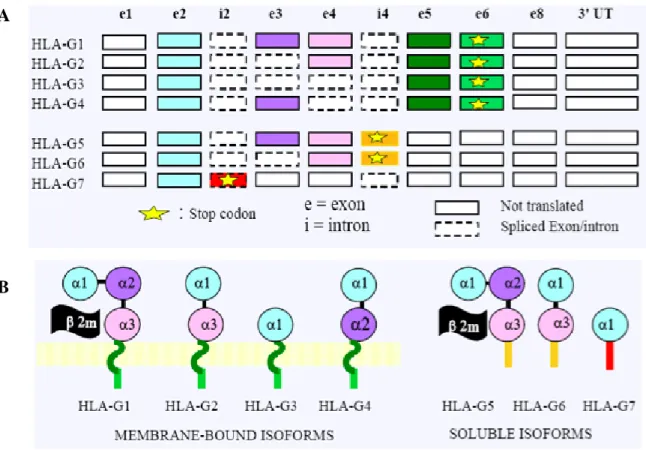
The HLA-G gene is reported with the most complex transcription pattern with a total of seven RNAs encoding seven protein isoforms (Figure IX). HLA-G encodes both membrane (HLA-G1 to G4) and soluble molecules (HLA-G5 to G7) which are generated by alternative RNA splicing (Carosella et al. 2003). HLA-G1 to G4 molecules are characterized by a short cytoplasmic tail encoded by exon 6. HLA-G2 lacks exon 3 that corresponds to the 2 domain; HLA-G3 lacks exons 3 and 4 and thus only has the 1 domain; HLA-G4 lacks exon 4 and hence the 3 domain. HLA-G5 and -G6 retain intron 4, which contains a stop codon that prevents the transcription of the transmembrane region and results in the expression of
soluble proteins. HLA-G7 retains intron 2 in which a stop codon results in the translation of a soluble protein that comprises only the 1 domain.
HLA-G is expressed in fetal extravillous trophoblast, adult thymic epithelial cells, cornea and nail matrix, meaning immune privileged sites (Ito et al. 2005, Le Discorde et al. 2003). As summarized in table II, among 44 tissues, HLA-G EST was only detected in 8 tissues (brain, lung, pancreas, stomach, testis, thymus, intestine, and placenta). HLA-G ESTs are specifically found in placenta (64 TPM) followed by intestine (34 TMP), thymus (12 TMP), testis (12 TMP) stomach (10 TMP) and pancreas (9 TMP). HLA-G is the most specifically expressed HLA-Ib gene with an abundance that is much lower than that of HLA-E and –F.
HLA-G inhibits cytolytic functions of NK cells and cytotoxic T lymphocytes and plays a key role in foeto-maternal tolerance during pregnancy (Hunt et al. 2007) and establishment of immune tolerance in tumorigenesis (Carosella et al. 2008).
A
B
Figure IX: Alternatively HLA-G transcripts and protein isoform structure
Seven HLA-G transcripts encoding four membrane-bound and three soluble protein isoforms are reported (Carosella et al. 2003). B. HLA-G protein isoform.
Refered to http://www.ensembl.org/
The inhibitory effects of HLA-G are mediated through direct binding to inhibitory receptors ILT2, ILT4 and KIR2DL4, which are differentially expressed by immune cells (NK and some CD8+ T cells) (Ponte et al. 1999, Rajagopalan and Long 1999). Both full length membrane bound (HLA-G1) and soluble (HLA-G5) forms have been shown to have immunoregulatory functions, including the inhibition of T cell activation and stimulation of decidual NK cells and macrophages to produce cytokines that are beneficial to implantation (Le Bouteiller 2003, Le Bouteiller et al. 2003). HLA-G expression has been observed in
various malignancies: melanoma, ovarian, lung, cervical, colon, breast cancer, renal cancer and glioblastomas (Davies et al. 2001). Tumour occurrence and maintenance are frequently associated with a loss of HLA class Ia expression or abnormal expression of HLA class Ib antigen. Such peculiar HLA class I expression would allow tumour cells to escape not only from CD8+T, but also from NK-cell cytotoxicity. The association between the tumour and HLA-G is that HLA-G generates inhibitory signals in various immune cells that represent a mechanism used by tumour cells to escape from immunosurveillance (Garrido et al. 1997, Rouas-Freiss et al. 2005). A global scheme of HLA-G interactions with immune cells with functional implications is summarized in Figure X (Carosella et al. 2003). Functional homologies have been reported between HLA-G and H2-Qa2 (Comiskey et al. 2003).
Figure X: HLA-G immune cell interaction
4.3- SLA class Ib
The three genes SLA-6, -7 and -8 are classified as class Ib genes due to their limited polymorphism and slight variations in the three prime end specific of the cytoplasmic tail compared to the SLA-1, -2 and -3 genes (Chardon et al. 2001). The SLA-7 and SLA-8 genes were found to have a greater resemblance in coding regions to each other than to the SLA-6 gene (Chardon et al. 2001). No orthology or functional homology has ever been established with HLA class-Ib genes and neither gene mapping nor sequence phylogeny is helpful in this case (Chardon et al. 2001, Crew et al. 2004, Lunney et al. 2009, Renard et al. 2006).
It has been reported that SLA-Ib genes are transcribed in a less restricted manner than HLA class Ib genes but the number and variety of tissues included in this unique study were limited (Crew et al. 2004). Initially, SLA-6 has been referred to as PD6 and its expression was shown to be mostly restricted to secondary lymphoid tissues such as spleen and lymph node (Ehrlich et al. 1987). Expressions of the SLA-6 and SLA-8 mRNA transcripts have been detected in a variety of tissues with very low levels in the brain. SLA-7 transcripts exhibited more limited tissue distribution with high levels in thymus, and none detected in the kidney, brain and peripheral blood mononuclear cells. SLA-8 expression was likewise ubiquitous except no transcripts were detected in brain. The highest levels were observed in thymus, but no transcripts were detected in kidney or PBMC, SLA-7 transcripts were barely perceptible in spleen and testes (Crew et al. 2004). Evidence suggested that the SLA-6 gene may undergo alternative splicing, similar to the non-classical HLA-Ib gene (Lunney et al. 2009).
Sequence alignments revealed that SLA class Ia and Ib promoter regions contain a series of conserved putative regulatory motifs located within distal and proximal promoter domains.
An interesting study was carried out in order to test the constitutive and inducible activity of SLA-Ia and Ib promoters (Tennant et al. 2007). The promoters of SLA-1, -2, -3, -6 and -7 were cloned upstream from the luciferase reporter gene and the recombinant expression vectors were transiently transfected into Max cells, immortalized pig cells, that respond to interferon and TNF-α. Both classical and non-classical promoters were constitutively active. By contrast to SLA-Ia promoters, SLA-7 and -6 promoters did not respond to interferon alpha or gamma. This was confirmed by the transactivation of SLA-1, but not SLA-7, after the co expression with interferon regulatory factors (IRFs), IRF-1, IRF-2, IRF-3, IRF-7, and IRF-9. The response of SLA-1 and SLA-7 to the pro-inflammatory cytokine TNF-α was also investigated. The TNF-α treatment resulted in a twofold induction of the SLA-1 promoter but a smaller induction for the SLA-7 promoter. These results suggest distinct regulatory systems for pig MHC class Ia and Ib genes, as seen in human MHC the authors conclude on the importance of regulation variations in antigen presentation during infection (Tennant et al. 2007).
The three SLA-Ib genes are predicted to encode membrane-anchored glycoproteins that could associate with B2M and bind peptides (Chardon et al. 2001), but these features have never been demonstrated.
4.4- Polymorphism
alleles, 46 SLA-2 alleles, and 26 SLA-3 alleles. The extreme polymorphisms of the SLA Ia genes are, as expected, concentrated in exon 2 and 3 of the coding regions. Polymorphisms also include copy number variations (CNVs). CNVs are reported for non classical genes in rat and cattle. One to four MHC class Ib genes have been identified in rat according to haplotypes (Lau et al. 2003) and four MHC class Ib genes have been characterized in cattle (Birch et al. 2008). As in swine, The HLA-E, -F, and -G genes exhibit very low levels of allelic polymorphism. These low levels of allelic polymorphism presumably reflect their respective specialized functions.
Table III: The comparison of polymorphism between class Ia and class Ib genes
Human Gene No Poly. Porcine Gene No Poly.
HLA-A 1381 SLA-1 44 HLA-B 1927 SLA-2 46 HLA-C 960 SLA-3 26 HLA-E 9 SLA-6 9 HLA-F 21 SLA-7 2 HLA-G 46 SLA-8 2
In swine, SLA-Ib polymorphisms are usually not studied in haplotype characterization. In table IV, scarce information on SLA-6 alleles and known SLA haplotypes are summarized.
Table IV: SLA-6 polymorphism and SLA haplotypes
Haplotype Breed Previous designation SLA-6 allele
1a.0 Large White H01 101
1b.0 Large White H28 ND
2 NIH, Sinclair, Hanford a, b, H10 w02sa01
3 NIH c, H59 103
4a.0 NIH, Duroc D, H04 102
4b.0 Yucatan X 104
4c.0 Meishan K 104
5 Yucatan W Null
6 Yucatan Y 03sy01
7 Yucatan Z 101
8 Westran None 01we01
9 Sinclair, Hanford A ND 10 Sinclair C ND 11 Sinclair D ND 12 Hanford E ND 13 Hanford, Duroc F, d2 ND 14 Large White H12 ND 15 Large White H34 ND 16 Clawn c1 ND 17 Clawn c2 ND 18 Meishan M 102 19 Meishan N 105 20 Meishan L 103 21 Commercial breeds H03 ND 25 Hampshire (LLC-PK1
porcine cell line) None ND
27 Duroc d1 ND
56 Korean native pig None w04jh01
59 Korean native pig None 102
5- Aim of the work
Intensive research is carried out on HLA-Ib genes but very limited information is still available in swine. HLA-Ib molecules interact with NK-cell receptors and are involved in immunomodulation, allergy, autoimmunity and embryonic development. They also bind to T cell receptors and bridge innate and adaptive immunity. Indeed, SLA-Ib genes are highly interesting candidate genes for immune-tolerance functions in swine and functional studies are highly desirable to tests such hypotheses. SLA-Ib molecules are predicted to have the ability to present peptides on cell surfaces, but the proteins have never been detected due to the lack of specific antibodies. Very scarce information is available on tissue specificity and the splicing transcript patterns need to be described in order to know whether various isoforms exist for a unique gene as reported for HLA-G. HLA-E, -F and -G molecules probably play distinct and complementary functions as likely expected for SLA-6, -7 and -8.
Our aim was to study SLA-Ib genes at the DNA, RNA and protein levels. The work was further divided into three major parts related to transcription studies, protein expression and polymorphism characterization. We have studied the transcription levels of the three genes SLA-6, -7 and -8 in a wide range of adult pig tissues and have described the splice variants of each gene. Monoclonal antibodies were produced by a private company and transfection experiments with recombinant vectors suitable for expression of full length proteins were designed to specifically detect the proteins. Polymorphim studies were carried out by amplification and further sequencing of the full length genes from upstream the promoter to downstream of the polyadenylation signal in order to characterize allelic variations within coding and regulatory sequences. For our research purpose, we used biological samples from two pig breeds, French Large White and MeLiM pigs. Large White pigs are highly selected
for production traits. MeLiM pigs are minipigs bred in the laboratory, which present a genetic susceptibility to melanomas.
Materials and Methods
1- Transcription studies
1.1- Animals and samples
Two pig breeds were included in our study, French Large White and Melanoma bearing LIbechov Minipigs (MeLiM) pigs. French Large White pigs correspond to commercial animals highly selected for meat production and quality and bred in an experimental farm unit. MeLiM animals belong to an inbred closed line selected for the spontaneous occurrence and regression of cutaneous melanomas (Horak et al. 1999, Vincent-Naulleau et al. 2004). These animals are maintained in our experimental facilities for biomedical research with the aims to identify the genetic factors that control the disease susceptibility and to decipher the mechanisms involved in the tumour regression. Adult tissues were sampled from two Large White and three MeLiM pigs. We have also used primary fibroblasts derived from a Large White pig that harbours the Hp1a.0 haplotype corresponding to the reference SLA haplotype in pig (Renard et al. 2006). Tissues were frozen in liquid nitrogen and stored at -80°C before RNA extraction.
1.2- RNA extraction
Total RNAs had been extracted by Steliana Kevorkian during her master degree in the laboratory before I arrived to the laboratory (Kevorkian, 2007). Various RNA extraction kits (Qiagen, France) were used according to tissue characteristics. The RNeasy Midi kit was
as pig fibroblasts. The RNeasy Fibrous Tissue kit was chosen for diaphragma, longissimus dorsi, heart (ventricule), nasal mucosa, and aorta. The RNeasy Lipid Tissue kit was used for back fat, skin and brain. RNA extractions were carried out following the manufacturer’s instructions. For all samples, residual genomic DNA was removed by on-column digestion of DNA with DNase I (DNase set and cleanup, Qiagen, France). RNA concentration was determined by Nanodrop quantification (Thermo Fisher Scientific Inc., USA). RNA quality was checked on an Agilent 2100 Bioanalyzer (Agilent Technologies, Germany). RNAs with a RIN score between 8 and 10 were used. The concentration of RNA stock solutions was adjusted at 1 µg/µl in water for storage at -80°C.
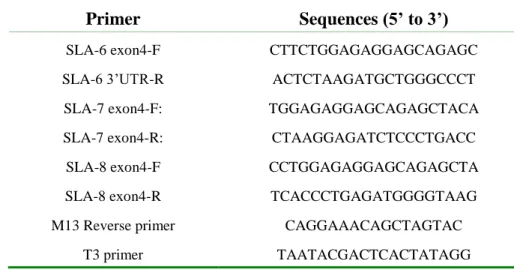
1.3- Primer design
All primers were designed using the Primer3 program available online at http://frodo.wi.mit.edu/primer3/. For the three SLA-Ib genes, primers targeting coding sequences were designed according to reference mRNA sequences (SLA-6: NM_001113704; SLA-7: NM_213768; SLA-8: NM_001113703) (Crew et al. 2004) and primers specific of the three prime untranslated regions (3’UTRs) were designed according to the sequence of the BAC clone that comprises the three SLA-Ib gene (AJ251914) (Chardon et al. 2001). Primers were designed in order to amplify either partial coding sequences from exon 4 to 3’UTRs or full coding sequences from exon 1 to 3’UTRs. For SLA-7, a primer set was also designed to amplify genomic DNA from intron 6 to 3’UTR in order to check that a splice variant was not due to a deletion in the corresponding genomic DNA. All primers were used matching the sequences from exon1 to 3’UTR. The gene