HAL Id: hal-03164462
https://hal.archives-ouvertes.fr/hal-03164462
Submitted on 9 Mar 2021
HAL is a multi-disciplinary open access
archive for the deposit and dissemination of
sci-entific research documents, whether they are
pub-lished or not. The documents may come from
teaching and research institutions in France or
abroad, or from public or private research centers.
L’archive ouverte pluridisciplinaire HAL, est
destinée au dépôt et à la diffusion de documents
scientifiques de niveau recherche, publiés ou non,
émanant des établissements d’enseignement et de
recherche français ou étrangers, des laboratoires
publics ou privés.
Tissue folding at the organ–meristem boundary results
in nuclear compression and chromatin compaction
Kateryna Fal, Niklas Korsbo, Juan Alonso-Serra, Jose Teles, Mengying Liu,
Yassin Refahi, Marie-Edith Chaboute, Henrik Jönsson, Olivier Hamant
To cite this version:
Kateryna Fal, Niklas Korsbo, Juan Alonso-Serra, Jose Teles, Mengying Liu, et al.. Tissue folding at
the organ–meristem boundary results in nuclear compression and chromatin compaction. Proceedings
of the National Academy of Sciences of the United States of America , National Academy of Sciences,
2021, 118 (8), pp.e2017859118. �10.1073/pnas.2017859118�. �hal-03164462�
Tissue folding at the organ
–meristem boundary results
in nuclear compression and chromatin compaction
Kateryna Fala,b,c,1, Niklas Korsbod,e,2, Juan Alonso-Serraa,2, Jose Telesd,2, Mengying Liua, Yassin Refahid,f, Marie-Edith Chaboutég, Henrik Jönssonb,d,e,1, and Olivier Hamanta,1
aLaboratoire de Reproduction et Développement des Plantes, Université de Lyon, Université Claude Bernard Lyon 1, ENS de Lyon, Institut National de
Recherche pour l’Agriculture, l’Alimentation et l’Environnement (INRAE), CNRS, 69364 Lyon Cedex 07, France;bDepartment of Astronomy and Theoretical
Physics, Lund University, SE22362 Lund, Sweden;cLaboratoire Physiologie Cellulaire & Végétale, Institut de Biosciences et de Biotechnologie de Grenoble,
Commissariat à l’Energie Atomique et aux Energies Alternatives–Grenoble, 38054 Grenoble cedex 9, France;dSainsbury Laboratory, University of
Cambridge, Cambridge CB2 1LR, United Kingdom;eDepartment of Applied Mathematics and Theoretical Physics, University of Cambridge, Cambridge,
United Kingdom;fUniversité de Reims Champagne Ardenne, INRAE, Fractionnement des Agro-Ressources et Environnement, UMR A 614, 51097 Reims,
France; andgInstitut de Biologie Moléculaire des Plantes, CNRS, Université de Strasbourg, 67084 Strasbourg Cedex, France
Edited by Neelima R. Sinha, University of California, Davis, CA, and accepted by Editorial Board Member June B. Nasrallah on January 12, 2021 (received for review August 29, 2020).
Artificial mechanical perturbations affect chromatin in animal cells in culture. Whether this is also relevant to growing tissues in living organisms remains debated. In plants, aerial organ emergence occurs through localized outgrowth at the periphery of the shoot apical meristem, which also contains a stem cell niche. Interest-ingly, organ outgrowth has been proposed to generate compres-sion in the saddle-shaped organ–meristem boundary domain. Yet whether such growth-induced mechanical stress affects chromatin in plant tissues is unknown. Here, by imaging the nuclear envelope in vivo over time and quantifying nucleus deformation, we dem-onstrate the presence of active nuclear compression in that do-main. We developed a quantitative pipeline amenable to identifying a subset of very deformed nuclei deep in the boundary and in which nuclei become gradually narrower and more elon-gated as the cell contracts transversely. In this domain, we find that the number of chromocenters is reduced, as shown by chro-matin staining and labeling, and that the expression of linker his-tone H1.3 is induced. As further evidence of the role of forces on chromatin changes, artificial compression with a MicroVice could induce the ectopic expression of H1.3 in the rest of the meristem. Furthermore, while the methylation status of chromatin was cor-related with nucleus deformation at the meristem boundary, such correlation was lost in theh1.3 mutant. Altogether, we reveal that organogenesis in plants generates compression that is able to have global effects on chromatin in individual cells.
nucleus
|
mechanical forces|
organogenesis|
chromatin|
plantF
orces act as instructive mechanical signals that affect all as-pects of cell and developmental biology (1, 2). Although much attention has been paid to the role of forces at the cell cortex, forces can also propagate to the nucleus and affect chromatin and gene expression (3–6). In turn, chromatin changes can also affect nucleus stiffness and shape (7). However, the impact of forces on nuclei has mainly been studied in single cell systems using artificial micromechanical manipulations, so far. Patterns of forces are naturally present in multicellular tissues. In particular, mechanical conflicts result from differential growth and tissue morphogenesis (e.g., refs. 8 and 9). In plants, because cells are encaged in a wall, cell movement is hindered; when tissues grow and change their shape, cells have to cope with the resulting mechanical stress without resolving to cell intercalation (nor cell death in young tissues). In Arabidopsis shoot apical meristems, tissue folding occurs at the boundary between organs and meristem. Finite element model simulations suggest that this domain experiences highly anisotropic tension in the circumfer-ential direction or radial compression (10). Radial contraction of the outer cell wall has been reported in that domain in previous studies and would be consistent with compression at the boundary (11). Here, we characterized the nuclear compressionat the organ boundary correlating with changes of chromatin organization and linker histone H1.3 activity.
Results
Nuclei Become Elongated as the Organ–Meristem Boundary Folds.
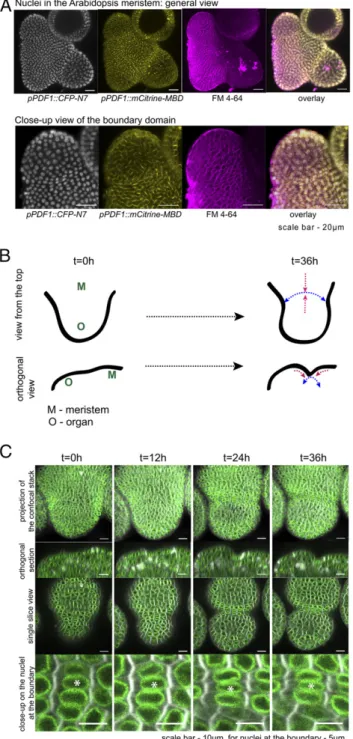
Using the pPDF1::CFP-N7 marker line, which marks nuclei (N7 nuclear localization signal) in the epidermis (PDF1 pro-moter), we observed that some nuclei at the boundary often display an elongated shape (Fig. 1A). These elongated nuclei appeared late in boundary formation, that is, when tissue folding is pronounced [i.e., beyond flower stage 2 (12)] and when major supracellular alignment of cortical microtubules is observed (Fig. 1A). When staining with FM4-64, we observed that these nuclei might be physically constrained by cell geometry (as the nuclear–cytoplasmic ratio is high in meristematic cells) (Fig. 1A), consistent with predicted compression in that domain (10, 13).
Because cell division follows the direction of maximal tension, cells at the boundary divide along one of their long axes (14). Therefore, cells appear more elongated in that domain. In principle, this may be sufficient to constrain nucleus shape. However, in that scenario, the presence of elongated nuclei
Significance
During development, growth deforms tissues and organs. This is notably the case during the formation of new flowers in plants, as the tissue folds during young floral bud emergence. Here, we provide further evidence that organogenesis com-presses the cells at the boundary, separating the organ from the stem cell niche, and we show that this leads to nucleus compression and chromatin changes. While mechanical forces are well known to affect nucleus shape and chromatin in mammalian cells in culture, this demonstrates that such an effect also occurs in a developing organism and suggests that forces may help to define boundary domains through large-scale chromatin effects.
Author contributions: K.F., H.J., and O.H. designed research; K.F., J.A.-S., M.L., and O.H. performed research; M.-E.C. contributed new reagents/analytic tools; K.F., N.K., J.T., Y.R., and H.J. analyzed data; and K.F., H.J., and O.H. wrote the paper.
The authors declare no competing interest.
This article is a PNAS Direct Submission. N.R.S. is a guest editor invited by the Editorial Board.
This open access article is distributed underCreative Commons
Attribution-NonCommercial-NoDerivatives License 4.0 (CC BY-NC-ND).
1To whom correspondence may be addressed. Email: kateryna.fal@cea.fr, Henrik.
Jonsson@slcu.cam.ac.uk, or olivier.hamant@ens-lyon.fr.
2N.K., J.A.-S., and J.T. contributed equally to this work.
This article contains supporting information online athttps://www.pnas.org/lookup/suppl/
doi:10.1073/pnas.2017859118/-/DCSupplemental. Published February 19, 2021. PLANT BIO LOGY BIOPHYSICS AND COMPUTATIONAL BIOLOGY
would not be the result of progressive compression emerging from neighboring tissue growth. To check whether organ growth can indeed actively compress nuclei at the boundary, we used the p35S::SUN1-YFP line (with SUN1 for SAD1/UNC-84 DOMAIN PROTEIN 1) that marks the nuclear envelope (15) and followed nuclear behavior in nondividing cells every 12 h. We could identify a population of nondividing cells that exhibit progressive nucleus deformation (Fig. 1B and C). The magnitude of nucleus deformation increased with tissue curvature, consistent with or-gan growth being the main cause for nuclear compression in these cells (Fig. 1B and C). In fact, we could mimic such nucleus deformation by mechanically compressing shoot apices laterally in a MicroVice with a force of ca. 0.1N (SI Appendix, Fig. S1). Altogether, this suggests that nuclear deformation in the boundary region is the result of compressive stresses caused by organ outgrowth.
To quantify these nuclear phenotypes, we used images obtained with thep35S::SUN1-YFP line and developed a com-putational pipeline to track cells and nuclei and quantify nuclear shapes (SI Appendix, Fig. S2). In brief, MorphoGraphX (16) was used to extract the meristem surface, and segment [two-dimensional (2D)] cells on which the curvature was mapped. In addition, three-dimensional (3D) cell segmentation of the epidermal layer followed by cell tracking was performed using multiangle image acquisition, three-dimensional reconstruction, and cell segmentation–automated lineage tracking (MARS/ALT, ref. 17). The nuclei were segmented in 3D using the MARS wa-tershed algorithm. Finally, meristem regions and nuclear shapes were extracted and quantified using MATLAB (The MathWorks, Inc.) scripts after projecting the nuclear signal in 2D.
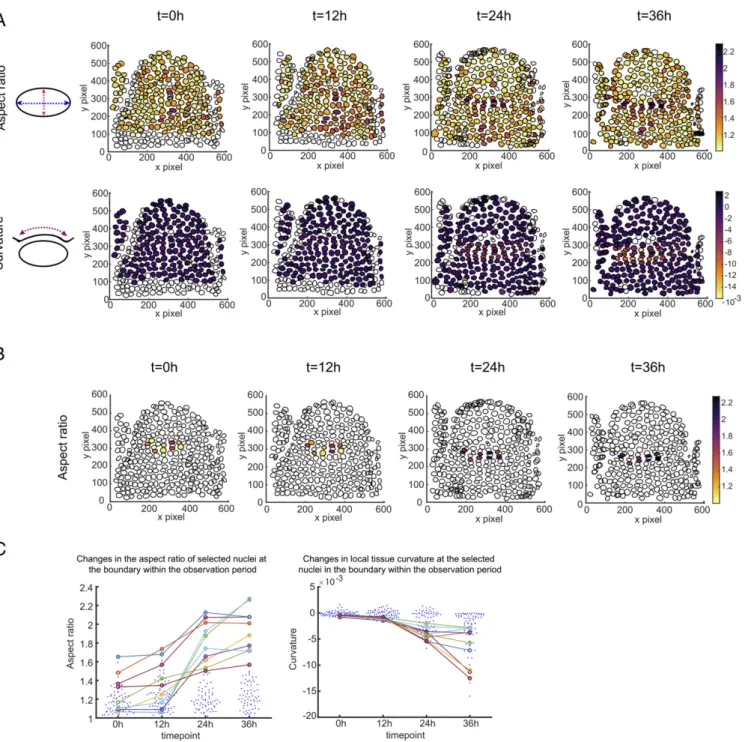
A subpopulation of nuclei at the boundary region exhibited a significant increase in their aspect ratio. In each boundary we could find a group of at least 10 nuclei with an aspect ratio su-perior to 1.55, whereas meristematic nuclei typically have an aspect ratio of 1.2± 0.15 (n = 132) (Fig. 2A andSI Appendix, Figs. S3 and S4). When backtracking these most affected nuclei via their cell lineages, we also found that they increased their aspect ratio following the increased growth of the primordia, correlating with the increased (negative) curvature of the boundary domain (Fig. 2B and C andSI Appendix, Figs. S3 and S4). Altogether, these quantifications demonstrate the existence of active nucleus compression operating at the meristem boundary during organogenesis and highlight the presence of a subset of boundary cells with increasing negative curvature in time, indicative of cellular compression.
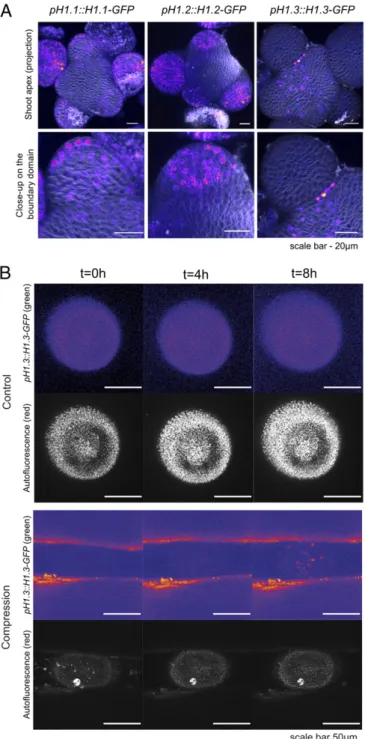
Linker Histone H1.3 Is Induced by Compression.The boundary do-main has a specific gene expression profile (18). This pattern relies on hormones, microRNA, and mechanical stress (19–21). Nucleus compression is likely to have a more global effect on chromatin than on specific gene expression, as shown in animal systems (5, 6, 22, 23). Furthermore, changes in global chromatin state have been associated with changes in chromatin compac-tion, which relies on linker histones (H1 isoforms). In plants, at least three isoforms of H1 have been studied. Their expression and competitive binding to DNA depend on cell cycle as well as on external stress factors. H1.3 has been associated with the cells response to abiotic stresses in past work (24). In particular, H1.3 is induced by drought stress (24) which, based on data from animals (e.g., refs. 25 and 26), might also drive nucleus com-paction. When analyzing the expression pattern of three variants of histone H1 in the meristem, we found that H1.1 and H1.2 were expressed in the entire meristem, with a higher expression level in organs. Interestingly, H1.3 exhibited a patchy pattern, with the strongest signal deep in meristem boundaries (Fig. 3A). To go beyond this correlation, we next applied compression on meristem to check whether H1.3 expression would be induced. To do so, we usedN-(1-naphthyl) phthalamic acid (NPA)-treated
Fig. 1. Nucleus compression at the organ–meristem boundary in Arabi-dopsis. (A) (Upper) The maximal projections of confocal stack images with representative dissected shoot apex containing the fluorescent reporters for nuclei (pPDF1::CFP-N7, shown in gray), microtubules (pPDF1::mCitrine-MBD, shown in yellow), and membranes stained with the FM4-64 (magenta). (Lower) The boundary domain of representative shoot apex, showing cropped organ and boundary region of the respective sample. (Scale bars, 20 μm.) (B). Diagram representing the top and orthogonal views of a meristem (M) with a growing organ (O). Organ growth laterally pulls (blue arrows) and radially compresses (red arrows) cells at the boundary. (C) Representative images of a growing organ at the shoot apex of p35S::SUN1-YFP reporter line, acquired at four time points within 36 h. (Upper) The top view pro-jections and the orthogonal sections of the respective stacks the growing organ and the boundary domain. (Bottom) Close-ups in the boundary region where the nuclei (marked with an asterisk) become more elongated fol-lowing the 36 h. Green: SUN1-YFP; gray: cell membranes stained with the FM4-64. (Scale bars, 10μm; for nuclei at the boundary, 5 μm.)
2 of 8 | PNAS Fal et al.
https://doi.org/10.1073/pnas.2017859118 Tissue folding at the organ–meristem boundary results in nuclear compression and
chromatin compaction
seedlings and placed the naked stems between two blades of the MicroVice (SI Appendix, Fig. S1Aand Materials and Methods). When the blades were touching the meristem without deforming it, no clear H1.3 expression could be detected in the meristem (Fig. 3B and seeSI Appendix, Fig. S5B) (n = 6/6 meristems with less than 3 nuclei exhibiting H1.3 induction at t= 8 h). However, when the meristem was deformed upon compression, most meristems expressed H1.3 ectopically (Fig. 3B andSI Appendix, Fig. S5B) (n = 10/11 meristems with more than 3 nuclei exhib-iting H1.3 induction at t= 8 h). Our finding suggests that cells at
the meristem boundary are experiencing high and long enough compressive stress to induce such expression.
Global Chromatin Changes Occur at the Organ–Meristem Boundary.
Our results suggest that nuclear compression, naturally occurring during organogenesis, generates iterative chromatin changes each time a new organ emerges. To further test this hypothesis, we investigated whether nucleus compression is strong enough to affect chromatin architecture. To do so, we used whole-mount fixed meristems and stained them with DAPI, which displays a
Fig. 2. Quantitative nucleus morphometry at the organ–meristem boundary. (A) Quantification of nuclear aspect ratio (Upper) and local tissue curvature (Lower) at the boundary region of a growing organ. The nuclear segmentation is performed on the confocal stack images of a representative organ at the meristem, acquired through the 36-h period. The spatial heatmap plots illustrate the convex hulls of each nucleus, filled with colors to represent the indicated data. The highest values of the nuclear aspect ratio (Upper) and the local tissue curvature (Lower) are shown in black; the lowest values of the nuclear aspect ratio the local tissue curvature in yellow. (B) Nuclei at the boundary domain with the highest aspect ratio changes within the acquisition period. (C) Plots illustrate the changes in aspect ratio (Left) and local tissue curvature (Right) of the selected nuclei, highlighted in B during the 36-h observation.
PLANT BIO LOGY BIOPHYSICS AND COMPUTATIONAL BIOLOGY
brighter signal in heterochromatin regions corresponding to chromocenters (e.g., ref. 27). We analyzed their distribution in successive optical sections (SI Appendix, Fig. S6A). To check whether nucleus compression affects the distribution of these
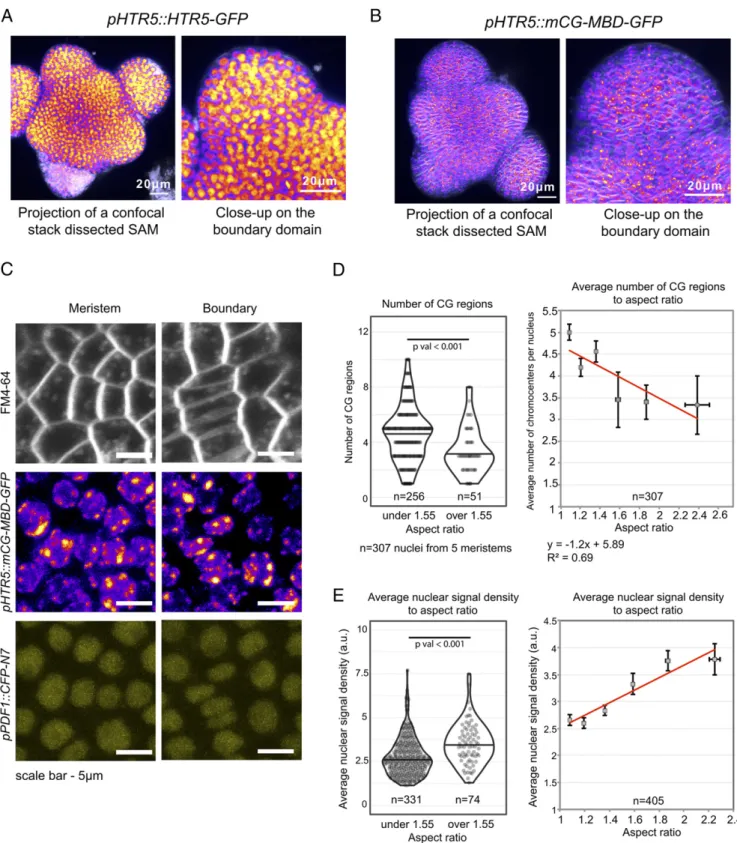
chromocenters, we compared nuclei with an aspect ratio superior or inferior to 1.55, which corresponds to the threshold identify-ing the significantly most deformed nuclei (cf. Fig. 2B). We ob-served that the number of chromocenters decreased in more compressed nuclei (SI Appendix, Fig. S6B)(P value = 8.2 × 10⁻¹⁰, two-tailed Student’s t test). To further confirm this result, we used a pHTR5::mCG-MBD-GFP line (methyl-CpG binding domain–green fluorescent protein) (28–30), which marks sym-metric DNA methylation in cytosine–guanine context (a marker of heterochromatin, Fig. 4A and B). Consistent with our pre-vious results on the DAPI stained meristems, we detected a decrease in the number of mCG (CG methylated regions) re-gions within the nuclei with the higher aspect ratio (Fig. 4C and D) (P value = 7.3 × 10⁻⁵, two-tailed Student’s t test). These re-sults indicate that nuclei compression at the organ boundary colocalizes with modifications of chromatin architecture.
In isolated human umbilical vein endothelial cells, the average nuclear signal density changes as a function of the nuclear shape and is higher in the most elongated nuclei (31). Therefore, we tested the correlation of the average nuclear signal density and the nuclear aspect ratio. Consistently with the reported data on human cells, we detected an increase in average nuclear signal density in the nuclei with the higher aspect ratio (Fig. 4E) (P value = 4.5× 10⁻⁸, two-tailed Student’s t test) (SI Appendix, Fig. S6C).
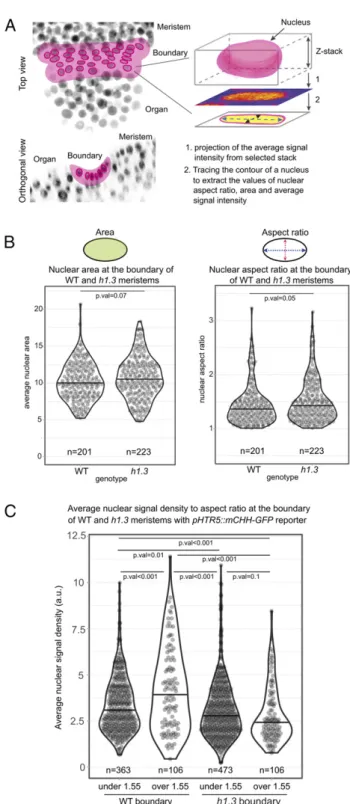
Last, to check whether the induction of H1.3 in deformed nuclei could be associated with such global chromatin changes, we analyzed the nuclei of theh1.3 mutant. The size and shapes of the h1.3 nuclei in the boundary domain were not significantly affected (Fig. 5A and B). Similarly, the number of chromocen-ters appeared comparable in wild type (WT) andh1.3 mutant at the boundary (SI Appendix, Fig. S7A). In line with previous an-alyzes of whole plant CHH DNA methylation (asymmetric DNA methylation, where H is any base except G) in h1.3 (24), we introgressed thepHTR5::mCHH-GFP reporter into h1.3 plants to further analyze the role of H1.3 in the nuclei at the organ boundary. We detected induction of the signal density (nor-malized signal of the CHH) in the WT nuclei with the aspect ratio above 1.55 but not in those ofh1.3 (Fig. 5C) (P valuewt=
1.35× 10⁻⁵; P valueh1.3 = 0.1, two-tailed Student’s t test) (SI
Appendix, Fig. S7 B and C), thereby suggesting that H1.3 is re-quired for DNA methylation changes at the organ boundary. Discussion
We show that organogenesis at the shoot apical meristem leads to nucleus compression in a specific set of cells, which is ac-companied by major chromatin changes. This demonstrates that forces have a strong and direct impact on nuclei in a tissue context. The role of forces on chromatin is now well established, notably through experiments with artificial deformations of sin-gle cells in culture (4–6). Our results not only show that such effects also occur in plants but they also demonstrate that these effects occur in the natural context of a developing organ. In fact, several reports have proposed that the main role of forces in the nucleus is to affect the physics of chromatin, which in turn would affect gene expression (instead of affecting specific genes that would then affect chromatin). For instance, nuclei have been found to exhibit an auxetic behavior because of the decom-paction of chromatin upon nucleus stretching (7). Our results are consistent with such conceptual framework and suggest that forces may primarily have global effects on chromatin, which would subsequently affect the expression of specific genes.
In previous work, we had already shown thatSTM and CUC3 are induced by mechanical stress at the organ–meristem boundary (20, 21). However, both of these genes are induced in shallow boundaries (i.e., before we can detect significant nucleus deformation). We thus believe that nucleus deformation may contribute to their expression, but it is unlikely that we would find a clear-cut contribution of nucleus deformation on the
Fig. 3. Expression of linker histones at the shoot apical meristem. (A) Maximal projections of the confocal stacks, showing the expression patterns of the linker histone reporter lines for H1.1, H1.2, and H1.3 at the shoot apex (Upper) and a close-up in the organ boundary area (Lower). (Scale bar, 20μm.) (B). Representative naked meristems from in vitro NPA-grown pH1.3::H1.3-GFP seedlings, as viewed from the top, with or without lateral compression with a MicroVice. t= 0 h is the timepoint when the meristem is placed between the blades of the MicroVice with (Bottom) or without (Top) compression. Note that the blades of the MicroVice appear partly fluorescent in the green channel, while a debris can be spotted on top of the meristem in the autofluorescence channel (Bottom). The ImageJ Fire lookup table was used to show the gradient in signal intensity in the green channel. (Scale bar, 50μm.)
4 of 8 | PNAS Fal et al.
https://doi.org/10.1073/pnas.2017859118 Tissue folding at the organ–meristem boundary results in nuclear compression and
chromatin compaction
Fig. 4. Chromatin changes in compressed nuclei at the organ–meristem boundary. (A and B) Maximal projection of the confocal stacks showing the ex-pression of the pHTR5::HTR5-GFP (A) and pHTR5::mCG-MBD-GFP (B) reporter lines with the global top view (Left) and close-up in the organ boundary area (Right). (Scale bar, 20μm.) (C) Representative pHTR5::mCG-MBD-GFP and pPDF1::CFP-N7 patterns in organ and meristem domains. (Scale bar, 5 μm.) (D) Number of mCG regions in the nuclei correlates negatively with nuclear aspect ratio. (Left) Violin plots illustrating the distributions of mCG regions in the nuclei with the aspect ratio below 1.55 (n= 256) and above 1.55 (n = 51). The black line in the violin plot represents the median, and the dots are the values of individual samples; P value<0.05 (P value = 7.3 × 10⁻⁵, n= 5 meristems). (Right) A plot of the average number of mCG regions in the nuclei as a function of
nuclear aspect ratio. The error bars represent the SEM, where 9≤ n ≤ 93. (E) (Left) The violin plot of average nuclear signal density in the nuclei with the aspect ratio below 1.55 (n= 331) and above 1.55 (n = 74). The black line in the violin plot represents the median, the dots are the values of individual samples; P value<0.05 (P value = 4.5 × 10⁻⁸, n= 6 meristems). (Right) A plot of average nuclear signal density in the nuclei in correlation with the nuclear aspect ratio.
The error bars represent the SEM, where 19≤ n ≤ 133.
PLANT BIO LOGY BIOPHYSICS AND COMPUTATIONAL BIOLOGY
expression of these genes since they are already highly expressed when nuclei become more deformed. Instead, the analysis of chromatin status appears more convincing and also better fits with the idea that mechanical stress would have a more global role on the structural component of the nucleus (i.e., nucleoskeleton and chromatin, rather than an instructive role on specific genes). These data are important as they establish a link between growth-derived patterns of compression in tissue to nucleus shape and chromatin status.
Further studies would be required to elucidate the structural role of histones in response to growth-derived forces in plants. Here, we reveal the induction of linker histone H1.3 at the organ–meristem boundary. One may speculate whether H1.3 expression could scale with mechanical stress intensity in dif-ferent tissues. Interestingly, H1.3 expression has never been detected in the female megaspore mother cell (i.e., in one of the most mechanically protected cells, arguably) (32). Yet, we could not detect major phenotypic defects in the H1.3 mutant meri-stem; at least in control growth conditions (SI Appendix, Fig. S8). The situation might actually be more complex. Many cross-talks between linker histones have been identified (33) and, unsur-prisingly, chromatin changes are associated with many pathways, from drought (26) to light (34). Integrating the contribution of mechanical forces in this network is thus likely going to be a long endeavor, but also an exciting one. In particular, this may compel us to see the structural side of chromatin and analyze the role of the relevant regulators with this lens, also echoing results obtained in animal cells in culture (e.g., ref. 35).
This work also opens the path to the investigation of the mechanisms leading to such nucleus compression and chromatin compaction. For instance, nuclei may be simply squeezed by pressure, meaning that nuclear density would increase, resulting in chromatin changes. Interestingly, hyperosmotic stress leads to nucleus deformation and chromatin changes in animal cells in culture as well as in isolated nuclei (36). The behavior of nuclei in the cells at the organ–meristem boundary may recapitulate such effects, albeit with mechanically driven, instead of osmoti-cally driven, nucleus deformation and in a growing tissue context. The role of the nuclear envelope is also likely to be important in that pathway (e.g., refs. 37, 38). In particular, chromatin orga-nization depends on proteins from the Linker of Nucleoskeleton to Cytoskeleton complex in plants (39).
In mammalian cells, stretching was recently proposed to soften chromatin through a reduction in heterochromatin formation, thereby insulating the genetic material from cellular and supra-cellular mechanical stress (40). Interestingly, nuclei become stiffer in plant cells through heterochromatin clustering when exposed to hyperosmotic stress (i.e., when tensile stress level at the cell cortex decreases) (41). This could suggest that cortical tension might positively correlate with softer nuclei across kingdoms. Whether this applies to our system remains an open question. The observed reduction in the number of chromo-centers at the meristem boundary, both via DAPI staining and mCG-MBD-GFP signal quantification, echoes the behavior of human stem cells placed on stiff environment (42). In our sys-tem, such reorganization of chromatin may involve a decrease in individual heterochromatin clusters as well as the spreading of
Fig. 5. Chromatin changes in compressed nuclei at the organ–meristem boundary in h1.3 mutant. (A) Cartoon drawing illustrating the approach, used for measuring the average nuclear signal density and aspect ratio at the boundary region of a dissected meristem. (Left) shows the top and side views of the region between the shoot apical meristem and a young organ; the L1 layer at the boundary region is shaded in pink with the contours of the nuclei traced. The Right represents a single nucleus, selected within the target region. The average fluorescence signal is projected from the portion of the z-stack corresponding to the thickness of the cell layer. This data was subsequently used to extract the values of nuclear aspect ratio and average nuclear signal density. (B) Plots illustrating the areas (Left) and aspect ratios (Right) of the nuclei at the organ boundary regions in WT and h1.3 mutant plants containing the p35S::SUN1-YFP reporter. Sample size for WT: nWT=
201 nuclei from 5 meristems; nh1.3= 223 nuclei from 5 meristems. P
val-uearea= 0.07 and P valueasp.ratio= 0.05. The black line in the violin plots
represents the median; the dots are the values of individual samples. (C) Violin plot illustrating the average nuclear signal density in the WT and h1.3 nuclei with the aspect ratio below 1.55 (nWT= 363 and nh1.3= 473 in 10
meristems for both genotypes) and above 1.55 (nWT= 106 and nh1.3= 106 in
10 meristems for both genotypes). The black line in the violin plots repre-sents the median; the dots are the values of individual samples. Higher av-erage signal density is detected in the nuclei of the WT with the aspect ratio above 1.55 (P value= 1.35 × 10⁻⁵), compared to below 1.55, a trend not seen
in the h1.3 mutant (P value= 0.1).
6 of 8 | PNAS Fal et al.
https://doi.org/10.1073/pnas.2017859118 Tissue folding at the organ–meristem boundary results in nuclear compression and
chromatin compaction
more transient CHH methylation. The accumulation of H1.3 histones would compete with other linker histones (24), but it remains to be shown whether this would also affect nuclear stiffness ultimately.
From a developmental point of view, our work adds another layer of complexity to the definition of the boundary domain in plant shoot apices (19). Beyond morphology (13), hormone sig-natures (43), gene expression (18), microRNA regulation (44), and stress pattern (10), boundary domains may indeed be also defined by nucleus compression and associated chromatin changes. This likely contributes to its cadastral role and may be conserved beyond the plant kingdom.
Materials and Methods
Plant Materials and Growth Conditions. All procedures were performed on plants from the Col-0 ecotype, grown in“long day” conditions, with16 h/8 h light/dark period at 21 °C. The pPDF1::CFP-N7 (20), pPDF1::mCitrine-MBD (45), p35S::SUN1-YFP (15), pH1.1::H1.1-EGFP, pH1.2::H1.2-EGFP (32), pH1.3::H1.3-EGFP (24), pHTR5::HTR5-GFP (46), pHTR5::mCG-MBD-GFP, and pHTR5::mCHH-GFP (30) reporter lines were used for this study.
Meristem Dissection. Stems were cut when the shoot apical meristem switched to an inflorescence meristem identity, that is, between the appearance of the first flower to the appearance of the first silique [stages 13 through 17 (12)] and transferred on a half Murashige and Skoog medium with vitamins and 0.125μg/μL of 6-benzylaminopurine for imaging, as described in ref. 11. Young floral buds were dissected out to access the shoot apical meristem. Meristem Compression. p35S::SUN1-YFP and pH1.3::H1.3-GFP lines were grown in vitro on a medium containing 10μM NPA (Sigma) as described in ref. 47. As soon as naked inflorescences had formed, the plants were transferred to medium without inhibitor. Within 48 h, plants were placed in a MicroVice (SI Appendix, Fig. S1A). The two blades of the MicroVice were brought closer so as to induce a strong deformation of the shoot apex. Images were acquired with an upright Leica SP8 or Zeiss LSM700 laser scanning confocal microscope, as described below (n> 5).
DAPI Staining of the Whole-Mount Meristems. Prior to staining, the dissected shoot apices were fixed 10 min on ice and then under vacuum (3 times for 20 min at room temperature) in a fixing solution containing phosphate-buffered saline (PBS) 1×, ethylene glycol-bis(β-aminoethyl ether)-N,N,N′,N ′-tetraacetic acid 0.5M, dimethyl sulfoxide 10% formaldehyde 4%. The samples were then dehydrated in ethanol-methanol series as follows: 1× ethanol 70% for 5 min, 1× ethanol 100% for 5 min, 2× methanol 100% for 5 min, 2× ethanol 100% for 5 min, and incubated overnight in ethanol 100% at 4 °C. Rehydration was performed as follows: 1× ethanol 100% for 5 min, 1× ethanol 70% for 5 min in PBSt (1% Tween20 in PBS), 1× ethanol 50% for 5 min in PBSt, 1× ethanol 30% for 5 min in PBSt, and 3× PBSt for 5 min. Then, the samples were incubated for 30 min at 37 °C with the mix of cell wall digesting enzymes (48) and RNase A (0.1 mg/mL) and refixed in 4% form-aldehyde in PBS. After washing with PBS buffer, the samples were incubated with the DAPI solution (5μg/mL). The mounting of the samples was per-formed as described in (48).
Confocal Laser Scanning Microscopy and Image Analysis. Dissected shoot apical meristems from greenhouse plants or naked meristems from in vitro-grown NPA-treated seedlings were imaged with a water-dipping lens (×25, nu-merical aperture= 0.8) using an upright SP8 confocal microscope to gen-erate a stack of optical sections with an interval of 0.15μm between slices. The membranes were stained with FM4-64 [also called N-(3-triethylammo-niumpropyl)-4-(6-(4-(diethylamino) phenyl) hexatrienyl) pyridinium dibro-mide, ThermoFisher]. Images are presented using the Fire lookup table (ImageJ). Image analysis for chromocenter and CG-methylated regions de-tection was performed using the 3D object counter option in Fiji software (https://fiji.sc/wiki/index.php/Fiji). The nuclear average signal density was calculated following along the line of the protocol, described in ref. 31. In this case, the mean signal values were normalized to the maximal projected area of the corresponding nuclei and then correlated with their aspect ratio.
Statistical analysis was performed using either Microsoft Excel or R software. The two-tailed Student’s test was performed to compare the means of in-dependent biological sample groups.
Computational Methods.
Segmentation. Surface extraction, 2D cell segmentation, and Gaussian cur-vature quantification were performed for the membrane channel (FM4-64) of the confocal stack images, using the LSM package following a published protocol [http://forge.cbp.ens-lyon.fr/redmine/projects/lsm3d(49)] in Mor-phoGraphX software [https://www.mpipz.mpg.de/MorphoGraphX(16)].
For 3D segmentation of the epidermal layer of cells and corresponding nuclei, an in-house script using the MARS/ALT algorithms was developed (50). The confocal images were processed by cropping and applying Gauss-ian smoothing and alternating sequential filter. The resulting images were segmented using a watershed algorithm with automatic seeding (50, 17). The segmentation was done for both the membrane channel (FM4-64) and the nuclear marker channel (p35S::SUN1-YFP) of each image. Computed seeds from the membrane channels were used also for the segmentation of the nuclei signal. Cells of the epidermal cell layer were extracted by identifying cells neighboring the image background (the region outside the tissue), which itself was defined as the largest segmented region of the image (17).
Cell labels resulting from the two [MorphoGraphX (16) and MARS] seg-mentations were aligned by importing the MARS segmented stack into MorphoGraphX and applying the manual label transfer followed by appli-cation of the Lineage Tracking function.
Cell lineage tracking. To compute cell lineages, affine transformation and, subsequently, nonlinear transformation were computed to register consec-utive confocal images of the membrane-marked channel using the Block-matching framework (50, 51). To compute cell lineages, the computed nonlinear transformation was applied to the corresponding segmented images and optimal cell pairings between registered segmented image and reference segmented image were computed by identifying maximally overlapping cell labels from the two images.
Tissue region extraction. The analysis was performed on epidermal nuclei that were all classified as belonging to the meristem, the organ, or the boundary region in between. The classification was based on the quantified surface curvature of the cells, where the boundary region was defined by cells having negative curvature, as in ref. 52. The rest of the nuclei were classified as meristem or organ depending on which side they were found of a fitted curve along the boundary (SI Appendix, Fig. S2A).
Cell and nuclei size and shape quantification. For each segmented object (cell or nucleus), the z-slice with the largest area was extracted for further analysis. The aspect ratio was calculated as the length of the main axis divided by the length of the minor axis of the ellipse representing the covariance matrix of the pixel positions for the region. All properties were extracted using the MATLAB function regionprops.
Software/protocol. Scripts required to do the segmentation and quantitative analysis are provided via the Sainsbury Laboratory GitLab repository (https:// gitlab.com/slcu/teamhj/publications/fal_et_al_2021), where also a more de-tailed protocol for executing the steps of the pipeline is provided. All scripts have been developed in Python (https://python.org) and MATLAB (Math-Works Inc.), and the protocol is dependent on the MorphoGraphX [https:// www.mpipz.mpg.de/MorphoGraphX(16)] and MARS/ALT (50) software. Data Availability. Original confocal data are available via the University of Cambridge Data Repository (https://doi.org/10.17863/CAM.64310). Scripts for the analysis pipeline are available via the Sainsbury Laboratory GitLab repository (https://gitlab.com/slcu/teamHJ/publications/fal_etal_2020). ACKNOWLEDGMENTS. We thank Célia Baroux, Fred Berger, Katja Grau-mann, and Daniel Grimanelli for providing material used in this article. We are grateful to Grégoire Malandain for the use of Block-matching software. We thank Platim for help with imaging. We also thank Adrienne Roeder for insightful suggestions on this manuscript. This work was supported by the European Research Council (Grant ERC-2013-CoG-615739“MechanoDevo”), Human Frontier Science Program Grant RGP0009/2018, the Schlumberger Foundation for Education and Research, CNRS (mécanobiologie“NEstress”), and the Gatsby Charitable Foundation (Grant GAT3395-PR4B).
1. D. W. Thompson, On Growth and Form (Cambridge University Press, 1917). 2. T. Lecuit, P.-F. Lenne, E. Munro, Force generation, transmission, and integration
during cell and tissue morphogenesis. Annu. Rev. Cell Dev. Biol. 27, 157–184
(2011).
3. B. Hampoelz, T. Lecuit, Nuclear mechanics in differentiation and development. Curr.
Opin. Cell Biol. 23, 668–675 (2011).
4. P. Isermann, J. Lammerding, Nuclear mechanics and mechanotransduction in health and disease. Curr. Biol. 23, R1113–R1121 (2013).
PLANT BIO LOGY BIOPHYSICS AND COMPUTATIONAL BIOLOGY
5. H. Q. Le et al., Mechanical regulation of transcription controls Polycomb-mediated gene silencing during lineage commitment. Nat. Cell Biol. 18, 864–875 (2016). 6. A. Tajik et al., Transcription upregulation via force-induced direct stretching of
chromatin. Nat. Mater. 15, 1287–1296 (2016).
7. S. Pagliara et al., Auxetic nuclei in embryonic stem cells exiting pluripotency. Nat.
Mater. 13, 638–644 (2014).
8. B. Aigouy et al., Cell flow reorients the axis of planar polarity in the wing epithelium of Drosophila. Cell 142, 773–786 (2010).
9. N. Hervieux et al., A mechanical feedback restricts sepal growth and shape in Ara-bidopsis. Curr. Biol. 26, 1019–1028 (2016).
10. O. Hamant et al., Developmental patterning by mechanical signals in Arabidopsis. Science 322, 1650–1655 (2008).
11. A. Burian et al., A correlative microscopy approach relates microtubule behaviour, local organ geometry, and cell growth at the Arabidopsis shoot apical meristem. J. Exp. Bot. 64, 5753–5767 (2013).
12. D. R. Smyth, J. L. Bowman, E. M. Meyerowitz, Early flower development in Arabi-dopsis. Plant Cell 2, 755–767 (1990).
13. D. Kwiatkowska, J. Dumais, Growth and morphogenesis at the vegetative shoot apex of Anagallis arvensis L. J. Exp. Bot. 54, 1585–1595 (2003).
14. M. Louveaux, J.-D. Julien, V. Mirabet, A. Boudaoud, O. Hamant, Cell division plane orientation based on tensile stress in Arabidopsis thaliana. Proc. Natl. Acad. Sci. U.S.A. 113, E4294–E4303 (2016).
15. K. Graumann, J. Runions, D. E. Evans, Characterization of SUN-domain proteins at the higher plant nuclear envelope. Plant J. 61, 134–144 (2010).
16. P. Barbier de Reuille et al., MorphoGraphX: A platform for quantifying morpho-genesis in 4D. eLife 4, 05864 (2015).
17. L. Willis et al., Cell size and growth regulation in the Arabidopsis thaliana apical stem
cell niche. Proc. Natl. Acad. Sci. U.S.A. 113, E8238–E8246 (2016).
18. C. Tian et al., An organ boundary-enriched gene regulatory network uncovers reg-ulatory hierarchies underlying axillary meristem initiation. Mol. Syst. Biol. 10, 755 (2014).
19. M. Aida, M. Tasaka, Genetic control of shoot organ boundaries. Curr. Opin. Plant Biol. 9, 72–77 (2006).
20. B. Landrein et al., Mechanical stress contributes to the expression of the STM ho-meobox gene in Arabidopsis shoot meristems. eLife 4, e07811 (2015).
21. K. Fal, B. Landrein, O. Hamant, Interplay between miRNA regulation and mechanical stress for CUC gene expression at the shoot apical meristem. Plant Signal. Behav. 11, e1127497 (2015).
22. Y. A. Miroshnikova, M. M. Nava, S. A. Wickström, Emerging roles of mechanical forces in chromatin regulation. J. Cell Sci. 130, 2243–2250 (2017).
23. E. A. Booth-Gauthier, T. A. Alcoser, G. Yang, K. N. Dahl, Force-induced changes in subnuclear movement and rheology. Biophys. J. 103, 2423–2431 (2012).
24. K. Rutowicz et al., A specialized histone H1 variant is required for adaptive responses to complex abiotic stress and related DNA methylation in Arabidopsis. Plant Physiol. 169, 2080–2101 (2015).
25. R. Ascenzi, J. S. Gantt, Molecular genetic analysis of the drought-inducible linker histone variant in Arabidopsis thaliana. Plant Mol. Biol. 41, 159–169 (1999). 26. R. Ascenzi, J. S. Gantt, A drought-stress-inducible histone gene in Arabidopsis thaliana
is a member of a distinct class of plant linker histone variants. Plant Mol. Biol. 34,
629–641 (1997).
27. F. Tessadori et al., Large-scale dissociation and sequential reassembly of pericentric
heterochromatin in dedifferentiated Arabidopsis cells. J. Cell Sci. 120, 1200–1208
(2007).
28. T. H. Bestor, The DNA methyltransferases of mammals. Hum. Mol. Genet. 9, 2395–2402 (2000).
29. A. Bird, DNA methylation patterns and epigenetic memory. Genes Dev. 16, 6–21 (2002).
30. M. Ingouff et al., Live-cell analysis of DNA methylation during sexual reproduction in Arabidopsis reveals context and sex-specific dynamics controlled by noncanonical
RdDM. Genes Dev. 31, 72–83 (2017).
31. M. Versaevel, T. Grevesse, S. Gabriele, Spatial coordination between cell and nuclear shape within micropatterned endothelial cells. Nat. Commun. 3, 671 (2012). 32. W. She et al., Chromatin reprogramming during the somatic-to-reproductive cell fate
transition in plants. Development 140, 4008–4019 (2013).
33. K. Rutowicz et al., Linker histones are fine-scale chromatin architects modulating developmental decisions in Arabidopsis. Genome Biol. 20, 157 (2019).
34. C. Bourbousse, F. Barneche, C. Laloi, Plant chromatin catches the sun. Front. Plant Sci. 10, 1728 (2020).
35. K. Damodaran et al., Compressive force induces reversible chromatin condensation and cell geometry-dependent transcriptional response. Mol. Biol. Cell 29, 3039–3051 (2018).
36. J. D. Finan, F. Guilak, The effects of osmotic stress on the structure and function of the cell nucleus. J. Cell. Biochem. 109, 460–467 (2010).
37. C. Guilluy et al., Isolated nuclei adapt to force and reveal a mechanotransduction pathway in the nucleus. Nat. Cell Biol. 16, 376–381 (2014).
38. J. Swift et al., Nuclear lamin-A scales with tissue stiffness and enhances matrix-directed differentiation. Science 341, 1240104 (2013).
39. A. Poulet et al., The LINC complex contributes to heterochromatin organisation and transcriptional gene silencing in plants. J. Cell Sci. 130, 590–601 (2017).
40. M. M. Nava et al., Heterochromatin-driven nuclear softening protects the genome
against mechanical stress-induced damage. Cell 181, 800–817.e22 (2020).
41. R. Goswami et al., Mechanical shielding in plant nuclei. Curr. Biol. 30, 2013–2025.e3
(2020).
42. A. R. Killaars et al., Extended exposure to stiff microenvironments leads to persistent chromatin remodeling in human mesenchymal stem cells. Adv. Sci. (Weinh.) 6, 1801483 (2018).
43. G. Brunoud et al., A novel sensor to map auxin response and distribution at high spatio-temporal resolution. Nature 482, 103–106 (2012).
44. P. Sieber, F. Wellmer, J. Gheyselinck, J. L. Riechmann, E. M. Meyerowitz, Redundancy and specialization among plant microRNAs: Role of the MIR164 family in develop-mental robustness. Development 134, 1051–1060 (2007).
45. A. Armezzani et al., Transcriptional induction of cell wall remodelling genes is cou-pled to microtubule-driven growth isotropy at the shoot apex in Arabidopsis. De-velopment 145, dev162255 (2018).
46. H. Wollmann et al., Dynamic deposition of histone variant H3.3 accompanies devel-opmental remodeling of the Arabidopsis transcriptome. PLoS Genet. 8, e1002658 (2012).
47. O. Hamant, P. Das, A. Burian, Time-lapse imaging of developing meristems using confocal laser scanning microscope. Methods Mol. Biol. 1080, 111–119 (2014). 48. F. Rozier, V. Mirabet, T. Vernoux, P. Das, Analysis of 3D gene expression patterns in
plants using whole-mount RNA in situ hybridization. Nat. Protoc. 9, 2464–2475 (2014). 49. A. Kiss et al., Segmentation of 3D images of plant tissues at multiple scales using the
level set method. Plant Methods 13, 114 (2017).
50. R. Fernandez et al., Imaging plant growth in 4D: Robust tissue reconstruction and
lineaging at cell resolution. Nat. Methods 7, 547–553 (2010).
51. G. Michelin et al., Spatio-temporal registration of 3D microscopy image sequences of Arabidopsis floral meristems. https://hal.inria.fr/hal-01606687v2/document. Accessed 11 February 2021.
52. T. Stanislas et al., A phosphoinositide map at the shoot apical meristem in Arabidopsis thaliana. BMC Biol. 16, 20 (2018).
8 of 8 | PNAS Fal et al.
https://doi.org/10.1073/pnas.2017859118 Tissue folding at the organ–meristem boundary results in nuclear compression and
chromatin compaction