HAL Id: hal-01582732
https://hal.archives-ouvertes.fr/hal-01582732
Submitted on 3 May 2018
HAL is a multi-disciplinary open access
archive for the deposit and dissemination of
sci-entific research documents, whether they are
pub-lished or not. The documents may come from
teaching and research institutions in France or
abroad, or from public or private research centers.
L’archive ouverte pluridisciplinaire HAL, est
destinée au dépôt et à la diffusion de documents
scientifiques de niveau recherche, publiés ou non,
émanant des établissements d’enseignement et de
recherche français ou étrangers, des laboratoires
publics ou privés.
Obscured Active Galactic Nuclei triggered in compact
star-forming galaxies
Yu-Yen Chang, Emeric Le Floc’H, Stéphanie Juneau, Elisabete da Cunha,
Mara Salvato, Francesca Civano, Stefano Marchesi, J.M. Gabor, Olivier
Ilbert, Clotilde Laigle, et al.
To cite this version:
Yu-Yen Chang, Emeric Le Floc’H, Stéphanie Juneau, Elisabete da Cunha, Mara Salvato, et al..
Ob-scured Active Galactic Nuclei triggered in compact star-forming galaxies. Mon.Not.Roy.Astron.Soc.,
2017, 466, �10.1093/mnrasl/slw247�. �hal-01582732�
Obscured Active Galactic Nuclei triggered in compact
star-forming galaxies
Yu-Yen Chang,
1?Emeric Le Floc’h,
1St´
ephanie Juneau,
1Elisabete da Cunha,
2Mara Salvato,
3Francesca Civano,
4,5Stefano Marchesi,
4,5,6J. M. Gabor,
1Olivier Ilbert,
7Clotilde Laigle,
8H. J. McCracken,
8Bau-Ching Hsieh,
9Peter Capak
10,111CEA Saclay, DSM/Irfu/Service d’Astrophysique, Orme des Merisiers, F-91191 Gif-sur-Yvette Cedex, France 2The Australian National University, Mt Stromlo Observatory, Cotter Rd, Weston Creek, ACT 2611, Australia 3Max Planck Institut f¨ur Plasma Physik and Excellence Cluster, 85748 Garching, Germany
4Harvard-Smithsonian Center for Astrophysics, 60 Garden Street, Cambridge, MA 02138, USA 5Yale Center for Astronomy and Astrophysics, 260 Whitney Avenue, New Haven, CT 06520, USA 6Dipartimento di Fisica e Astronomia, Universit‘a di Bologna, viale Berti Pichat 6/2, 40127 Bologna, Italy
7Aix-Marseille Universit´e, CNRS, LAM (Laboratoire d’Astrophysique de Marseille) UMR 7326, 13388, Marseille, France 8Sorbonne Universit´e, UPMC Univ Paris 06, et CNRS, UNR 7095, IAP, 98b bd Arago, F-75014, Paris, France
9ASIAA Sinica, AS/NTU. No. 1, Sec. 4, Roosevelt Rd., Taipei 10617, Taiwan, R.O.C. 10Caltech, 1200 E. California Blvd., Pasadena, CA 91125, USA
11IPAC, 1200 E. California Blvd., Pasadena, CA 91125, USA
Accepted 2016 December 6. Received 2016 December 6; in original form 2016 July 12
ABSTRACT
We present a structural study of 182 obscured Active Galactic Nuclei (AGNs) at z ≤ 1.5, selected in the COSMOS field from their extreme infrared to X-ray luminosity ratio and their negligible emission at optical wavelengths. We fit optical to far-infrared spectral energy distributions and analyze deep HST imaging to derive the physical and morphological properties of their host galaxies. We find that such galaxies are more compact than normal star-forming sources at similar redshift and stellar mass, and we show that it is not an observational bias related to the emission of the AGN. Based on the distribution of their U V J colors, we also argue that this increased compactness is not due to the additional contribution of a passive bulge. We thus postulate that a vast majority of obscured AGNs reside in galaxies undergoing dynamical compaction, similar to processes recently invoked to explain the formation of compact star-forming sources at high redshift.
Key words: galaxies: active – galaxies: star formation – infrared: galaxies
1 INTRODUCTION
The census of the population of X-ray and optically-selected Active Galactic Nuclei (AGNs) has undergone dramatic im-provements over the past few years, and a general consensus on the nature of their host galaxies has now emerged : the vast majority of AGNs reside in normal isolated galaxies, in which the activity of star formation co-evolves with the super-massive black hole accretion (Cisternas et al. 2011;
Kocevski et al. 2012; Mullaney et al. 2012; Juneau et al.
2013). However, an ongoing debate still persists on the exact structural properties of the AGN host galaxies. When com-pared to normal star-forming disks at z ∼ 1, X-ray AGN
? E-mail: [email protected]
hosts have been found either bulgier (Grogin et al. 2005;
Pierce et al. 2007), similar (B¨ohm et al. 2013;Villforth et al.
2014), or intermediate between disks and spheroids (Gabor
et al. 2009). Such inconsistent results might be partly
ex-plained by the difficulty to separate the contribution of the central AGN from the emission of the underlying host, even when high resolution images such as those obtained with the Hubble Space Telescope (HST) are used.
Obscured AGNs weakly contribute to the total galaxy emission at optical wavelengths, and the characterization of their host is therefore less subject to the subtraction of the AGN signature. Interestingly, analysis of X-ray selected Compton-thick AGNs and their host galaxies have revealed a fraction of disturbed morphologies and mergers increas-ing with obscuration, substantially larger than found among
L2
Yu-Yen Chang et al.
moderately obscured and unobscured AGNs (Kocevski et al.
2015;Lanzuisi et al. 2015). Yet, most of the obscured AGNs
studied so far have among the highest bolometric luminosi-ties measured (Lbol> 1043L ) and may not be
representa-tive of the bulk of the obscured AGN population.
In this letter we identify AGNs from their character-istic mid-IR power-law emission using the Cosmic Evolu-tion Survey (COSMOS, Scoville et al. 2007) and focus on a sub-sample of obscured AGNs carefully selected based on their infrared to X-ray luminosity ratio. Supplementing the more traditional X-ray Compton-thick selection, our tech-nique provides us with a large and complementary sam-ple of obscured AGNs at moderate luminosities, allowing a more complete view on the properties of the galaxies hosting this population. We use AB magnitudes and adopt the cos-mological parameters (ΩM,ΩΛ,h)=(0.35,0.70,0.70) and the
Chabrier(2003) stellar initial mass function.
2 THE DATA
2.1 Parent galaxy sample and IR AGN candidates Infrared-luminous AGN candidates (hereafter IR-AGNs) were identified among the 24µm sources of the COSMOS field (Le Floc’h et al. 2009) using a criterion similar to that initially proposed by Lacy et al. (2004). In practice, we first considered all sources with IRAC Fν flux
densi-ties monotonically rising from 3.6 to 8µm, as well as those with IRAC 5.8µm and 8µm fluxes exceeding by >3σ the expected emission of the stellar component assuming typ-ical galaxy models and spectral energy distribution (SED) fitting techniques. In the parameter space defined by the F5.8µm/F3.6µm and F8µm/F4.5µm colors, these objects
pop-ulate a specific area that shows also minimized contamina-tion by star-forming galaxies at low to intermediate redshifts (Chang et al., in prep.). Assuming the latest photometric and spectroscopic redshifts in COSMOS all 24µm sources at z ≤ 1.5 located in this two-color region were hence selected as potential AGN-dominated galaxies. This led to a total sample of 655 IR-AGN candidates, 353 of which are also de-tected in the deep X-ray Chandra COSMOS Legacy with an estimated L2−10keV luminosity greater than 1042erg s−1
(Marchesi et al. 2016;Civano et al. 2016). Among the 655
selected AGNs, 426 have reliable spectroscopy. For the other 229 sources, 106 are X-ray detected and we take the photo-metric redshifts fromMarchesi et al.(2016) as described in
Salvato et al.(2011). For the remaining 123 AGNs , we
as-sumed that the optical/NIR emission is mostly powered by the host galaxies and thus used the photometric redshifts derived byLaigle et al.(2016).
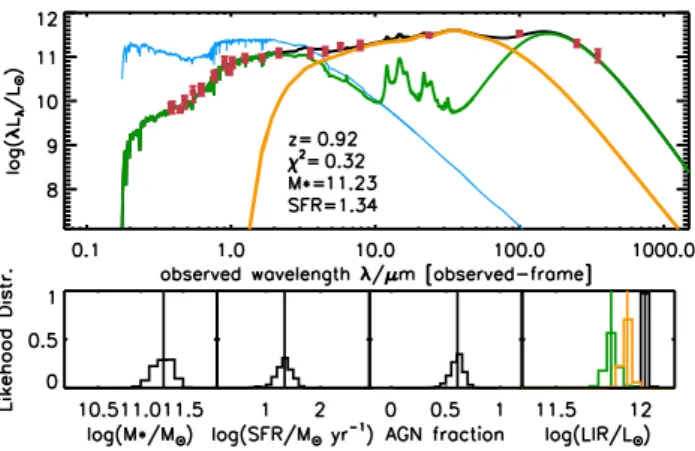
All COSMOS 24µm sources have optical to far-IR pho-tometry available from the band-merged COSMOS2015 cat-alog ofLaigle et al.(2016). We fit SEDs to the IR-AGNs with a new version of MAGPHYS (da Cunha et al. 2008,2015, in prep.), updated to account for a possible AGN contri-bution and relying on both obscured and unobscured AGN templates. Fig. 1shows the multi-band photometry of one IR-AGN candidate and its host galaxy, along with the best SED fit decomposed into the relative AGN and stellar contri-butions. We find that galaxies hosting IR-AGNs at z ≤ 1.5 in COSMOS have typical stellar masses M∗& 1010M with a
Figure 1. The multi-band photometry of a type-2 IR-AGN (top panel, red data points) along with its best SED fit (black solid line). The emission from the stellar component and the AGN are represented by the green and orange curves respectively, while the blue line shows the unattenuated stellar spectrum. Likelihood distributions are illustrated for the stellar mass, the SFR, AGN fraction (contribution to the infrared), and IR luminosity.
peak distribution at M∗∼ 1010.5M . They have specific Star
Formation Rates (sSFR) typical of star-forming sources, 45% of them being individually detected with Herschel in the far-IR, i.e., in a wavelength range where the dust emis-sion is mostly powered by intense star formation.
2.2 Obscured AGNs
Assuming the total infrared luminosity of the AGN com-ponent derived from the SED fits (referred as LIR,AGN
hereafter) we define “obscured AGNs” as IR-AGNs with LIR,AGN/LX > 20, where LX is the X-ray 2-10 keV
lu-minosity or upper limit obtained from the Chandra Legacy observations of COSMOS. For the latter we assumed Γ = 1.4 following the prescriptions of Marchesi et al. (2016). We used the 90% completeness flux limit f2−10keV = 5.0 ×
10−15erg s−1cm−2in case of no X-ray detection, resulting in a selection of 265 objects. Given the relation LIR∼ 2 × L6µm
implied by our type-2 AGN SED models, we note that our criterion identifies AGNs with dust reprocessed emis-sion at least 0.3 dex larger than expected from the intrin-sic L6µm − LX relationship observed among unobscured
AGNs (e.g., Stern 2015). Therefore, our selection is not restrictive to extreme levels of X-ray absorption (e.g., a Compton-thick AGN with NH= 1024 cm−2 would
corre-spond to LIR/LX ∼ 80,Fiore et al.(2009)) but it provides
a statistically large sample of AGNs with high levels of ob-scuration, among which ∼ 50% escape the standard X-ray selection criterion LX> 1042 erg s−1.
Because of small-scale dust-free gas absorbers within the broad line region, AGNs with strong obscuration in the X-rays can still contribute some light at UV/optical wave-lengths (e.g.,Lanzuisi et al. 2013;Merloni et al. 2014). To avoid skewing our morphology measurements, 34 sources with detectable AGN contribution in the optical were ex-cluded from our sample: based on our SED fitting, we only kept sources where the AGN is best described by a deeply obscured torus emission contributing less than 0.001% to the I-band, ensuring that the optical light is fully dominated by
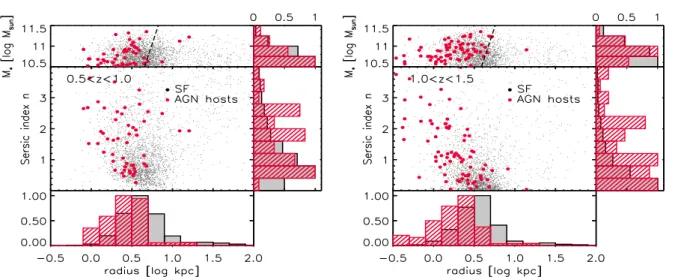
Figure 2. Stellar mass and S´ersic index versus half-light radius of obscured AGN hosts (red dots), compared to star-forming galaxies (black) at 0.5 < z < 1 (left) and 1 < z < 1.5 (right). The corresponding distributions are represented with normalized histograms along the x- and y-axis. The hosts of obscured AGNs have smaller radii and higher S´ersic indices than star-forming sources. The dashed-line indicates the mass–size relation of star-forming galaxies reported byvan der Wel et al.(2014).
the stellar component of the host galaxy such as in Fig.1 1
Independently of our SED fits, we also removed 17 AGNs previously identified as type-1’s bySalvato et al.(2011) and
Lilly et al.(2009). Restricting our analysis to the 1.64 deg2
HST/ACS imaging of COSMOS, we were left with a final sample of 182 obscured AGNs at z ≤ 1.5.
3 MORPHOLOGY
We analyzed the morphology of the obscured AGN host galaxies using the I-band ACS imaging of COSMOS, with both a visual classification approach and a parametric two-dimensional surface brightness fitting method. While the visually-classified properties will be reported in a future pub-lication, we discuss hereafter the results obtained by fitting the I-band light distribution with the GALFIT algorithm
(Peng et al. 2010). Having eliminated all the sources with
detectable AGN contribution and avoiding degeneracy from multiple components, it is fair to assume that the HST im-age can be fitted by using a S´ersic profile only as it is con-firmed by radial light profile later. Fig. 2shows the distri-butions of their half-light radius and Sersic index measured for M∗> 1010.5M at 0.5 < z < 1 and 1 < z < 1.5,
com-pared to the distributions obtained for a control sample of star-forming galaxies selected from the COSMOS2015 cata-log (Laigle et al. 2016) at similar redshifts and comparable stellar masses.
It is clear that the host galaxies of obscured AGNs have on average smaller radii and larger S´ersic indices, a result confirmed at > 99% confidence by a Kolmogorov-Smirnov (K-S) test. These galaxies could thus share some properties with the hosts of X-ray bright and radio-selected AGNs,
1 We made the stacking of the Probability Distribution
Func-tions of the AGN component resulting from the decomposition of each source in our sample and confirm a very high probabil-ity (>96.95%) to host a deeply buried AGN with no detectable emission (<0.001%) in the I-band.
which also seem to be more bulgy than star-forming galaxies even after subtracting the emission from the AGN (Gabor
et al. 2009;Bruce et al. 2016). Similarly, they appear to be
shifted toward smaller sizes with respect to the mass–size relation of star-forming galaxies (van der Wel et al. 2014).
To further quantify this trend, we investigated the av-eraged galaxy radial light profile using a stacking analysis. For each object, an ACS image centered on the peak emis-sion of the best-fit two-dimenemis-sional model given by GAL-FIT was extracted and re-sampled to a common physical scale of 0.18 kpc/px using bilinear interpolation. The sam-ple of star-forming galaxies was matched in stellar mass to the AGNs, and an averaged stack was created separately for the two populations in the two redshift bins mentioned above. Fig. 3shows the corresponding stacked images along with the average radial profile of the associated stacked de-tection, as well as the structural parameters of the best fits obtained with GALFIT. Here again, the I-band light distri-bution characterizing the hosts of obscured AGNs appears more compact than the profile of star forming galaxies. If we further sub-divide and compare the two populations by bin of galaxy stellar mass, the same trend is still observed for each redshift range, albeit with a lower significance at M∗& 1011M probably altered by the lower signal to noise
at the most massive end due to small sample size.
We stress that this steeper light profile of AGN hosts can not be due to the impact of the central AGN nor to the presence of a compact circum-nuclear starburst. Consid-ering that in such cases the emission would be unresolved at the resolution of HST, we used GALFIT to analyse the AGN stacked images assuming the combination of a S´ersic disk and a PSF. Fixing the geometry of the first compo-nent to that obtained for the control sample of star-forming sources and adopting a PSF does not lead to acceptable fits. This profile overpredicts the central flux while decreas-ing too steep on small scales (<1kpc). Similarly, leavdecreas-ing the S´ersic index and the radius as free parameters results in a small PSF fraction (. 3.5%) and thus a disk component again much steeper than the average profile of star-forming
L4
Yu-Yen Chang et al.
Figure 3. Top: Normalized stacked images of obscured AGN hosts and star-forming sources, displayed with a common grey-scale and selected as in Fig.2, along with the half-light radius and the S´ersic index measured with GALFIT. Bottom: Average radial light profile obtained from the stacked images (red: obscured AGN hosts; black: star-forming sources). Solid and dashed lines represent the median profile and the 1σ dispersion estimated with bootstrapping. The colored regions depict the radial profiles obtained after combining the stack of star-forming galaxies with the stack of U V J -selected red passive sources, with the contribution of the latter color-coded as shown in the inset.Dash-dotted and dotted curves illustrate the residuals after fitting the stacks with a single S´ersic disk and a S´ersic+PSF two-component model, respectively. The blue dashed line shows the residuals after fitting the AGN stack with a PSF and a S´ersic disk fixed to that obtained for the population of star-forming sources.
Figure 4. The U V J rest-frame colors of AGN hosts (red dots, stellar component only) compared to the control sample of star-forming galaxies. The corresponding normalized histograms are shown along the x- and y-axis. The hosts of obscured AGNs have optical/NIR colors typical of star-forming sources.
galaxies (see Fig.3). The more compact profile we observe among obscured AGNs is therefore intrinsically related to the morphology of their hosts, suggesting either a global compaction of the star-forming disk or the presence of an additional compact core in the central region.
We tested the latter option with the hypothesis that
an old stellar bulge has already formed in these objects. We considered the COSMOS red passive sources selected at sim-ilar redshift and stellar mass using the nU V rJ color-color criterion from Laigle et al.(2016) and derived their aver-age radial light profile as described above. As illustrated in Fig.3, we find that the total light profile of obscured AGN hosts can not be reliably reproduced by combining a red stel-lar bulge with the typical disk component characterizing the star-forming galaxies of the field (color-coded swath). Fur-thermore, the stack modeling suggests that the contribution of a possible red bulge to the total I-band light should be larger than ∼ 60% in order to steepen the radial profile as observed, which is in strong disagreement with the color dis-tribution of AGN host galaxies at optical wavelengths. For instance, we show in Fig.4 the standard U V J rest-frame color plot obtained for the hosts of obscured AGNs (assum-ing the best-fit stellar component derived from our SED fit-ting), compared to the control sample of star-forming galax-ies. Assuming a typical passive galaxy SED, a ∼ 60% bulge contribution to the I-band light would result in U − V colors statistically redder for the AGN hosts, while the two sam-ples exhibit remarkably similar color distributions. We thus conclude that the apparent compactness of obscured AGN host galaxies is not produced by the additional contribution of an old stellar bulge.
4 DISCUSSION
Obscured AGNs have negligible emission at UV/optical wavelengths, bringing the benefit of a minimal impact when characterizing the morphology of their underlying hosts with facilities like HST. Here we have shown that these hosts ex-hibit a radial light profile on average more compact than that of star-forming sources at similar mass, but not as steep as that observed in red passive objects (Fig.3). At very first sight, this could be interpreted as the signature of “transition galaxies” migrating from the population of disk-dominated blue sources to the red sequence of dead ellipticals, with the AGN possibly holding a negative feedback action re-sponsible for the quenching of the star-forming activity. Nu-merical simulations indeed suggest that wet major mergers can trigger a burst of intense star formation accompanied by accretion of material onto a highly obscured black hole, eventually leading to the formation of a passive galaxy once the gas has been blown out (e.g., Hopkins et al. 2008). In this scenario though, we expect the obscured AGN to be observed only in the very first stages of the merger before the formation of the compact remnant and when the mor-phology is still highly perturbed. This is not consistent with the low fraction of mergers observed in our sample (Chang et al. in prep.), which also gives further support to the now widely-accepted scheme in which the bulk of AGNs is not primarily linked to galaxy mergers. Besides, obscured AGN hosts have optical/NIR colors (Fig.4) and sSFRs typical of star-forming galaxies (Chang et al. in prep.), which is hard to reconcile with sources in a quenching phase.
More likely, we suggest that obscured AGNs are pri-marily hosted by star-forming galaxies having undergone a process of dynamical contraction, similar to the scenario re-cently proposed to explain the population of blue compact star-forming sources observed at z ∼ 1–2. Cosmological hy-drodynamical simulations of galaxy formation indeed sug-gest that highly perturbed gas-rich disks fed by cold streams at high redshift can experience phases of dissipative con-traction, leading to the formation of compact star-forming systems (Dekel & Burkert 2014). In this scenario, the com-paction is initially triggered by an episode of intense gas inflow involving counter-rotating streams or recycled gas as well as minor mergers. The inflow provides sufficient energy for maintaining a high level of turbulence and it is often as-sociated with violent disk instabilities that drive gas to the central region of galaxies. It thus leads to a massive core with high gas fraction and enhanced star formation (
Zolo-tov et al. 2015), and the inflow rate can also sustain gas
accretion onto the central super-massive black hole leading to the trigger of an AGN with moderately sub-Eddington luminosities (Bournaud et al. 2011). These disk instabili-ties can actually result in substantial central gas column densities with a peak distribution at log(NHI) ∼ 1023cm−2
(Bournaud et al. 2011). Gas compaction could thus lead to
central extinctions with even larger values, consistent with the AGNs being highly obscured when they are hosted by compact star-forming sources.
Interestingly, it was found that compact star-forming sources at z ∼ 2 seem more likely to host an X-ray bright AGN when compared to more extended sources (Barro et al. 2014), and that both clumpy and compact disk galaxies at z ∼ 2 harbor a high AGN fraction (Trump et al. 2014). Here
we analyzed a complete sample of AGNs with strong obscu-ration (defined by their X-ray to total infrared AGN lumi-nosity ratio) at 0.5 ≤ z ≤ 1.5, showing that there could be an even stronger connection between the mechanisms driving obscured black hole accretion and compact galaxies, at least at these lower redshifts. Exploring further how this link is driven by the galaxy internal processes will yet require a larger sample of AGNs, which will be achieved thanks to wider AGN surveys like those to be performed by eROSITA.
ACKNOWLEDGEMENTS
We thank the referee as well as A. Dekel and D. Elbaz for helpful comments and discussions. We acknowledge the con-tribution of the entire COSMOS collaboration as well as a financial support from ANR (#ANR-12-JS05-0008-01).
REFERENCES
Barro G., et al., 2014,ApJ,791, 52
B¨ohm A., et al., 2013,A&A,549, A46
Bournaud F., Dekel A., Teyssier R., Cacciato M., Daddi E., Juneau S., Shankar F., 2011,ApJ,741, L33
Bruce V. A., Dunlop J. S., Mortlock A., Kocevski D. D., McGrath E. J., Rosario D. J., 2016,MNRAS,458, 2391
Chabrier G., 2003,PASP,115, 763
Cisternas M., et al., 2011,ApJ,726, 57
Civano F., et al., 2016,ApJ,819, 62
Dekel A., Burkert A., 2014,MNRAS,438, 1870
Fiore F., et al., 2009,ApJ,693, 447
Gabor J. M., et al., 2009,ApJ,691, 705
Grogin N. A., et al., 2005,ApJ,627, L97
Hopkins P. F., Hernquist L., Cox T. J., Kereˇs D., 2008, ApJS,
175, 356
Juneau S., et al., 2013,ApJ,764, 176
Kocevski D. D., et al., 2012,ApJ,744, 148
Kocevski D. D., et al., 2015,ApJ,814, 104
Lacy M., et al., 2004,ApJS,154, 166
Laigle C., et al., 2016,ApJS,224, 24
Lanzuisi G., et al., 2013,MNRAS,431, 978
Lanzuisi G., et al., 2015,A&A,578, A120
Le Floc’h E., et al., 2009,ApJ,703, 222
Lilly S. J., et al., 2009,ApJS,184, 218
Marchesi S., et al., 2016,ApJ,817, 34
Merloni A., et al., 2014,MNRAS,437, 3550
Mullaney J. R., et al., 2012,MNRAS,419, 95
Peng C. Y., Ho L. C., Impey C. D., Rix H.-W., 2010,AJ,139, 2097
Pierce C. M., et al., 2007,ApJ,660, L19
Salvato M., et al., 2011,ApJ,742, 61
Scoville N., et al., 2007,ApJS,172, 1
Stern D., 2015,ApJ,807, 129
Trump J. R., et al., 2014,ApJ,793, 101
Villforth C., et al., 2014,MNRAS,439, 3342
Zolotov A., et al., 2015,MNRAS,450, 2327
da Cunha E., Charlot S., Elbaz D., 2008,MNRAS,388, 1595
da Cunha E., et al., 2015,ApJ,806, 110
van der Wel A., et al., 2014,ApJ,788, 28
This paper has been typeset from a TEX/LATEX file prepared by