Matter and regulation: socio-metabolic and accumulation
regimes of French capitalism since 1948
Louison Cahen-Fourot
∗1and Nelo Magalhães
†21
Institute for Ecological Economics, Wirtschaftsuniversität Wien, Austria
2LADYSS, Université de Paris, France
April 11, 2020
Abstract
This paper aims at integrating macroeconomic and institutional analyses of long run dynamics of capitalism with material flow analysis. We investigate the links between ac-cumulation and socio-metabolic regimes by studying French capitalism from a material perspective since 1948. We characterize its social metabolism both in production- and consumption-based approaches. We show that the periodization of accumulation regimes in terms of Fordism and Neoliberalism translates into material terms. The offshore materiality of Neoliberalism partly substitutes for and partly complements the more domestic material-ity inherited from Fordism. The transition phase between the two socio-metabolic regimes clearly corresponds to the emergence of the offshoring-financialization nexus of French capi-talism indicating the shift from the fordist accumulation regime to the neoliberal accumula-tion regime. Acknowledging that socio-metabolic regimes have their own logic, we highlight strong inter-linkages between accumulation and material dynamics and discuss how materi-als may be instrumental in shaping accumulation regimes. This work therefore illustrates the relevance of combining institutional macroeconomics with methods and approaches derived from Ecological Economics.
Keywords: Material Flow Analysis; Material footprint; Socio-metabolic regime; Finan-cialization; Offshoring; Accumulation regime
JEL:E02; O11; O13; P16; P18; Q57
∗louison.cahen-fourot@wu.ac.at
1
Introduction
1
Material extraction has more than tripled globally between 1970 and 2010 at a time where
2
both population and economic growth slowed down. Global primary material use is expected
3
to double by 2060, alongside the growth of in-use material stocks (e.g. building, machines,
4
infrastructures). This ever widening material basis of our societies has potentially huge
environ-5
mental consequences, e.g. natural resources exhaustion, additional greenhouse gases emissions
6
or biodiversity loss. This is all the more concerning as material efficiency — the amount of
7
primary materials required per unit of economic activity — has declined globally since 2000
8
due to production offshoring from very to less material-efficient countries and massive building
9
of infrastructures in emerging countries, especially China (OECD, 2019; Schandl et al., 2018;
10
Wiedenhofer et al., 2019).
11
Yet, key economic indicators like the gross domestic product or measurement tools like
na-12
tional accounting remain largely disconnected from the physical basis of our societies. This
dis-13
connection results in the dematerialization of the representation of the economy (Pottier, 2014).
14
At a time where planetary boundaries are all being exceeded (Steffen et al., 2015), it is therefore
15
urgent to integrate a physical dimension to the understanding of accumulation dynamics and to
16
the long run analysis of capitalism (Görg et al., 2020).
17
Despite calls for integrating political ecology, political economy, environmental history and
18
ecological economics (Muradian et al., 2012), few studies have undertaken to investigate capital
19
accumulation dynamics and biophysical flows together. In this paper, we attempt at
comprehend-20
ing in an integrated manner the socio-metabolic and accumulation regimes of French capitalism
21
since 1948. To do so, we bring together two strands of literature that had yet to converse:
22
Material Flow Analysis (MFA) and Regulation Theory (RT).
23
RT provides an analytical framework to analyse the long run dynamics as well as the
his-24
torical and spatial diversities of capitalism through accumulation regimes. An accumulation
25
regime consists of “the set of regularities that ensure the general and relatively coherent progress
26
of capital accumulation, that is, which allow the resolution or postponement of the distortions
27
and disequilibria to which the process continually gives rise” (Boyer and Saillard, 2002, p. 334).
28
These regularities are given kinds of production organization, income distribution and
composi-29
tion of demand combining into a coherent regime through their dynamic compatibility (Aglietta,
30
2015; Boyer, 2015). The term regulation (in RT and in the title) refers to the institutional
31
forms embodying social compromises and thus enabling a coherent reproduction of the economic
32
system over time through setting patterns of individual and collective behaviours. The
institu-33
tional forms combine together in the mode of regulation supporting the accumulation regime and
34
regulating it.
35
MFA offers a physical perspective on economies. It quantifies social metabolism, that is
36
the way societies organize their exchanges of matter and energy with their natural environment.
37
Social metabolism refers to the physical throughput of the economic system in terms of the energy
38
and materials associated with economic activities, either as direct or indirect inputs and wastes.
socio-metabolic regimes correspond to human modes of subsistence, “a dynamic equilibrium of a
40
system of society-nature interaction” (Fischer-Kowalski and Haberl, 1993; Haberl et al., 2016).
41
Until recently, RT was notoriously blind to environmental issues and natural resources
dy-42
namics (Cahen-Fourot, 2020; Chester, 2010; Zuindeau, 2007) while MFA has yet to integrate
43
its approach into a political economy of capitalism. Nonetheless, both RT and MFA privilege
44
long term analyses and attempt at identifying periodization of, respectively, accumulation and
45
socio-metabolic regimes, their crises and the associated transitions, mainly from a methodological
46
nationalist perspective.
47
Two distinct accumulation regimes have been identified in the post-war era in France: Fordism,
48
from the early years of post-war recovery to the mid-seventies and Neoliberalism from then
on-49
wards. Fordism can be characterized by high productivity gains supporting a social compromise
50
between labour and capital in favour of labour resulting into strong redistributive institutions
51
such as the welfare-state and social security, long term employment relations and an
accumula-52
tion process led by domestic mass consumption. Neoliberalism is characterized by the progressive
53
dismantling and replacement of the welfare by a market regulator state, the flexibilization of
em-54
ployment relations and liberalization of goods, services and financial flows and the rise of finance
55
as a dominating sector of the economy and of financial motives as the leading principle of
non-56
financial corporate governance (Boyer, 2015; Duménil and Lévy, 2014; Harvey, 2014; Husson,
57
2012; Lazonick and O’Sullivan, 2000).
58
Fordism and Neoliberalism also translate into biophysical terms. In high income countries,
59
fordism can be characterized as an extensive energy regime with decreasing efficiency but fastly
60
increasing quantity integrated into the production process and supporting high labour
produc-61
tivity gains. Neoliberalism exhibits a rising energy efficiency with a strong relocation of energy
62
use abroad accompanying the restoration of the capital share in the distribution of value added.
63
Beyond energy, correspondence between the socio-metabolic and accumulation regimes of French
64
capitalism in the post-war era has been shown for production-based material flows (Cahen-Fourot
65
and Durand, 2016; Magalhães et al., 2019).
66
This paper pertains to a research program in its infancy and is thus mainly descriptive.
67
Still, our research question is twofold. First, it is to confirm the common temporality between
68
accumulation and socio-metabolic regimes of French capitalism in the post-war period by
go-69
ing beyond methodological nationalism through integrating material footprint data (Wiedmann
70
et al., 2015). Second, it is to discuss the dialectical relation between accumulation and
socio-71
metabolic regimes to understand the interdependencies and mutual influences that may explain
72
their common dynamics.
73
In the reminder of this paper, we first provide in section 2 a short methodological introduction
74
to MFA. We then present data to characterize the fordist and neoliberal socio-metabolic regimes
75
and to approach the internationalization of French capitalism in a physical perspective. In section
76
3, we draw from this new perspective on internationalization and discuss accumulation regimes
77
and the shift from Fordism to Neoliberalism. In section 4, we investigate possible causalities
relating accumulation and socio-metabolic regimes in discussing the role of material in economic
79
and political processes. We conclude by pointing out some limits and perspectives of this work.
80
2
Fordist and neoliberal socio-metabolic regimes: from an
81
extensive domestic to an extensive offshore materiality
82
This section shows to what extent the shift between Fordism and Neoliberalism translates into
83
material terms. We first recall the methodology of MFA and explain the need of the
consumption-84
based approach. We then describe the main material flows tendencies. First, we examine absolute
85
and relative material consumption at the aggregate level. Second, we deepen our description of
86
socio-metabolic regimes by scrutinizing disaggregated data. Finally, we highlight the growing
87
offshoring of material use.
88
2.1
Material flow analysis: a methodological introduction
89
MFA most often focuses on the domestic scale, for which long term statistics exist (Eurostat,
90
2018). Common indicators are domestic extraction (DE), imports (I ), exports (E), physical
91
trade balance (PTB = I - E) and the domestic material consumption (DMC = DE + PTB).
92
The material intensity (MI ) of an economy corresponds to the DMC-to-GDP ratio (see table 1).
93
It is worth recalling that DMC adds flows of a very different nature: domestic extraction refers to
94
raw materials whereas trade flows are a mix of raw and manufactured commodities. Some
(low-95
income) extractive countries have therefore a much higher DMC per capita than high income
96
countries. For instance, this can lead to the (wrong) conclusion that Chile consumes three times
97
more material per capita than France or Germany1. DMC is generally the main indicator to
98
assess national material dynamics. Many industrialized countries have instituted policies (Giljum
99
et al., 2015; OECD, 2019; Wiedmann et al., 2015) encouraging ‘dematerialization’ by setting
100
decreasing material intensity targets (e.g until recently MI was considered a key indicator of
101
the EU sustainable development and Europe 2020 strategies). However, DMC’s methodological
102
nationalism entails blindness to indirect material flows generated abroad to satisfy a country’s
103
final demand.
104
Indirect flows are relevant measures of environmental load displacement because they
re-105
main in the exporting country but are necessary for the provision of exports (Dittrich et al.,
106
2012). Since production and consumption in high income countries are increasingly dependent
107
on material and energy resources from other world regions2, environmental impacts have been
108
1Respectively around 43t/cap and 14t/cap in 2009 (Giljum et al., 2014, Table 1). Chile provides an interesting example as the leading world copper supplier: “each ton exported by Chile needs around 25 tonnes of indirect
flows that remain in the country in the form of waste and emissions” (Muñoz et al., 2009, p. 888).
2Between 1990 and 2005, world trade volumes in products increased by 5.8% annually, while production only grew by 2.5% per year. Growth in trade was the highest for manufactured products (6.4%), followed by agricultural products (3.8%) and fuels and mineral products (3.5%) (Giljum et al., 2015).
increasingly approached through the whole ecological cost — the footprint — of material use
109
and greenhouse gases emissions (Peters, 2008; Wiedmann et al., 2006).
110
The fundamental idea of the consumption-based approach is to allocate all the environmental responsibility to the final consumer. For material flows, this involves switching from DMC to the material footprint (MF) to take into account the raw material equivalents (RMEs) — that is not only materials actually contained in imports but also upstream material flows required along the whole production chain. Material footprint is defined as (Wiedmann et al., 2015)
M F = DE + RT B
where RTB is the raw trade balance that is raw material equivalents of imports minus raw
111
material equivalents of exports. It is important to note that the concept of RME refers only
112
to “used materials” — that is, those material flows that enter economic processes. The other
113
component of these indirect flows, so-called unused extraction3, is not included in RME and,
114
despite its ecological relevance, is not considered here. Material inputs included in RME are
115
therefore necessary to produce an output. A certain portion of such inputs, however, is embodied
116
in the final outputs, whereas the rest of the material is dissipated along the production chain or
117
recycled.
118
The difference between DMC and MF can be huge for metal-exporting countries (with MF
119
< DMC) and high income industrialized countries (with MF > DMC; except for Australia).
120
This change is particularly important for Europe, the region with the highest share of materials
121
embodied in imports (Giljum et al., 2015). Bruckner et al. (2012, table 5) show that MF was
122
49% higher than DMC in 2005 for France. A final motivation to adopt a material footprint
123
perspective for France is the steep increase from 15% in 1948 to over 50% in 2015 of the amount
124
of imports compared to domestic extraction (I/DE) (Magalhães et al., 2019).
125
To estimate RME, it is necessary to trace material flows through the production system into
126
domestic or foreign final consumption. Different methods exist to compute the material footprint
127
of a country (Eurostat, 2015; Lutter et al., 2016). Multi-Regional Input Output (MRIO) models
128
permit to study and quantify the dependency of countries regarding imports from other parts
129
of the world (Giljum et al., 2015). Unfortunately, these data usually do not go back further
130
than 1990. As for the bottom-up coefficient approach, it is inappropriate for our macroeconomic
131
scale. Indeed, it is very hard to construct solid coefficients for a large number of especially
132
highly processed products (Lutter et al., 2016), particularly for a long period. Moreover, we
133
prefer not to implement a hybrid method (MRIO-coefficient approach) that bears the risk of
134
being too opaque. Our production- and consumption-based historical time series combine the
135
novel long term domestic material flow data for France from Magalhães et al. (2019) with data
136
from the Eora input-output database (Lenzen et al., 2013). All details on data and time series
137
3Upstream material flows associated with imports are called indirect flows. Hidden flows of domestic origin are called domestic unused extraction. These flows are “soil and rock excavated during construction or overburden
from mining, the unused by-catch in fishery, the unused parts of the straw harvest in agriculture or natural gas flared or vented at the extraction site” (Eurostat, 2018, p. 19).
construction can be found in the appendix4. Table 1 sums up the main MFA concepts.
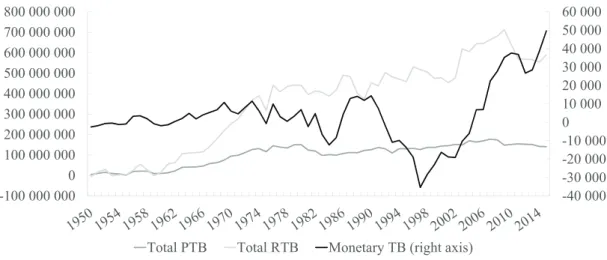
138
acronym unit meaning / definition
DE t Domestic Extraction
PTB= I − E t Physical Trade Balance
DMC= DE + PTB t Domestic Material Consumption
RMEimp t Raw Material Equivalent: Upstream material requirements of imports
RMEexp t Raw Material Equivalent: Upstream material requirements of exports
RTB= RMEimp− RMEexp t Raw Trade Balance
MF= DE + RTB t Material Footprint(or Raw Material Consumption)
MI= DMC /GDP t per US$ Material Intensity: efficiency of material use
AMI= MF/GDP t per US$ Adjusted Material Intensity: efficiency of material use corrected for MF
MP= GDP/DMC US$ per t Material Productivity
Table 1: t = ton. Note that MF is also termed RMC (raw material consumption). In what follows, we first describe material dynamics at the aggregate level, considering
abso-139
lute material consumption and the material intensity of the gross value added (GVA)5. We then
140
disaggregate into MFA’s four main categories: biomass, metal, non-metal and fossil fuel.
141
2.2
An aggregate material view at French capitalism
142
Figure 1 illustrates the aggregate material consumption of French capitalism since 1948. It is, to
143
the best of our knowledge, the first long term comparison of material consumption in
production-144
and consumption-based approaches for France.
145
4While beyond the scope of this paper, it is worth mentioning the new approach suggested by Piñero et al. (2019). They combine MFA and a global value chains (GVC) approach to allocate environmental responsibility based on the value added each country and sector appropriate along the chain. An interesting result is that the consumption-based responsibility is lower than the GVC-based one for Germany and France since 1990.
5Here we consider GVA at factors cost as it is more accurate to compare the distribution of value added between labour and capital as we do in section 3. GVA at factors cost = compensation of employees + gross operating surplus + other subsidies on production − other taxes on production. Value added is thus comprehended as the sum of payments to use primary inputs (e.g. labour and capital) (Miller and Blair, 2009).
200!000!000
400!000!000
600!000!000
800!000!000
1!000!000!000
1!200!000!000
1!400!000!000
1948 1952 1956 1960 1964 1968 1972 1976 1980 1984 1988 1992 1996 2000 2004 2008 2012
Domestic material consumption
Material footprint
Figure 1: Domestic material consumption and material footprint in tonnes from 1948 to 2015. Sources: Lenzen et al. (2012, 2013); Magalhães et al. (2019) and authors’ computations.
This figure indicates no dematerialization of French capitalism despite technological
improve-146
ments and the shift of production toward services. It confirms that accumulation regimes as
147
identified by RT have their counterpart in terms of socio-metabolic regimes6. We observe a clear
148
break in the 1970s, as already observed by Wiedenhofer et al. (2013) and Cahen-Fourot and
149
Durand (2016) for energy. The shift between Fordism and Neoliberalism in the 1970s appears as
150
a stabilization of material consumption at the domestic scale and as an increasing offshoring as
151
indicated by the footprint trajectory. Moreover, the divergence of the two curves that emerges
152
in the mid-1960s highlights the importance of the footprint perspective. These curves follow a
153
very similar path up until the end of the 1960s and shift apart at the onset of the
globaliza-154
tion era. Both curves exhibit an increasing trend up until the late 1970s. DMC then shows a
155
fluctuating yet flat trend afterwards, whereas the MF curve keeps increasing (although slower).
156
All series experience another shift in the years 2007-2009 at the outburst of the global financial
157
and economic crisis. Trajectories did not then come back to their previous trends as the figure
158
shows. As of today, it is still unclear whether this is due to evolutions in production processes
159
and structures or to the ongoing consequences of the crisis7. MF grew 4-fold since 1948, from
160
316 Mt8to 1217 Mt in 2015 (the population then rose from 41.1 to 66.4 million), reaching a peak
161
of 1420 Mt just before the financial crisis of 2008.
162
6Initially three main socio-metabolic regimes were identified in human history: hunter-gatherers, agricultur-alists, and industrial society (Fischer-Kowalski and Haberl, 1997). These longue durée regimes make sense from a pure metabolic point of view but may hidden historical variations due to capitalist development. In this regard, our paper can be seen as a deepening of the understanding of the quantitative and qualitative variations in the industrial society socio-metabolic regime for France in the after-war period.
7Kovacic et al. (2018) show that no major change occurred in the use of energy in the decade following the financial and economic crisis. Using a structural measure of inter-sectoral dependencies, Cahen-Fourot et al. (2020) also show the key importance of natural resources and raw materials for 18 European countries in 2010.
0.4
0.6
0.8
1.0
1.2
1.4
Material Intensity
Adjusted Material Intensity
Figure 2: Domestic and footprint adjusted material intensity of GVA at factors cost in kilo per 2010 euro. Sources: authors’ computations from Lenzen et al. (2012, 2013); Magalhães et al. (2019) and OECDStat data.
At the aggregate level, one can observe in figure 2 a long term relative decoupling for both
163
approaches: a decrease of MI from 1958 onwards and of AMI from 1973 onwards. RT
periodiza-164
tion in terms of Fordism and Neoliberalism corresponds to both MF and AMI trajectories at the
165
aggregate level.
166
2.3
A disaggregate material view at French capitalism
167
The disaggregate level reveals more diverse dynamics. As can be seen on figure 3, the shift in the
168
absolute material trajectory of French capitalism between Fordism and Neoliberalism translates
169
into the disaggregated material categories for DMC but less so when looked at through MF.
60!000!000 110!000!000 160!000!000 210!000!000 260!000!000 310!000!000 360!000!000 410!000!000 1948 1952 1956 1960 1964 1968 1972 1976 1980 1984 1988 1992 1996 2000 2004 2008 2012 Fossil_dmc Fossil_foot 45!000!000 145!000!000 245!000!000 345!000!000 445!000!000 545!000!000 1948 1952 1956 1960 1964 1968 1972 1976 1980 1984 1988 1992 1996 2000 2004 2008 2012 Non-metal_dmc Non-metal_foot 100!000!000 150!000!000 200!000!000 250!000!000 300!000!000 350!000!000 400!000!000 450!000!000 1948 1952 1956 1960 1964 1968 1972 1976 1980 1984 1988 1992 1996 2000 2004 2008 2012 Biomass_dmc Biomass_foot 0 20!000!000 40!000!000 60!000!000 80!000!000 100!000!000 120!000!000 1948 1952 1956 1960 1964 1968 1972 1976 1980 1984 1988 1992 1996 2000 2004 2008 2012 Metal_dmc Metal_foot
Figure 3: DMC and MF for biomass, metal, non-metal and fossil fuel. All data are in tonnes from 1948 to 2015. Sources: authors’ computations from Lenzen et al. (2012, 2013); Magalhães et al. (2019).
In the DMC perspective, we observe clear shifting trends for all curves in the mid- and
late-171
1970s. Biomass continuously increases since 1948 but with a much flatter shape after the twilight
172
of Fordism in the late 1960s. Non-metallic minerals acknowledge the strongest increase, with an
173
average annual growth of 8.7% for 25 years (table 2). Metal consumption stops increasing and
174
experiences a continuous decrease since the end of Fordism while non-metal consumption strongly
175
oscillates but does not exhibit an increasing trend after Fordism. Fossil fuel consumption reaches
176
a maximum in 1980, after the second oil crisis, then sharply decreases and remains stable for 20
177
years. The fossil fuel DMC has decreased further after the 2008 crisis.
178
MF offers a slightly different picture. Biomass and metal continuously increase, respectively
179
from 1948 and the early 1960s, indicating no shift between Fordism and Neoliberalism.
Contrari-180
wise, non-metal and fossil fuel footprints indicate again a break in the mid-1970s. Their behavior
181
is similar to their domestic trajectory9, although for fossil fuels the level is substantially higher
182
than domestic consumption (the energy embodied in imported goods is thus very high). Note
183
also that the increase in fossil fuel consumption goes with a strong decrease in coal extraction
184
from the early 1960s (oil become dominant in the energy mix around 1963).
185
Metal MF shows important oscillations during Fordism (due to a change in the statistical
ter-186
ritory and estimation issues) but still remains below DMC. It then always exceeds DMC for the
187
neoliberal period (from 1976). This category perfectly illustrates the need of the
consumption-188
based approach: MF never stops rising whereas the DMC curve decreases (domestic metal
extrac-189
tion strongly decreases in the 1970s). Taking waste from metal processing abroad into account,
190
there is no dematerialization concerning this category in France (metal footprint exhibits a
con-191
9The use of metal ores and fossil fuels is usually well explained by the GDP per capita (Wiedmann et al., 2015, Table 1).
stant rise since 1965). The transition in accumulation regimes nearly coincides with the shift
192
from net exporter to net importer of metal (in 1978) and with the crossing of the two curves.
193
Table 2 also underlines the specificity of this category: all materials but metal indicate a relative
194
decoupling trajectory during Neoliberalism.
195
Non-metal MF — the most important category in weight — is close to non-metal DMC.
196
Indeed, these materials are abundant and their extraction unit cost is low. Transportation costs
197
are therefore relatively high in comparison and trade flows are limited10. Due to their properties
198
and to political and ecological issues, some flows are thus more concerned by globalization than
199
others. Offshoring of metallic goods and substitution of imported oil for domestic coal is
pos-200
sible but offshoring of construction materials — which compose much of non-metals — is more
201
complicated. Stabilization of both curves can be understood as a saturation of accumulated
202
material stocks (buildings, roads, etc.). Global in-use stocks of manufactured capital already
203
require about half of global material flows for their expansion and maintenance (Krausmann
204
et al., 2017; Wiedenhofer et al., 2015). There is thus an unavoidable material path dependency
205
between socio-metabolic regimes induced by in-use material stocks (Pauliuk and Müller, 2014;
206
Wiedenhofer et al., 2019). Interestingly, the material infrastructure of Neoliberalism rests on,
207
and extends, that of Fordism.
208
Moreover, not only can the shift from a socio-metabolic regime to another be detected in the
209
dynamics of a series itself but it can also be in the growing difference between DMC and MF
210
series. In that regard, we can see a socio-metabolic shift even for categories whose series exhibit
211
a continuity in their own dynamics, e.g. biomass and metal11. In a nutshell, the overall
corre-212
spondence between socio-metabolic and accumulation regimes is remarkable even if unsurprising
213
and was yet to be investigated in details for France.
214
Figures 1 and 2 and table 2 indicate that Fordism is an extensive socio-metabolic regime
215
at both domestic and footprint levels. It is characterized by a high annual average growth of
216
material consumption and a low degrowth of domestic material intensity and low growth of the
217
adjusted material intensity. Neoliberalism is an intensive socio-metabolic regime at the domestic
218
level with an annual average degrowth of material consumption and a significant annual average
219
degrowth of material intensity. At the footprint level, it is rather a weakly extensive regime with a
220
low average annual growth of material footprint and a significant average annual degrowth of the
221
adjuted material intensity, albeit lower than at the domestic level. These results are consistent
222
with the characterization of Fordism and Neoliberalism in terms of their social relation to energy
223
as shown by Cahen-Fourot and Durand (2016).
224
10According to the data from Magalhães et al. (2019), non-metallic minerals consist of less than 20% of France’s trade flows and concern mainly Germany and Belgium.
11In statistical terms, it is unsure whether a structural break analysis would yield any significant result for, e.g., biomass footprint. However, a structural break would probably be detected in the cointegration relationship between biomass DMC and MF, with cointegration turning insignificant after the late 1960s due to a non-trend stationary difference between biomass DMC and MF.
Material consumption 1948-1973 1974-2015 Material intensity 1950-1973 1974-2015 DMC 4.2% -0.4% MI -0.8% -2.2% Biomass_dmc 1.3% 0.2% Biomass_mi -3.5% -1.6% Metal_dmc 3.9% -1.9% Metal_mi -0.8% -3.6% Non-metal_dmc 8.7% -0.4% Non-metal_mi 2.8% -2.1% Fossil_dmc 4.2% -1.0% Fossil_mi -0.6% -2.7% MF 5.3% 0.1% AMI 0.4% -1.7% Biomass_foot 3.0% 0.6% Biomass_ami -2.5% -1.2% Metal_foot 2.7% 1.9% Metal_ami 11.6% 0.1% Non-metal_foot 8.3% 0.2% Non-metal_ami 2.7% -1.5% Fossil_foot 5.9% -0.7% Fossil_ami 1.6% -2.5%
Table 2: Annual average growth rate of material consumption and of material intensity of gross value added during Fordism and Neoliberalism. Source: authors calculations from Magalhães et al. (2019) data.
2.4
A growing offshoring of material use
225
The diverging trajectories of DMC and MF offer a material perspective on the internationalization
226
of French capitalism. Examining the physical and the raw material trade balances (PTB and
227
RTB; presented as imports − exports) substantiates this perspective. As explained before, PTB
228
is the physical equivalent of the monetary trade balance, whereas RTB includes both direct and
229
indirect flows (i.e. it includes also all materials that are not directly composing net imports but
230
were necessary to their production).
231
Figure 4 shows the evolution of the total and non-fossil fuels (non-FF) PTB since 1948. We
232
see the huge importance of fossil fuels-related materials in France’s net imports as France is a
233
net importer in physical terms on the entire period when fossils are considered. The deepening
234
integration of the French economy in the global economy is perhaps better captured if only
non-235
fossil fuel materials are considered: We observe a continuous rise in net imports from the early
236
1970s onwards. France becomes a net importer in 1994.
-35 000 000
15 000 000
65 000 000
115 000 000
165 000 000
Total PTB
Non-FF PTB
0-line
Figure 4: PTB and non-fossil fuels (non-FF) PTB of France from 1948 to 2015, presented as net imports, in tonnes of materials. Source: Magalhães et al. (2019).
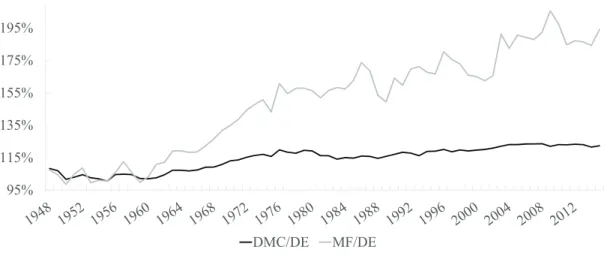
RTB (figure 5) corroborates this observation as net imports exhibit a continuous rise since
238
the early 1960s when fossil fuels are included and since the late 1960s when only non-fossil fuels
239
materials are considered. Similarly, after a decade of roughly balanced trade (total RTB) and
240
excess trade (non-FF RTB), France becomes net importer of materials respectively in the early
241 1960s and late 1970s. 242 -100 000 000 0 100 000 000 200 000 000 300 000 000 400 000 000 500 000 000 600 000 000 700 000 000
Total RTB Non-FF RTB 0-line
Figure 5: RTB and non-FF RTB of France from 1948 to 2015, in tonnes of materials, presented as net imports. RTB includes both direct and indirect material flows embodied in trade. Source: Magalhães et al. (2019) and authors calculations.
The difference between RTB and PTB is an indicator of the dependency of French capitalism
243
on indirect material flows from trade. Figure 6 presents the rising divergence between RTB
and PTB (by construction equal to MF − DMC). After a fast increase in the end of Fordism
245
(1963–1974), the curve slowly and steadily increases, reaching a peak in 2009.
246
-70!000!000
30!000!000
130!000!000
230!000!000
330!000!000
430!000!000
530!000!000
1948 1952 1956 1960 1964 1968 1972 1976 1980 1984 1988 1992 1996 2000 2004 2008 2012
tonne sTotal RTB-PTB 0-line Non-FF RTB-PTB
Figure 6: Total and non-FF indirect material flows due to trade (RT B − P T B = MF − DMC) at the aggregate level. Source: Magalhães et al. (2019) and authors calculations.
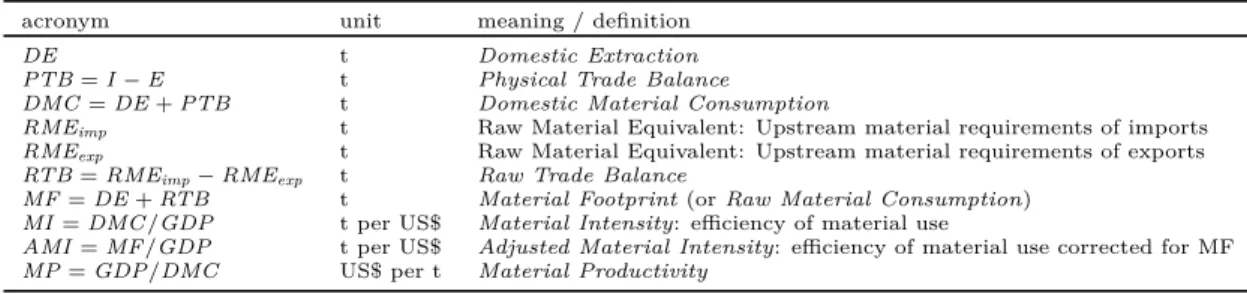
Figure 7 further shows the constantly rising dependency of French capitalism to the global
247
economy as measured through the ratio of DMC and MF to DE, indicating how much of material
248
use is covered by domestic extraction: the MF/DE ratio reached nearly 2 in the last decade,
249
whereas the DMC/DE ratio does not exceed 1.3. In the 2010s, half of the total physical basis
250
of French capitalism came from abroad. This is more than many industrialized countries but
251
still less than high income countries with limited resources such as Netherlands or Switzerland
252
(Bruckner et al., 2012).
95% 115% 135% 155% 175% 195% DMC/DE MF/DE
Figure 7: Domestic material consumption to domestic extraction and material footprint to do-mestic extraction ratios.
We can conclude that the fordist and neoliberal socio-metabolic regimes are of an extensive
254
nature beyond the domestic scale. The dynamics of PTB and RTB indicate that methodological
255
nationalism offers a limited perspective to assert the socio-metabolic regime of a country. In the
256
historical context of globalization, the footprint approach using consumption-based time series
257
brings relevant insights.
258
3
From Fordism to Neoliberalism: the offshoring-financialization
259
nexus of French capitalism
260
This section integrates the offshoring of material use to regulationnist explanations of the end of
261
Fordism. Interestingly, the transition from Fordism to Neoliberalism is clearer in physical than
262
in monetary terms. We further provide stylized facts characterizing the financialization of French
263
capitalism. We argue that this process combined with offshoring has reinforced and consolidated
264
the physical dependency of French capitalism to the rest of the world. We therefore illustrate
265
how RT and MFA combine with each other: The growing offshoring of material use highlights a
266
deeper internationalization of French capitalism and the crisis of Fordism. The financialization
267
of French capitalism and its systemic complementarity with the offshoring process can explain
268
the continuous growth of trade flows.
269
Figure 8 shows the contrast between the material and monetary perspectives. Whereas the
270
monetary trade balance oscillated during Fordism, material imports increased rapidly. From the
271
end of Fordism until 2000, France imported huge quantities of material while in monetary terms
272
exports were greater than imports12. France’s monetary trade balance — which had been in
273
large surplus until 1976 for common consumer goods — turned to deficit from 2000, especially
274
for intermediate goods (automotive, electronics, transport equipment etc.), which had hitherto
275
driven exports. From 2003, the trade balance became structurally negative following increasing
276
imports of intermediate and consumer goods and of energy products whose prices literally soared
277 from 2002 to 2007. 278 -40 000 -30 000 -20 000 -10 000 0 10 000 20 000 30 000 40 000 50 000 60 000 -100 000 000 0 100 000 000 200 000 000 300 000 000 400 000 000 500 000 000 600 000 000 700 000 000 800 000 000
Total PTB Total RTB Monetary TB (right axis)
Figure 8: PTB and RTB as net imports are in tonnes (left axis), the monetary trade balance is expressed as net imports in millions of 2010 euro (right axis). Sources: authors’ computations and OECDStat.
Increasing imports of intermediate goods are an indication of offshoring (Feenstra and
Han-279
son, 1999; Feenstra and Jensen, 2012). Figure 9 shows the long run offshoring dynamics of
280
French capitalism since 1970 through the share of imported intermediate consumption in
to-281
tal intermediate use of domestic industries. We complement this indicator with the share of
282
imported products in total final demand.
0%
5%
10%
15%
20%
25%
1970
1974
1978
1982
1986
1990
1994
1998
2002
2006
2010
2014
Share of imported IC in total IC
Share of imported products in FD
Figure 9: Share of imported intermediate consumption (IC) in total intermediate consumption and share of imported products in final demand (FD). Source: authors’ computations with data from Eora 199.82 Input-Output database. Shares with data at basic prices are exhibited but results with data at purchaser prices indicated very similar trends and shares of the same magnitude (slightly lower).
The increasing internationalization of French capitalism as illustrated on figures 4-9 is
identi-284
fied by RT as one of the main cause of Fordism’s crisis from the mid-1970s. After infrastructures
285
and capital stocks in key sectors were reconstituted, the domestic market alone became
insuf-286
ficient to support high returns to scale, as shown by slowing productivity gains from the
mid-287
1960s/early-1970s onwards. Exports then appeared as a mean to sustain the accumulation regime
288
based on increasing returns. The average annual growth rate between 1960 and 1968 is 11% for
289
imports and 7.8% for exports (Balladur, 1972, p. 13). Therefore, internationalization in the
290
1960s initially opened up new growth opportunities and exports complemented domestic wages
291
in the composition of effective demand steering the accumulation regime. However, the increasing
292
importance of exports relatively to wages for steering growth turned price-competitiveness into
293
a major concern of exporting firms (Boyer, 2015; Loiseau et al., 1977; Vidal, 2003). Guillaumet
294
(2002) finds that, between 1850 and 2000, trade had a positive effect on growth only between
295
1957 and 1974. The productivity gains-wages increases-domestic mass consumption loop
under-296
lying the fordist social compromise was then broken and domestic wages became an adjustment
297
variable. All the more so after the collapse of Bretton Woods and the emergence of the European
298
monetary integration from 1972 onwards, with gradual constraints on exchange rates.
299
Alongside the rise of international trade, finance-led capitalism started to emerge through
300
liberalization of international financial flows and the financialization of high income capitalisms.
French capitalism experienced concomitant internationalization — first through the growing
302
importance of trade, then through the offshoring of production and integration into global value
303
chains — and deep transformation in its financial structure (Morin, 2000).
304
The systemic complementarity between financialization and offshoring has thus been
instru-305
mental in producing a new accumulation regime, together with the emergence of a new mode
306
of regulation that involves deep transformations in the wage-labour nexus13. The growth of the
307
invisible trade flows from the 1970s (figures 4-7) is a consequence of this macroeconomic process.
308
The evolution of the distribution of GVA of non-financial corporations in France substantiates
309
this comprehension. We approach financialization through the evolution of the wage and the
310
profit shares in GVA and through financial accumulation.
311
We look at the non-financial corporations (NFCs). Indeed, we assume NFCs to be the main
312
users of materials through intermediate consumption (between 1950 and 2015, the share of NFCs
313
in total intermediate consumption in monetary terms oscillates between 74 and 83 %, with an
314
increasing trend since 199714). Four stylized facts characterize the financialization of French
315
NFCs as shown on figure 10.
316
13This institutional form began shifting towards capital in labour-capital relations. The other key institutional forms of RT’s framework include: the monetary regime, the forms of competition, the form of the state, and the insertion into the international regime. Needless to say, they also underwent transformations in the shift from Fordism to Neoliberalism. A sixth one is currently being discussed: the social relation to the environment Cahen-Fourot (2020).
20% 30% 40% 50% 60% 70% 80% 1950 1954 1958 1962 1966 1970 1974 1978 1982 1986 1990 1994 1998 2002 2006 2010 2014
NFCs, wage share vs. profit rate
Wage share Margin rate
19% 21% 23% 25% 27% 29% 31% 33% 35% 37% 39% 1950 1954 1958 1962 1966 1970 1974 1978 1982 1986 1990 1994 1998 2002 2006 2010 2014
NFCs, margin vs. investment rates
Margin rate Investment rate
0% 5% 10% 15% 20% 25% 30% 35% 40% 1950 1954 1958 1962 1966 1970 1974 1978 1982 1986 1990 1994 1998 2002 2006 2010 2014 NFCs, capital returns
Paid, % of GVA Received, % of GVA Paid nets of received, % of GVA 40% 60% 80% 100% 120% 140% 1995 1999 2003 2007 2011 2015 NFCs, financial assets
in % of non-financial assets in % o fixed assets
Figure 10: Wage share (compensation of employees / GVA), margin rate (gross operating surplus / GVA), investment rate (GFCF / GVA), capital returns and financial assets of non-financial corporations, 1950-2015. Capital returns paid and received are the sum of, respectively, paid and received distributed income of corporation (mainly dividends) and interests. Source: Authors’ calculations from OECDStat data.
The wage share exhibited a slow increase during most of Fordism then increased more in late
317
Fordism and decreased after the oil shocks period, stabilizing during Neoliberalism at a level
318
lower than during Fordism. Symmetrically, the margin rate experienced a decrease from 1950 to
319
the early 1980s, followed by an increase afterwards until the end of the 1980s, then stabilizing
320
at the early Fordism level. The strongest increase in the margin rate is observed at the onset of
321
neoliberal capitalism. What was lost in profit share during Fordism is regained in less than ten
322
years.
323
Second, we observe a decoupling of the margin and gross fixed capital formation rates. From
324
1980 onwards, the close correlation between the two series is broken and they increasingly diverge.
325
The investment rate oscillates at a level appreciably lower than during the core of the fordist era
326
and does not follow the increase in the profit share. In line with most studies of financialization,
327
this indicates that the increase in the profit share does not fuel investment in productive capital
328
domestically.
329
Third, an increasing share of GVA went back to financial capital, in the form of interests and
330
dividends (added together as capital returns on figure 10), which form the distributed profit15.
331
15This trend would be even stronger if stocks buybacks, a major feature of the shareholder value maximization orientation (Auvray and Rabinovich, 2019), were taken into account.
Capital returns paid continuously increased from the late 1960s to 2008, followed by capital
332
returns received. After the early 1990s, the capital returns paid net of capital returns received
333
decrease as NFCs’ financial income gets closer to their distributed profit. This highlight the
334
importance of considering gross as much as net flows. It should not be interpreted as a process of
335
decreasing financialization but rather as another dimension of financialization: Financial income
336
becomes increasingly important for NFCs, which behave more and more like financial investors
337
rather than as producers. This increasing trend exemplifies the shift in corporate strategies
338
from “retain and reinvest” to “downsize and distribute” corporate governance (Lazonick and
339
O’Sullivan, 2000).
340
Fourth, this observation is further substantiated by the accumulation of financial assets,
341
whose proportion as compared to fixed assets exhibited a rising trend with important fluctuations
342
during the internet bubble and the subprimes crises. This process of financial accumulation is
343
a well-known stylized fact in the literature on financialization (Krippner, 2005; Stockhammer,
344
2004). Unfortunately, the data on financial assets are only available from 1995 onwards, which
345
limit our historical hindsight. The data nonetheless indicates an increasing financial capital
346
accumulation as compared to productive capital accumulation. Kovacic et al. (2018) refer to this
347
as an increasing financial intensity when looking at the financial assets / value added ratio16. Of
348
course, financial assets prices tend to inflate while non-financial assets can depreciate, especially
349
fixed assets (e.g. productive capital). The evolution of these latter ratios can then be partly
350
attributed to the appreciation of financial assets prices. This still shows a financial accumulation
351
in the form of capital gains. Interestingly, however, the evolution is much less clear when
non-352
produced non-financial assets are also considered.
353
Financialization is deeply linked to the reorganization of production along global value chains
354
and to the restructuring of production in high income countries (Ivanova, 2019). The decrease
355
in production costs enabled by globalization allowed parent firms controlling global value chains
356
to maintain or increase margin rates in a context of price stagnation in their domestic markets.
357
Conversely, shareholders seeking short term returns and managers incentivized by non-wage
in-358
come like stock-options led firms to enter into active cost-reduction strategies, especially through
359
spread production along global value chains. Conflictuality in capital-labor relations increased:
360
Capital owners and managers gained new avenues for leverage over weakening labor unions and
361
workers taking part in a global labour market (Freeman, 2007) with uneven environmental, wage
362
and labor standards. Together with the decline of industry and the rise of unemployment in their
363
home countries, costs-reduction strategies led to a reduced need for reinvesting profits. They were
364
available for financial accumulation and shareholder value maximization through dividends and
365
stock buybacks. The offshoring-financialization nexus can therefore be comprehended together
366
as forming a successful attempt at restoring the profit share after the fordist era of increasing
367
wages and intensive productive investment in high income countries (Auvray and Rabinovich,
368
16We prefer to look at the financial assets relatively to non-financial and fixed assets as it is a comparison between stocks rather than between a stock — the financial assets at time t and a flow — the value added at time t.
2019; Durand and Miroudot, 2015; Fiebiger, 2016; Ivanova, 2019; Milberg, 2008; Milberg and
369
Winkler, 2010).
370
4
The dialectics between socio-metabolic and
accumula-371
tion regimes: a tentative discussion
372
These observations remain descriptive and shed little light on the causal mechanisms linking
373
socio-metabolic and accumulation regimes. RT prioritized endogenous factors that initially
en-374
sured Fordism’s success in its analysis of the crisis (Lordon, 2002). Therefore, RT did not
375
integrate material flows for they were considered exogenous factors, e.g. oil17. This
epistemolog-376
ical stance entailed blindness to the role of materials in supporting accumulation regimes and in
377
shaping institutional compromises of the mode of regulation.
378
In what follows, we attempt at contributing to remedy this incompleteness. We discuss how
379
cheap and abundant oil allowed for the high productivity gains and mass consumption norms
380
at the basis of the fordist social compromise and how materials may be instrumental in shaping
381
modes of regulation.
382
4.1
Power of matter: The economic role of materials in underlying
383
accumulation regimes
384
As we recalled in section 3, productivity gains were the cornerstone of the fordist social
com-385
promise through supporting a “virtuous circle” of mass production, mass consumption and high
386
growth accompanied by wage increases, long term employment relations and strong
redistribu-387
tion mechanisms. The high productivity gains of the fordist era did not come out of the blue:
388
Cheap and abundant oil was key in enabling them (Cahen-Fourot and Durand, 2016). This is in
389
particular true for agriculture and industry.
390
Agriculture experienced the most dramatic changes during Fordism. In 1945, more than 7.5
391
million people — over a third of the working population — worked in this sector and the country
392
had difficulty feeding the population (ration stamps were maintained until 1949). Successive
393
governments encouraged a strong recovery in production, which required an improvement in
394
productivity. This was possible through cheap oil imports that allowed for strong mechanization
395
and massive use of fossil-based inputs, e.g. fertilizers. As a consequence, from 1950 to 1974,
396
the agricultural population decreased from 29% to 10% of the total working population (Allaire,
397
1988). Agriculture lost an average of 135 000 jobs per year between 1944 and 1973.
398
Intensification of agriculture and the increase in biomass production enabled by oil were key
399
in the internationalization that complemented domestic demand in supporting the fordist social
400
17According to Huber (2013, p. 178), Aglietta had recognized the significance of energy to the emerging US fordist mode of mass production in his book of 1979: “A condition of its success was a revolution in energy which
generalized the industrial use of electricity and made possible the construction of high capacity motors which enormously increased the power available to industry.”
compromise until the beginning of the 1970s. Agricultural exports enabled the trade balance
401
to be in equilibrium between 1960 and 1968 together with the automotive industry. In the late
402
1960s, exports growth was mainly due to exceptionally high exports of agricultural products while
403
growth in exports of industrial products had slowed down (Balladur, 1972; de Ravignan, 1980).
404
The orientation of agriculture towards exports and its specialization steered high productivity
405
gains that freed up labour absorbed by the industrial sector. Material intensive industries, e.g.
406
mining, metallurgy and the automotive industry, applying taylorist techniques, steered high
407
productivity gains in the manufacturing sector that formed the backbone of the fordist social
408
compromise. Automotive industry’s exports were largely in surplus and amounted for most of
409
the trade surplus for the period 1959-1973 (Mistral, 1975).
410
Nonetheless, mass production alone is not sufficient to stabilize an accumulation regime.
411
A key feature of an accumulation regime is the correspondence between production and the
412
social demand. Mass production had mass consumption as a counterpart, which allowed for the
413
“virtuous circle” of Fordism. Fordist mass consumption norms were also shaped by fossil fuels.
414
The centrality of oil to postwar mass consumption was both direct and indirect. Not only was it
415
the material basis entering countless products (e.g. plastics, clothing, medicine). Its centrality as
416
transportation fuel ensured that even if products were not made with petroleum products, they
417
were distributed and consumed via petroleum-based modes of mobility (Huber, 2013). Oil was
418
key on both sides — production and consumption —, steering the use and production of other
419
materials, e.g. biomass and metals. Through supporting the advent of mass production and mass
420
consumption, materials were thus instrumental in the increase of living standards and upward
421
social mobility of the fordist era in France, which generated a high level of social consensus
422
(Brand and Wissen, 2013).
423
The transition to the more intensive neoliberal accumulation and socio-metabolic regime has
424
in no way meant a rupture with the extensive and fossilist fordist regime. This is especially true
425
for the mode of living, that is the “dominant patterns of production, distribution, and consumption
426
that are deeply rooted in the everyday practices of the upper and middle classes of the global
427
North and increasingly in the emerging countries of the global South” (Brand and Wissen, 2012,
428
p. 548). Rather, the more domestic materiality of French capitalism inherited from Fordism is
429
partly substituted for and partly complemented by the more offshore materiality of the neoliberal
430
accumulation regime. Therefore, in terms of socio-metabolic evolution, it seems more relevant
431
to speak of a metabolic addition than of a metabolic transition between the two regimes18.
432
Interestingly, in the US case, high productivity gains created stronger pressures for an equally
433
energy-intensive geography of consumption. The persistence of “petro-capitalism” is mainly due
434
to the wider embeddedness of oil-dependent consumption norms (Huber, 2013). This is also
435
valid for France, though without domestic mass production. Financialization, through reinforcing
436
offshoring, is enabling to maintain an “imperial mode of living” that is the patterns of production
437
18This is coherent with scholarship in environmental history showing that there was never a global energy transition in history but merely energy additions to the pre-existing energy mix (Bonneuil and Fressoz, 2016). This is also consistent with the longue durée socio-metabolic regimes mentioned in footnote 6.
and consumption that disproportionately rely on global labour power, resources and sinks (Brand
438
and Wissen, 2013).
439
4.2
Matter of power: The political role of materials in shaping modes
440
of regulation
441
Despite their role in sustaining the fordist social compromise, materials had ambiguous effects on
442
the institutionalized compromises regulating the accumulation regime. To some extent, materials
443
were therefore also instrumental in the shift towards Neoliberalism (Cahen-Fourot and Durand,
444
2016; Debeir et al., 2013; Huber, 2013; Mitchell, 2011).
445
Workers’ ability to control the production and distribution of key material flows were crucial
446
in the advancement of socio-political rights and in the emergence of welfare states in some
447
western countries. Coal exploitation was highly labour intensive and allowed workers to push
448
their agenda, especially in the UK and France. First, coal extraction required high concentration
449
of workers, which made mass social movements and the emergence of organized labour easier.
450
Second, they had the expertise as they worked autonomously deep underearth. Third, coal was
451
distributed by railroads, which enabled railways workers to block its distribution and hence the
452
source of energy of the economy. In other terms, through the characteristics of its exploitation,
453
coal fostered workers’ structural and associational powers. The first results from a strategic
454
location in the supply chain while the second results from the collective organization of workers.
455
These three features of coal exploitation therefore gave bargaining power to workers and proved
456
instrumental in the emergence of the French welfare state (Debeir et al., 2013; Mitchell, 2011;
457
Wright, 2000). The latter was to be at the core of the fordist accumulation regime: without the
458
enactment of collective agreements and social security, mass consumption could not have been
459
deployed as a necessary counterpart to mass production.
460
Coal mines were nationalized in 1946 (creation of the public establishment Charbonnages de
461
France) and coal production was made a national priority (noticeable in the first French Plans).
462
Though decreasing, coal still dominated the energy mix until 1963. In 1958, France produced 59
463
Mt of coal and the country had about 145 000 miners. The transition from coal to oil — from
464
a domestic material to an imported commodity — clearly impacted the fordist regime. The low
465
price of oil implied overproduction of coal in the late 1950s. This resulted in the Jeanneney Plan
466
(1959) that explicitly decided to decrease coal production and to reduce the workforce in this
467
sector by closing several coal mines and investing in new oil refineries. In 1962, only two years
468
after the Plan was launched, coal production declined to 52 Mt and the workforce to 120 000.
469
The addition of oil to the energy mix and its progressive emergence as the main energy
470
carrier had ambiguous effects on the mode of regulation. In contrast to coal, oil extraction
471
and distribution are not labour intensive and oil was mainly imported. The peculiarities of oil
472
exploitation decreased the energy workers’ power to push further socio-political demands. There
473
is thus an oil paradox: While cheap and abundant oil enabled the productivity gains providing
474
the foundations of the fordist social compromise, it shifted the power balance between labour
and capital, thus laying the ground for the mutation of the wage-labour nexus that had been at
476
the core of Fordism (Cahen-Fourot and Durand, 2016; Mitchell, 2011).
477
Beyond coal and oil, material intensive industries also conferred strong structural and
asso-478
ciational powers upon workers (Silver, 2003; Tronti, 1977; Wright, 2000). In the 1960s, France
479
ranked fourth among European steel producers with approximately 20 Mt. There were more
480
than 100 000 workers in the steel sector in the Lorraine region alone, whereas there are less than
481
8000 nowadays (Raggi, 2013). The harmful nature of the work and the high costs of extraction
482
lead to substituting imports to domestic production. The decline began in the 1960s with steel
483
from Lorraine losing attractiveness because of imported minerals exhibiting cheaper cost and
484
higher concentration in iron, up to 50-60%. Globalization made price competitiveness key and
485
signalled the shift in French capitalism internationalization from exports complementing
domes-486
tic demand to offshoring of heavy industries’ production. In the aftermath of Fordism, heavy
487
industries concentrating unionized workers and materials were relocated to a great extent. The
488
end of coal and iron ore mining undoubtedly weakened workers. Together with oil, it paved the
489
way for the transformation of the wage-labour nexus and the challenging of the fordist social
490
compromise that would result in the advent of a new mode of regulation supporting the neoliberal
491
accumulation regime.
492
As mediating tools in the labour-capital relation, materials are instrumental in shaping
insti-493
tutionalised compromises emerging from social struggles and in enabling transformations in the
494
modes of regulation supporting accumulation regimes. Drawing from Cahen-Fourot and Durand
495
(2016), we suggest that the offshoring-financialization nexus affected the mediating role of
mate-496
rials in the labour-capital relation through triggering the relocation of key material flows abroad.
497
Our hypothesis is that the offshoring-financialization nexus reduced the power of French workers
498
to push their socio-political agenda in decreasing their ability to control the use, production and
499
distribution of key material flows. In a self-reinforcing loop, this loss in structural and
associa-500
tional powers — exemplified by the decrease in the wage share and in the unionization rate, that
501
went from 30% in 1949 to 17-20% between 1960 and 1975 and then to around 11% in 201619 —
502
may have in turn affected the ability of workers to oppose the process of financialization and the
503
offshoring of industries20.
504
Although this paper does not attempt at properly testing this hypothesis, table 3 gives
505
indications regarding the direction of the relation between the key series we presented. Most
506
notably, the wage share is significantly negatively correlated with several variables highlighting
507
the offshoring-financialization nexus such as capital returns paid and received by NFCs, the shares
508
of imported intermediate consumption in total intermediate consumption and imported goods
509
in final demand and with the non-fossil raw trade balance. Other variables exhibit very high
510
19According to the long time series on unionization from the French ministry of labour, https://dares. travail-emploi.gouv.fr/IMG/xlsx/taux_syndicalisation_2016_5oct2018.xlsx, accessed February 25th, 2020. 20Another example of the persistence of deindustrialisation is the textile industry that lost two thirds of its jobs and half of its production in the last twenty years. France now imports massive quantities of shoes and wearings and exports luxury products or high value added commodities. The report is available here: https: //www.insee.fr/fr/statistiques/3632345
significant correlations between each other, illustrating the systemic complementarity between
511
financialization and offshoring and their close relation with the relocation of material flows.
512 Pearson pair-wise correla-tions Wage share Capital returns paid Capital returns received Imported IC in total IC Imported goods in final demand Total RTB Non-fossil RTB DMC/DE MF/DE Wage share — -0.33*** -0.33*** -0.27*** -0.33*** -0.28** Capital returns paid -0.33*** — 0.97*** 0.86*** 0.90*** 0.88*** 0.95*** 0.82*** 0.87*** Capital returns received -0.33*** 0.97*** — 0.89*** 0.91*** 0.78*** 0.94** 0.76*** 0.81*** Imported IC in total IC -0.27*** 0.86*** 0.89*** — 0.99*** 0.85*** 0.89*** 0.81*** 0.86*** Imported goods in final demand -0.33*** 0.90*** 0.91*** 0.99*** — 0.87*** 0.90*** 0.83*** 0.87*** Total RTB 0.88*** 0.78*** 0.85*** 0.87*** — 0.92*** 0.98*** 0.98*** Non-fossil RTB -0.28** 0.95*** 0.94** 0.89*** 0.90*** 0.92*** — 0.85*** 0.95*** DMC/DE 0.82*** 0.76*** 0.81*** 0.83*** 0.98*** 0.85*** — 0.97*** MF/DE 0.87*** 0.81*** 0.86*** 0.87*** 0.98*** 0.95*** 0.97*** —
Table 3: Pearson pairwise correlations between the wage share, capital returns paid and received, imported intermediate consumption in total intermediate consumption, imported goods in final demand, total raw trade balance, non-fossil fuels raw trade balance, DMC to DE and MF to DE ratios. Cells left blank are non-significant correlations. Significance threshold set up at 10% with 1% (***) and 5% (**).
We argue, therefore, that accumulation and socio-metabolic regimes combine with each other
513
and are both the product of a given mode of regulation whose evolution is in turn partly shaped
514
by accumulation and material flows dynamics.
515
5
Conclusion
516
This paper aims at bringing together MFA and RT to provide a descriptive picture of French
517
capitalism since 1948 in some of its physical and socio-economic dimensions. We first show
518
that the fordist and neoliberal accumulation regimes translate into socio-metabolic regimes. The
519
fordist accumulation regime is an extensive socio-metabolic regime at both domestic and footprint
520
levels. The neoliberal accumulation regime translates into an intensive socio-metabolic regime at
521
the domestic level and into a weakly extensive one at the footprint level. Moreover, the shift from
522
Fordism to Neoliberalism did not imply a change in the mode of living. The offshore materiality
523
of Neoliberalism partly substituted for and partly complemented the more domestic materiality
524
inherited from Fordism. In socio-metabolic terms, the shift of accumulation regime is thus an
525
metabolic addition rather than a metabolic transition.
526
Second, we attempt at linking the shift from Fordism to Neoliberalism and the
offshoring-527
financialization nexus with the evolution of the material basis of French capitalism. We discuss
528
tentatively how the offshoring of production and the financialization of French non-financial
529
corporations, the disappearance of coal and the shrinking of heavy industries might have affected
530
the mediating role of materials in the labour-capital relation and the structural and associational