HAL Id: in2p3-00144999
http://hal.in2p3.fr/in2p3-00144999
Submitted on 30 May 2007
HAL is a multi-disciplinary open access
archive for the deposit and dissemination of
sci-entific research documents, whether they are
pub-lished or not. The documents may come from
teaching and research institutions in France or
abroad, or from public or private research centers.
L’archive ouverte pluridisciplinaire HAL, est
destinée au dépôt et à la diffusion de documents
scientifiques de niveau recherche, publiés ou non,
émanant des établissements d’enseignement et de
recherche français ou étrangers, des laboratoires
publics ou privés.
Mass measurements of neutron-rich nuclei near the
N=20 and 28 shell closures
B. Jurado, H. Savajols, W. Mittig, N.A. Orr, P. Roussel-Chomaz, D.
Baiborodin, W.N. Catford, M. Chartier, C.E. Demonchy, Z. Dlouhý, et al.
To cite this version:
B. Jurado, H. Savajols, W. Mittig, N.A. Orr, P. Roussel-Chomaz, et al.. Mass measurements of
neutron-rich nuclei near the N=20 and 28 shell closures. Physics Letters B, Elsevier, 2007, 649,
pp.43-48. �10.1016/j.physletb.2007.04.006�. �in2p3-00144999�
Closures
B. Juradoa∗, H. Savajolsa, W. Mittiga, N.A. Orrb, P. Roussel-Chomaza D. Baiborodinc, W.N.
Catfordd, M. Chartiere, C.E. Demonchya, Z. Dlouh´yc, A. Gillibertf, L. Giota, A. Khouajaa, A.
L´epine-Szilyg, S. Lukyanovh, J. Mrazekc, Y.E. Penionzhkevichh, S. Pitaa, M. Rousseaua, A.C. Villaria aGANIL, BP 5027, 14076 Caen Cedex 05, France
bLPC-Caen, ENSICAEN, IN2P3-CNRS et Universit´e de Caen,14050 Caen cedex, France cNPI, ASCR, 250 68 ˇReˇz, Czech Republic
dDept. of Physics, University of Surrey, Guilford, GU27XH, UK e Dept. of Physics, University of Liverpool, Liverpool L69 7ZE, UK fCEA/DSM/DAPNIA/SPhN, 91191Gif-sur-Yvette, France
gIFUSP-Universidade de S˜ao Paulo, C.P. 66318, 05315-970 S˜ao Paulo, Brazil hFLNR, JINR, Dubna, P.O. Box 79, 101 000 Moscow, Russia
Mass measurements of very neutron-rich nuclei near the N=20 and 28 shell closures are presented. Seven masses have been determined for the first time and the precision of 36 masses has been significantly improved. These results are used to investigate the evolution of the odd-even staggering of binding energies with neutron number. Special attention is paid to the evolution of the N=28 shell closure as the neutron dripline is approached. Changes in shell structure are observed around N=28 for the P and S isotopes but not for Si. This may be interpreted as a persistence of the shell closure at N=28 or as the result of a very sudden onset in deformation at42
Si.
The mass of a quantum mechanical system, such as the nucleus, is a fundamental quantity as it reflects the sum of all forces acting on it. Of particular interest are direct mass measure-ments far from the valley of stability (such as those described in this work) which permit tests of the reliability of nuclear mass models to be made and studies of the evolution of shell or sub-shell closures and correlations to be undertaken. However, the direct measurement of masses far from stability presents significant technical chal-lenges. The principal one being the limited pro-duction cross sections. In addition, exotic nu-clides are by definition very short lived. The development of a fast measurement technique is therefore imperative, but such technique must
∗Corresponding author: jurado@cenbg.in2p3.fr, present
address: CENBG, F-33175 Gradignan, France
also be of sufficiently high resolution to make pre-cision measurements. In the present work we de-scribe how the time-of-flight technique using the SPEG spectrometer [1] at GANIL has been im-proved in order to determine the masses of very neutron-rich nuclei in the vicinity of N=20 and 28. The results are then used to study the evolu-tion of the odd-even staggering (OES) of nuclear masses with neutron number. When represent-ing nuclear masses as a function of the neutron number one observes that even-neutron-number nuclei are more strongly bound than their odd-neutron-number neighbours. The OES originates from two fundamental physical mechanisms: the breaking of the mean-field spherical symmetry and pairing correlations [2]. Both mechanisms are strongly influenced by the number of neutrons. For instance, it is now well established that
2 B.Jurado, et al.
formation effects are responsible for the vanishing of the N=20 shell closure for the very neutron-rich sodium and magnesium isotopes (see, for ex-ample, refs. [3–5]). Particle correlations occur mostly in a narrow zone of the phase space around the Fermi surface. In drip-line nuclei the Fermi surface is very close to the single-particle con-tinuum. Consequently, the scattering of virtual pairs into the continuum has to be considered. The increase in neutron-pairing correlations as the neutron binding energy decreases seems to be a quite general result of calculations that include continuum effects (see for example refs. [6–9]). Our results also provide key information to in-vestigate the evolution of the N=28 shell closure when approaching the neutron dripline. Defor-mation effects and the vanishing of the spin-orbit force could cause an erosion of this shell closure for very neutron-rich nuclei. Finally, our results will be used to check the predictive power of sev-eral mass formulas.
For direct mass measurements of exotic nuclei three main issues have to be faced: the produc-tion rates, the mass resoluproduc-tion and the system-atic errors. A series of earlier mass measure-ments [10] (and refs. therein) has shown that this can be achieved at GANIL by combining a time-of-flight (TOF) technique with the high-resolution energy-loss spectrometer SPEG. The very broad elemental and isotopic distributions resulting from heavy-ion projectile fragmentation reactions combined with fast in-flight magnetic selection allows the mapping of an entire region of the nuclear mass surface in a single measurement. Compared to other mass measurement methods, the availability at GANIL of very intense neutron-rich beams (such as48Ca) together with the
rela-tively high transmission rates through the SISSI device [11] and the alpha-spectrometer2 enables
measurements to be made far from stability with reasonable yields. Nuclei with lifetimes as short as the flight time through the system of ∼ 1µs can be measured. The nuclei investigated here were produced by fragmentation of a 48Ca beam of 4
µAe at 60.3·A MeV on a Ta target. The TOF
2
A feature arising from the strong forward focusing of the fragmentation products.
technique requires the simultaneous determina-tion of the masses of well-known nuclei for cali-bration. Consequently, apart from the neutron-rich nuclei of interest, it is of great importance to measure simultaneously a broad range of ref-erence nuclei. To achieve this, a Ta production target with three different thicknesses and two magnetic rigidities of the beam line and spectrom-eter were employed. In addition, a thin (25 µm) Be achromatic degrader was placed at the disper-sive focal plane of the alpha spectrometer. In this manner, the light ions that caused saturation and pile-up in the detection system in previous mea-surements were eliminated. As a consequence, the 48Ca beam intensity could be increased by
more than one order of magnitude with respect to the previous experiment [10].
The principle of mass determination by means of the TOF technique relies on the relation be-tween the magnetic rigidity, Bρ, and the veloc-ity, v, of an ion of rest mass, m0, and charge, q,
traversing an achromatic system: Bρ = γm0v/q,
where γ is the Lorentz factor. A precise measure-ment of the magnetic rigidity and the velocity allows the ratio m0−exp/q (where m0−exp is the
experimental value of the mass of the ion) to be deduced. Once the ion has been identified in A, q and Z, m0−exp can be extracted. The velocity
of the ions is obtained from the TOF measure-ment. Detailed descriptions of the technique may be found in [10] and refs. therein.
The atomic mass excesses are obtained by means of a multidimensional fit where the mass excess is expressed as a Taylor series development of the form (for q = Z),
Mj(A, Z) = Z(m 0−exp/Z + αj1+ α j 2AZ) + α j 3A + αj4Z + f1j(AZ, A2, Z2,A2 Z2, A3, ...) + f j 2(∆E)
The constant αj1and the first order terms serve
to transform m0−expinto the atomic mass excess.
The function f1j, which is a linear combination of higher-order terms in A, Z, A/Z and AZ, and the energy-loss (∆E) dependent function f2j are re-quired to correct for the systematic uncertainties associated with the technique. In contrast to pre-vious experiments where no achromatic degrader was employed, higher order terms were required here to correct for the associated aberrations.
The coefficients of the fit αji are obtained by min-imizing the difference between the experimental and the adopted reference mass excesses of the 2003 atomic-mass evaluation [12]. The unknown masses are then determined using the coefficients and functions from the best fit. The uncertain-ties associated with such a determination arise not only from the statistical uncertainty, but also from the need inherent in the method to inter-polate between and extrapole from the reference masses, as well as the systematic uncertainties which are a measure of the limiting precision of the measurement. In the present work a number of independent measurements3were made
result-ing in up to 5 independent mass determinations (denoted by the index ”j”) for many of the nu-clei. Each measurement was analysed separately following the procedure outlined above. The un-certainty ∆Mj(A, Z) for each measurement was
determined from the combination in quadrature of the statistical and the systematic errors. The statistical error varied from a few tens of keV for nuclei situated close to the line of stability, to around 1 MeV for nuclei in the vicinity of the neutron dripline where the production rates were very low. The systematic error for each of the measurements was estimated to be 150 keV. The final mass excesses, M (A, Z), quoted in Table 1, are the weighted means of the masses derived from each of the independent measurements. In the present experiment several combinations of higher order terms allowed acceptable fits (as de-fined by the chi-squared per degree of freedom) to be obtained. The variations in the masses de-rived from these fits provided a measure4 of the
uncertainty arising from the extrapolations noted above. The uncertainty in the adopted mass ex-cesses (Table 1) was thus derived as the combina-tion in quadrature of that of the weighted mean and that determined for the extrapolation. The results of the analysis described above are listed
3
These corresponded to runs with different settings of the rigidty of beamline and spectrometer, together with a par-allel chain of electronics.
4
Estimated by calculating the dispersion between the results of the acceptable fits Mi
(A, Z) and the final adopted mass excesses – ∆Mext(A, Z) =
pP
i(M (A, Z) − M i
(A, Z))2
.
in Table 1, where seven new masses can be seen to have been determined: 23N,31Ne,35Mg,36Mg, 42Si, 44P and 47Cl. In addition, the precision of
36 masses has been considerably improved with respect to the compilation of ref. [12]. No statisti-cally significant discrepancies between our results and the 2003 atomic-mass evaluation [12] are ob-served to occur.
The one-neutron separation energy S1n is the
most straightforward observable reflecting the OES of binding energies. It is defined as:
S1n(A,Z) = [M(A-1,Z) - M(A,Z) + Mn]c2
where Mn is the neutron mass excess. In
or-der to illustrate the odd-even staggering, figure 1 plots S1n(N) as a function of S1n(N-1) for four
isotopic chains. Two diagonal lines can be clearly distinguished. The upper line corresponds to nu-clei with an even neutron number (N) for the ordinate which are more strongly bound. The lower line corresponds to nuclei with an even neu-tron number (N-1) on the abscissa. The separa-tion between the two lines reflects the intensity of the odd-even staggering. Indeed, it is easy to see that if S1n(N)=const+δ for even N, and
S1n(N)=const for odd N, the points formed in
a diagram x=S1n(N-1) and y=S1n(N) will lie on
two lines, y = x -δ and y = x + δ. The sep-aration between these two lines is then equal to δ·√2. The nuclei with the lowest S1nare the most
neutron-rich ones. This original diagram is there-fore well suited to trace the dependence of the OES on binding energy. The OES staggering is often taken as an indicator of the strength of pair-ing correlations. As outlined above, most of the theories including continuum effects predict an increase in neutron pairing correlations with in-creasing N/Z. However, our results indicate that this does not translate to an increase in the OES. Instead, figure 1 shows an overall reduction of the OES when the binding energy decreases for Z=10 and 12. A strong attenuation of the OES close to the neutron dripline has been predicted for fluo-rine isotopes by [7]. As described in ref. [7], this does not imply a decrease in the pairing correla-tions as a decrease in the OES may result from the np-continuum coupling, even if pairing increases. Here, as noted above, we see such a reduction not only for Z = 10, 12 (figure 1) but also for the
4 B.Jurado, et al.
This work Ref. [12] Mean
23N 36680(860) 36680(860) 23O 14620(100) 14610(120) 14620(80) 24O 18500(110) 19070(240) 18600(100) 25F 11410( 90) 11270(100) 11350( 70) 26F 18680( 80) 18270(170) 18610( 70) 27F 24630(190) 24930(380) 24690(170) 27Ne 7020( 70) 7070(110) 7030( 60) 28Ne 11280(110) 11240(150) 11270( 90) 29Ne 18400(100) 18060(270) 18360( 90) 30Ne 23040(280) 23100(570) 23050(250) 31Ne 30820(1620) 30820(1620) 31Na 12520(110) 12650(210) 12550(100) 32Na 18810(120) 19060(360) 18840(110) 33Na 23420(350) 24890(870) 23630(330) 34Mg 8560( 90) 8810(230) 8590( 80) 35Mg 15640(180) 15640(180) 36Mg 20380(460) 20380(460) 34Al -3100( 80) -2930(110) -3040( 70) 35Al -220( 70) -130(180) -210( 70) 36Al 5950(100) 5780(210) 5920( 90) 37Al 9810(120) 9950(330) 9830(110) 38Al 16210(250) 16050(730) 16190(240) 39Al 20170(630) 21400(1470) 20360(580) 36Si -12370(110) -12480(120) -12420( 80) 37Si -6620( 90) -6580(170) -6610( 80) 38Si -4170( 70) -4070(140) -4150( 60) 39Si 2320( 90) 1930(340) 2290( 90) 40Si 5430(230) 5470(560) 5440(210) 41Si 12120(370) 13560(1840) 12170(360) 42Si 15160(580) 15160(580) 40P -8030(120) -8110(140) -8060( 90) 41P -4980( 80) -5280(220) -5020( 80) 42P 1010(210) 940(450) 1000(190) 43P 4680(370) 5770(970) 4820(346) 44P 9380(900) 9380(900) 40S -22940(120) -22870(140) -22910( 90) 43S -12070(100) -11970(200) -12050( 90) 44S -9100(140) -9120(390) -9100(130) 45S -3990(690) -3250(1740) -3890(640) 43Cl -24120(130) -24170(160) -24140(100) 45Cl -18360(100) -18360(120) -18360( 80) 46Cl -13810(160) -14710(720) -13850(160) 47Cl -8920(1000) -8920(1000) Table 1
Experimental atomic mass excesses (±uncertainties) in keV. In the last column the weighted mean of columns 2 and 3 is given.
oxygen isotopes (not shown). For all the other elements the OES attenuation is less evident and we observe a stabilisation in the OES when ap-proaching the neutron dripline. To illustrate this the Z=13 and 14 isotopic chains are also shown in figure 1, whereby the OES staggering gap is clearly apparent but for the lowest values of S1n
the separation between the two groups of data remains rather constant. This indicates that fea-tures other than correlations are important. For instance, the spin-isospin coupling, discussed in ref. [13], and thought to be responsible for the deformation effects around N=20, will introduce an effect dependent on the filling of shells.
0 5 10 15 20 0 5 10 15 20 S1n(N-1)/MeV 0 5 10 15 20 S1n (N)/MeV 5 10 15 20 Z=10 Z=12 Z=14 Z=13
Figure 1. S1n(N) as a function of S1n(N-1) where
N is the neutron number. The triangles are from the mass table [12], the diamonds and the squares represent the new and improved (respectively) re-sults measured in the present work.
Several theoretical studies have investigated how to separate the pairing and the mean-field contributions to the OES. The authors of refs. [2,14] proposed to extract the pairing contribu-tion to the OES from experimental data by using the three-point indicator:
∆3(N)=(-1)N[M(N-1)+M(N+1)-2M(N)]c2/2.
It was demonstrated in ref. [2], that the indica-tor ∆3evaluated for odd-N can be roughly
associ-ated with the pairing effect, while the differences of ∆3 at adjacent even and odd values of N
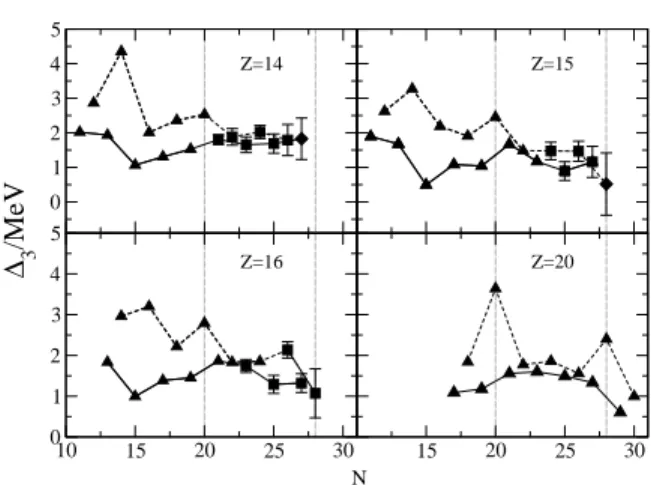
pro-vide information related to the spacing between single-particle levels, that is, information related to the mean-field contribution. The values of ∆3
calculated using the experimental masses tabu-lated in ref. [12] and the results of the present work are displayed in figure 2 as a function of neutron number for four isotopic chains. Let us first consider the case of Ca isotopes (Z=20). As the difference between ∆3 evaluated at adjacent
neutron numbers is sensitive to the single-particle energy differences, it peaks at the magic numbers N=20 and 28. The ∆3is almost constant between
N=20 and 28 because, for spherical nuclei, the single-particle energy is constant within a shell. At N=Z a strong jump in the ∆3 is observed for
all nuclei, and can be attributed to the Wigner term (see, for example, ref. [15]). The Si isotopes (Z=14) show a very similar behaviour to that of Ca between N=20 and 27, which indicates a regu-lar filling of the f7/2orbital. On the contrary, the
behaviour of the P (Z=15) and S (Z=16) chains is different from that of Ca. A local maximum ap-pears at N=26 rather than at N=28. Such an ef-fect at N=26 was already observed in our previous measurement and was attributed to deformation [10]. Owing to the reduction in the uncertainties in the masses for the most neutron-rich P and S isotopes, the effect at N=26 and the vanishing of N=28 as a shell closure have become considerably more apparent than in ref. [10]. Moreover, the present data clearly show that there is no such effect at N=26 for the Si isotopes.
Apart from the effects of deformation, an ero-sion of the N=28 shell closure could also result from a decrease in the spin-orbit interaction far from stability [16]. The case of42Si is of
particu-lar interest as it could be stabilised against defor-mation by the Z=14 sub-shell closure. Interest-ingly, the theoretical predictions for this nucleus are rather contradictory. On the one hand, shell model calculations suggest that42Si has the
char-acteristics of a doubly-magic nucleus such as48Ca
[17]. The same conclusion was reached in ref. [18], where the deformed configuration was found to be located 1 MeV above the ground state, whereas in other N=28 nuclei (such as40Mg) the
0 1 2 3 4 5 10 15 20 25 30 N 0 1 2 3 4 5 ∆ 3 /MeV 15 20 25 30 Z=14 Z=15 Z=20 Z=16
Figure 2. Experimental results for the three-point indicator ∆3as function of neutron number. The
same symbols are used as in figure 1. The dashed lines link the values of ∆3 for even-N nuclei and
the full lines for odd-N nuclei. The vertical lines indicate the position of N=20 and 28.
deformed intruder state is well below the closed shell. On the other hand, relativistic Hartree-Bogoliubov calculations predict a strong oblate deformed configuration for 42Si [19], in
agree-ment with relativistic mean field calculations with BCS pairing (RMF-BCS) [20] and with the re-sults of the latest version of the Skyrme-Hartree-Fock-Bogoliubov (HFB-9) model [21]. While refs. [19] and [20] predict a rapid transition from pro-late to obpro-late deformation at N=26, for HFB-9 [21] this sudden change in deformation arises at N=28, that is, when going from 41Si to 42Si.
From the experimental point of view the situa-tion is rather unclear as well. Gr´evy et al. have measured the β-decay half-lives of several Si iso-topes [22]. The short half-life of 42Si could only
be reproduced theoretically assuming a strongly deformed configuration. The present mass mea-surements of the most neutron-rich Si isotopes are important in order to confirm the conclusions of [22], because the Qβ influences to the fifth
power the lifetime. Contrary to the conclusions of ref. [22], high-energy two-proton removal cross sections populating 42Si from a 44S beam were
6 B.Jurado, et al. -1 0 1 2 3 4 5 15 20 25 30 N -1 0 1 2 3 4 5 Microscopic Energy/MeV 20 25 30 Z=14 Z=15 Z=20 Z=16
Figure 3. The microscopic correction as function of neutron number. The same symbols are used as in figure 1. The vertical lines indicate the position of N=20 and 28.
interpreted as a signature of the doubly magic character of 42Si [23]. However, in a more
re-cent article it was recognized that the two-proton knockout cross section populating42Si is not
sen-sitive to the size of the N=28 gap [24]. The mass of 42Si can clearly aid in shedding new light on
this question. From the mass measured in the present work one-neutron separation energies of 5.03±0.69 MeV (42Si) and 4.96±0.24 MeV (40Si)
were obtained. For the even Si-isotopes, the tab-ulated S1n decreases by about 1 MeV when going
to the next even isotope. One would then expect an S1nof about 4 MeV for42Si. Our results thus
suggest a possible increase in binding as would be expected from a shell closure. Figure 3 represents the microscopic energy as a function of neutron number for the same isotopic chains as in figure 2. The microscopic energy, a convenient quan-tity to inspect the presence of structure effects in nuclear masses, has been obtained by subtract-ing the macroscopic component (as given by the Finite Range Liquid Drop Model FRLDM [25]) from the experimental mass excess. The varia-tion of the microscopic energy as a funcvaria-tion of neutron number should exhibit deep minima at the shell closures. In figure 3 a strong change in
slope at N=20 and near N=28 can be observed for Z=20. However, the Z=15 and Z=16 isotopes do not show such features at N=28 and present instead a discontinuity in the slope at N=26, as observed in our earlier work [10]. This disconti-nuity is absent for the Z=14 isotopes. The similar behaviour of the microscopic energy for Z=14 and 20 could be considered evidence of a shell closure at N=28, in agreement with the discussion of the OES above. However, in a recent γ-spectroscopy experiment [26] evidence for a low lying 2+ state
in 42Si was found, which is not compatible with
such a picture. All these observations could be consistent, however, if deformation effects appear suddenly at N=28. 1 2 3 4 5 10 15 20 25 30 N 0 1 2 3 4 5 ∆ 3 /MeV 15 20 25 30 EXP HFB-9 RMF-BCS DZ
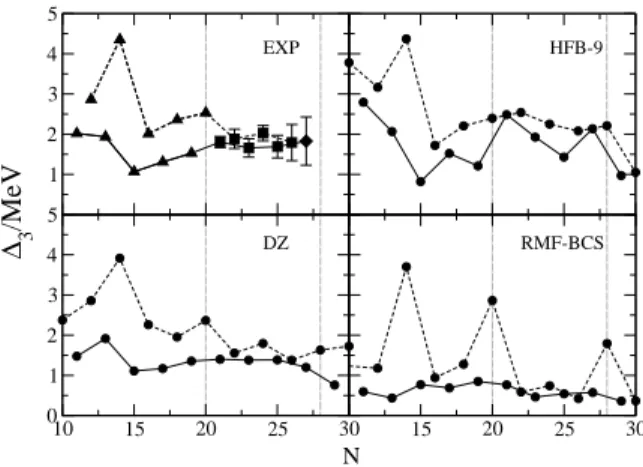
Figure 4. Experimental values of ∆3for the Z=14
isotopic chain in comparison with three different mass formulas (see text). The vertical lines indi-cate the position of N=20 and 28.
Reliable mass formulas that permit extrapo-lations to the unknown regions of the nuclear chart are important for many domains, such as nuclear astrophysics, and many mass formulas have been developed in recent years [27]. Our results provide new data to test the predictive power of different mass formulas when approach-ing the neutron dripline. In figure 4 we have compared our experimental values of ∆3 for the
Si isotopic chain with the HFB-9 mass formula [21], the Duflo-Zuker formula [28], and with the RMF-BCS model [20]. One can see that the best description is given by the Duflo-Zuker formula. This is also true for the other isotopic chains, in agreement with [27]. The HFB-9 model does, for example, not reproduce the shell closure at N=20 and, indeed, for N=21 and 22 it overpre-dicts the mass. For N >22 the differences between the HFB-9 mass formula and the data decrease. The values of ∆3 for odd-N derived from the
RMF-BCS calculations are systematically lower than the experimental results, probably owing to a weak pairing strength. The predictive power of this model could, therefore, be greatly improved by utilizing a better parametrisation of the pair-ing. The rms value of the differences between the masses listed in table 1 and the predictions of the FRLDM is 2.721 MeV, for the Duflo-Zuker for-mula 0.777 MeV, for HFB-9 1.11 MeV, and 1.73 MeV for the RMF-BCS model.
Finally, our results have also been employed to derive a new shell-model parametrisation for the s-d shell Hamiltonians, called USDA and USDB. As a result, a better agreement with experiment for binding energies and excitation energies in the region of24O has been found, with a reduction of
the rms deviation to around 0.13 MeV [29]. In conclusion, we have determined using a di-rect time-of-flight technique the masses of a broad range of neutron-rich nuclei situated in the vicin-ity of the N=20 and 28 shell closures. The masses of 7 nuclei have been measured for the first time and the precisions of 36 masses have been con-siderably improved, in many cases by more than a factor two. These results have been used to explore the evolution of the OES with neutron number, whereby we observe a clear reduction of the OES as the one-neutron separation energy decreases for the Z=8,10 and 12 isotopic chains. This effect needs to be carefully interpreted in order to establish the relative importance of pair-ing, spin-isospin couplpair-ing, and coupling to the continuum which may be needed to explain the observed behaviour. Our results also corroborate the changes in shell structure already observed for the P and S isotopes at the N=28 shell closure. In contrast, such effects are seen to be absent for the
Si isotopes. This could indicate either the persis-tence of the N=28 shell closure for the Si isotopes, or it may reflect a very sudden change in deforma-tion at N=28, as predicted by ref. [21]. To answer this question,42Si and neighbouring neutron-rich
nuclei need to be further investigated. Finally, our results have been used to test and suggest improvements to various mass models as well as derive an improved shell model interaction.
ACKNOWLEDGEMENTS
The authors would like to thank M. Yamagami for fruitful discussions and L. Gaudefroy for care-fully reading the manuscript. The untiring efforts of the SPEG crew (J.-F. Libin and P. Gagnant) in preparing the experiment are, as always, grate-fully acknowledged as is the effort of the GANIL cyclotron operations group in maintaining a high intensity48Ca beam and the SISSI device online.
REFERENCES
1. L. Bianchi et al., Nucl.Instrum. Meth. A276 (1989) 509.
2. W. Satula et al., Phys. Rev. Lett. 81 (1998) 3599.
3. C. Thibault et al., Phys. Rev.C12 (1975) 644. 4. E.K. Warburton et al., Phys. Rev. C41
(1990) 1147.
5. Y. Utsuno et al., Phys. Rev. C64 (2001) 011301(R).
6. J. Okolowicz et al., Phys. Rep. 374 (2003) 271.
7. Y. Luo et al., arXiv: nucl-th/0211068, M. Ploszajczak, priv. comm. and to be pub-lished.
8. M. Yamagami, Phys. Rev. C72 (2005) 064308.
9. M. Matsuo et al., Phys. Rev. C71 (2005) 064326.
10. F. Sarazin et al. Phys. Rev. Lett. 84 (2000) 5062 .
11. W. Mittig, Nucl. Phys. News 1 (1990) 30. 12. G. Audi et al., Nucl. Phys. A729 (2003) 3. 13. T. Otsuka et al. Phys. Rev. Lett. 87 (2001)
082502.
14. J. Dobaczewski et al., Phys. Rev. C63 (2001) 024308.
8 B.Jurado, et al.
15. P. Van Isacker et al., Phys. Rev. Lett. 74 (1995) 4607.
16. G.A. Lalazissis et al., Phys. Lett. B418 (1998) 7.
17. J. Retamosa et al., Phys. Rev.C55 (1997) 1266.
18. E. Caurier et al. Nucl. Phys. A742 (2004) 14. 19. G.A. Lalazissis et al., Phys. Rev. C60 (1999)
014310.
20. L. Geng, PhD Thesis, RCNP Osaka, 2005 un-published, and Prog. Theor. Phys. 113 (2005) 785.
21. S. Goriely et al., Nucl. Phys. A750 (2005) 425.
22. S. Gr´evy et al., Phys. Lett. B 594 (2004) 252. 23. J. Fridman et al., Nature 435 (2005) 03619. 24. J. Fridman et al., Phys. Rev. C 74 (2006)
034313.
25. P. Moller et al., At. Data Nucl. Data Tab. 59 (1995) 185.
26. S. Gr´evy et al., to be published.
27. D. Lunney et al., Rev. Mod. Phys. 75 (2003) 1021 and refs. therein.
28. J. Duflo et al., Phys. Rev. C52 (1995) R23. 29. B. A. Brown et al., Phys. Rev. C74 (2006)
![Figure 1. S 1n (N) as a function of S 1n (N-1) where N is the neutron number. The triangles are from the mass table [12], the diamonds and the squares represent the new and improved (respectively) re-sults measured in the present work.](https://thumb-eu.123doks.com/thumbv2/123doknet/12960839.376779/5.918.126.469.191.988/figure-function-triangles-diamonds-represent-improved-respectively-measured.webp)