Analytic framework for TRL-based cost and schedule models
byBernard El-Khoury
B.S. in Engineering, Ecole Centrale Paris (2009)
Submitted to the Engineering Systems Division in partial fulfillment of the requirements for the degree of
Master of Science in Technology and Policy at the
MASSACHUSETTS INSTITUTE OF TECHNOLOGY September 2012
s sT
SrrUTER 1
©Massachusetts Institute of Technology 2012. All rights reserved.
Author...
Technology and Policy Program, Engineering Systems Division August 22, 2012 C ertified by ... ... .. .
C. Robert Kenley Research Associate, Lean Advancement Initiative Thesis Supervisor
Certified by... ... .
Dekah Nightingale Professor of the Practice of Aeronautics and Astronautics and Engineering Systems Director, Sociotechnical Systems Research Center Thesis Supervisor
A ccepted by... ~.~...
Joel P. Clark Professor of Materials Systems and Engineering Systems Acting Director, Technology and Policy Program
Analytic framework for TRL-based cost and schedule
models
by
Bernard El-Khoury
Submitted to the Engineering Systems Division on August 22, 2012, in partial fulfillment of the
requirements for the degree of Master of Science in Technology and Policy
Abstract
Many government agencies have adopted the Technology Readiness Level (TRL) scale to help improve technology development management under ever increasing cost, schedule, and complexity constraints. Many TRL-based cost and schedule models have been developed to monitor technology maturation, mitigate program risk, characterize TRL transition times, or model schedule and cost risk for individual technologies as well technology systems and portfolios. In this thesis, we develop a 4-level classification of TRL models based on the often-implicit assumptions they make. For each level, we clarify the assumption, we list all supporting theoretical and empirical evidence, and then we use the same assumption to propose alternative or improved models whenever possible. Our results include a justification of the GAO's recommendations on TRL, two new methodologies for robust estimation of transition variable medians and for forecasting TRL transition variables using historical data, and a set of
recommendations for TRL-based regression models.
Thesis Supervisor: C. Robert Kenley
Title: Research Associate, Lean Advancement Initiative
Thesis Supervisor: Deborah Nightingale
Title: Professor of the Practice of Aeronautics and Astronautics and Engineering Systems Director, Sociotechnical Systems Research Center
Acknowledgments
I would like to express my gratitude to my supervisor, Bob Kenley, for his valuable comments, guidance, patience, and encouragement throughout my study. Without him constantly reminding me to
focus on the core topic and leave the other ideas for later research, this thesis would have never been
finished on time.
List of Abbreviations and Acronyms
AD2
: Advancement Degree of Difficulty AHP: Analytic Hierarchical Process
ANOVA: Analysis Of Variance
ATO: Acquisition Technology Objective Cl: Confidence Interval
CTE: Critical Technology Element
CSP trade space: Cost, Schedule, Performance trade space DAG: Defense Acquisition Guidebook
DoD: Department of Defense
DoE: Department of Energy
EA: Enterprise Architecting
EMRL: Engineering and Manufacturing Readiness Level
FY: Fiscal Year
GAO: Government Accounting Office HRL: Human Readiness Level
ID: Influence Diagram
ITAM: Integrated Technology Analysis Methodology
ITI: Integrated Technology Index
IRL: Integration Readiness Level
IRT: Independent Review Team
LRL: Logistics Readiness Level
MAE: Mean Absolute Error
MDAP: Major Defense Acquisition Program
MRL: Manufacturing Readiness Level
NASA: National Aeronautics and Space Administration NATO: North Atlantic Treaty Organization
NDI: Non-Developmental Item OFE: Objective Function of Error
PBTs TRL: Process-Based Technologies TRL
PRL: Programmatic Readiness Levels
R 2: statistical coefficient of determination
R&D3: Research and Development Degree of Difficulty
RMSE: Root Mean Squares Error
SRL: System Readiness Level
S&T: Science and Technology TM: Technology Maturity
TML: Technological Maturity Level
TNV: Technology Need Value
TPRI: Technology Performance Risk Index
TRA: Technology Readiness Assessment
TRL: Technology Readiness Level
TTRL: Technology Transfer Readiness Level
UDF: User-Defined Function (in Microsoft Excel) Xi.j: Transition time from TRLi to TRLj
WBS: Work Breakdown Structure
WSARA: Weapon Systems Acquisition Reform Act
Table of Contents
A b stra ct ... 3
Acknow ledgm ents...5
List of Abbreviations and Acronyms ... 7
Table of Contents. ... 9
List of Tables ... 12
List of Figures and.Re ean... 13
Chapter 1. Introduction and Research Motivation ... 16
Chapter 2. Research Scope ... 23
2.1 Placing this research in the larger context of risk m anagem ent ... 23
2.2 The choice of TRL-based cost and schedule m odels... 24
2.2.1 Reasons for choosing only Cost and Schedule risk types ... 25
2.2.2 Reasons for choosing TRL-based m odels only ... 27
Chapter 3. Technology M aturity and the TRL scale... 30
3.1 Technology m aturity...31
3.1.1 TRL's location in the technology lifecycle... 31
3.1.2 The m ultidimensional concept of maturity ... 34
3.2 M easures of technology maturity... 37
3.2.1 The NASA TRL scale... 37
3.2.2 TRL tailored to other agencies... 39
3.2.3 TRL tailored to other technologies/dom ains... 41
3.2.4 Extensions of TRL to better capture technology m aturity risk ... 42
3.2.5 Readiness of other factors of program development ... 46
3.2.6 Relating the maturity scales to the multidimensional measurement of technology maturity ... 4 8 3.3 The TRL scale... 49
3.3.1 Definition ... 50
3.3.2 TRL w ithin DoD ... 51
3.3.3 properties/characteristics of the TRL scale ... 57
4.1 The NASA Dataset ... 62
4.1.1 Presenting the dataset... 62
4.1.2 Sam ple quality ... 64
4.1.3 Sam ple transform ation ... 65
4.2 The Army Dataset ... 69
Chapter 5. Overview of the TRL fram ework... 71
Chapter 6. Level-1 assum ption ... 76
6.1 Definition and literature review ... 76
6.2 Theoretical evidence... 77
6.3 Em pirical evidence ... 78
Chapter 7. Level-2 assum ption ... 82
7.1 Definition and literature review ... 82
7.2 Theoretical evidence...83
7.3 Em pirical evidence ... 84
7.3.1 Analysis Of Variance ... 84
7.3.2 Validity of the results across agencies... 89
7.3.3 Variance reduction through sam ple segm entation... 89
7.4 Proposed m ethodology... 92
7.4.1 The need for non-param etric statistics ... 92
7.4.2 Different non-parametric techniques to generate median confidence intervals ... 93
7.4.3 The bootstrap ... 95
7.4.4 Im plem enting the bootstrap in Excel User Defined Functions...100
Chapter 8. Level-3 assum ption ... 103
8.1 Definition and Literature review ... 103
8.2 Theoretical evidence... 104
8.3 Em pirical evidence ... 106
8.4 Proposed m ethodology... 109
8.3.1 Overview of the forecasting approaches...109
8.3.2 The Com parison technique...110
8.3.3 Forecasting m ethods ... 116
8.3.4 Analysis of the results ... 121
9.1 Definition and Literature review ... 126
9.2 Theoretical evidence... 129
9.3 Em pirical evidence ... 130
9.4 Som e considerations on regressing risk against TRL ... 131
Chapter 10. Conclusions and future research ... 136
10.1 Sum m ary of results ... 136
10.2 Future and related research ... 138
References...142
Annex 1: Box-W hisker plots of Army TRL transition tim es ... 149
Annex 2: VBA Excel functions ... 152
List of Tables
Table 3.1 Factors affecting Time-To-Maturity, grouped using the 8 views of Enterprise Architecting... 36
Table 3.2 NASA TRL scale definitions ... 38
Table 3.3 Correspondence between maturity measures and factors influencing "time to maturity"...48
Table 4 .1 T he N A SA dataset...63
Table 5.1 Classification of the framework's models with respect to classes of uncertainty...72
Table 7.1 Table to generate 95% median confidence intervals for small datasets (Conover, 1980) ... 94
Table 8.1 Correlation table of the NASA log-transition times (modified dataset)...108
Table 9.1 Summary of regressions against maturity scales found in the literature ... 128
List of Figures
Figure 1:1 The four-level framework for TRL-based cost and schedule models ... 20
Figure 2:1 Simplified 5-step process of risk management (Smith and Merrit, 2002)... 24
Figure 2:2 Contribution of the research to better technology management... 24
Figure 2:3 Types of m odels considered in the thesis... 25
Figure 3:1 Nolte's technology life cycle superimposed with Moore's adoption cycle and the technology deve lo p m e nt p hase ... 34
Figure 3:2 Classification of TRL-related technology maturity scales ... 39
Figure 3:3 The TRL scale with simplified definitions of levels and transitions...51
Figure 3:4 The DoD acquisition cycle ... 53
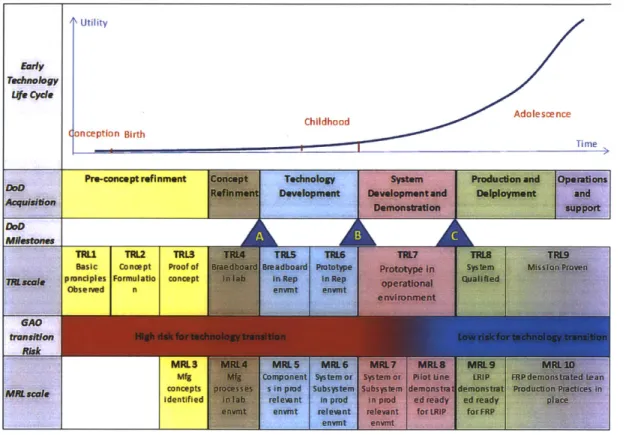
Figure 3:5 Correspondence between Nolte's technology lifecycle, the GAO transition risk, the DoD Acquisition cycle, the TRL scale, and the MRL scale. Sources: adapted from DoD TRA Deskbook (2009), Nolte (2008), Sharif et al. (2012) , Azizian (2009), Morgan(2008), Graben (2009), Dion-Schwarz (2008), a n d G A O (19 9 9 )... 54
Figure 3:6 Localization of the correspondence table within the larger technology cycles. ... 55
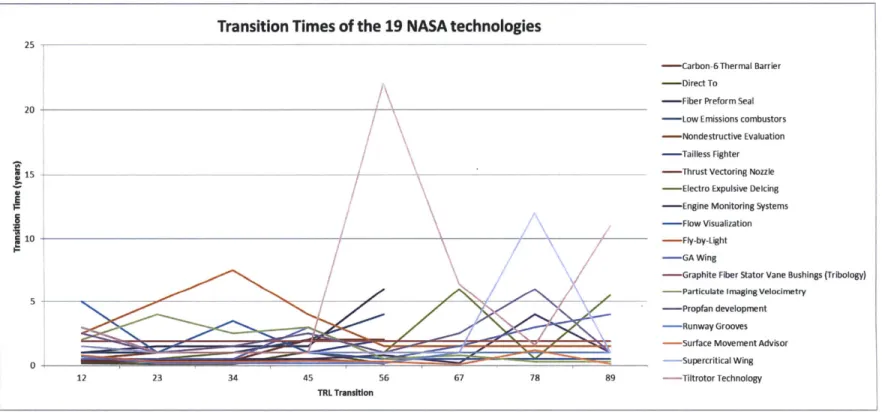
Figure 4:1 Transition times of the 19 NASA technologies ... 66
Figure 4:2 Log-Transition Times of the NASA technologies (outliers removed)...68
Figure 5:1 The TRL framework indicating the increasing strength of the assumptions at each level...71
Figure 6:1 The TRL framework, the first-level assum ption ... 77
Figure 6:2 GAO technology transition risk ... 79
Figure 6:3 Reduction in Time-to-Maturity risk as TRL increases ... 80
Figure 7:2 Results of the eight ANOVA analyses. The relevant confidence intervals and the p-values are
h ig h lig h te d. ... 8 8
Figure 7:3 Regression of Log-transition times against TRL score (time taken from TRL 1 to reach that TRL
sco re) and N A SA criteria A -F... 90
Figure 7:4 Comparison of 95% confidence intervals (of the median of log-transition time) generated using three different techniques ... 96
Figure 7:5 Bootstrap-generated histograms for the means of NASA log- transition times... 97
Figure 7:6 Bootstrap-generated histograms for the medians of NASA log- transition times...98
Figure 7:7 Snapshot of the Transition Time user defined function in excel ... 100
Figure 8:1The TRL fram ework, the third-level assumption ... 104
Figure 8:2 Log-transition tim es of NASA technologies ... 107
Figure 8:3 The forecasting techniques proposed for level 3 ... 109
Figure 8:4 Excel table example, showing the series of forecasts generated for one technology (for one forecasting method, for one of the training sets), and different measures of error of those forecasts.. 113
Figure 8:5 Annotated extract of one Excel sheet used to evaluate one forecasting method (only the top and bottom of the Excel sheet are visible) ... 114.
Figure 8:6 The Objective Function of Error (OFE) control parameters Excel sheet ... 115
Figure 8:7 Total OFE for all the 12 forecasting methods (with the original OFE settings) ... 122
Figure 8:8 Total OFE for the 9 best forecasting methods (with the 2-3 transition OFE included) ... 122
Figure 8:9 Total OFE for the 9 best forecasting methods (with the extreme outlier included in the va lid atio n d ataset)...123
Figure 8:10 O FE control param eters for figure 8.11... 123
Figure 8:11 Total OFE for the 9 best forecasting methods (with equal weight given to close and far
Figure 8:12 Standard deviations of the log-transition times of the NASA TRL data...125
Figure 9:1 The TRL fram ework, the fourth-level assum ption ... 126
Chapter 1
Chapter 1. Introduction and Research Motivation
More than ever, innovation and technology are key elements to the competitive edge in today's world.
In order to sustain growth, companies - as well as state agencies - are forced to develop new
technologies faster, cheaper, with less tolerance for risk.
However, technology development is highly unpredictable: not only is a project manager faced with
"known unknowns" i.e. uncertainties that can be roughly estimated and controlled, he also has to deal
with "unknown unknowns" which are completely unforeseeable uncertainties due to the very nature of
developing a new technology (no historical data, analogous data, or reliable expert opinions). Industry
has adopted many technology management frameworks to address this challenge, such as technology
roadmapping, technology benchmarking, technology watches, and technology risk management (Foden
and Berends, 2010). The aim is to control key factors such as cost, schedule, technology maturity, and
manufacturability.
For US governmental agencies (DoD, DoE, NASA, Army), the challenges are bigger and the stakes are
portfolio of technologies, (2) develops a lot of high complexity system technologies (3) manages a
budget of a several hundred billion dollars (GAO, 2009) in a monopsonistic contracting environment with little market competition, (4) suffers from frequent design changes due to modifications in requirements, (5) and is under constant pressure to accelerate the development of technologies required for pressing national security issues.
DoD has poorly addressed its challenges for many technologies. The above constraints often result in cost overruns. DoD has endured a cost growth of $296 billion on its 96 major acquisition programs in fiscal year (FY) 2008 (GAO, 2009). More than 2 out of 3 programs suffered a cost growth. In another performance audit of 72 DoD programs, the Government Accounting Office (GAO) reported more than 25% cost growth for 44% of the programs in FY07 with an average schedule delay of 21 months (GAO, 2008). Other GAO reports (GAO, 1999, 2006, 2008) also noted failure to meet capability and
performance requirements. DoD also faces problems with increasing systems complexity and
integration. The F-35 is such an example: not only did it face serious cost problems (Pentagon officials disclosed a cost overrun of more than 50 percent (Shalal-Esa, 2011)), a Pentagon study identified 13 areas of concern (some of which are critical) due to system complexity and concurrency (DoD, 2011).
As awareness of the problem increased and as defense budget continued to be cut, the defense acquisition community was under greater political pressure to improve the management of new technologies. In May 2009, President Obama signed the Weapon Systems Acquisition Reform Act (WSARA) to end "waste and inefficiency". Some of the Act's key provisions included (WSAR Act, 2009):
* Appointment of a Director of Cost Assessment and Program Evaluation (CAPE), who will
policies and establish guidance on cost estimating and developing confidence levels for such
cost estimates; (section 101)
e Requirement that the Director of Defense Research and Engineering periodically assess the
technological maturity of Major Defense Acquisition Programs (MDAPs) and annually report
his/her findings to Congress; (section 104)
* Requirement that DoD revise guidelines and tighten regulations pertaining to conflicts of
interest of contractors working on MDAPs. (section 207)
The Government Accountability Office also weighed in on the issue. In a now famous report, GAO
concluded that "Maturing new technology before it is included on a product is perhaps the most
important determinant of the success of the eventual product-or weapon system", GAO went further
by encouraging the use of "a disciplined and knowledge-based approach of assessing technology maturity, such as TRLs, DoD-wide" (GAO,1999). Technology Readiness Levels (TRLs) are a 1-to-9 scale
developed by NASA (and used only by NASA at the time) that describes the maturity of a technology
with respect to a particular use.
GAO mainly suggested the use of TRLs to make sure that technologies are mature enough before integrating them in the acquisition cycle (GAO, 1999). DoD later required the use of TRLs as criteria to
pass Milestones B and C in the Acquisition cycle (DoD TRA Deskbook, 2009).
Although those practices advocated by WSARA and the GAO reports already have a positive effect on
managing technology maturation and on controlling cost growth and schedule delays, they make
minimal use of TRL measurements for cost and schedule modeling. TRLs are practically only used by
at its maturity (Graettinger et al, 2003), or they are used by the DoD acquisition in Technology Readiness
Assessments (TRAs) to make sure the technology has matured enough to pass certain milestone (DoD TRA Deskbook, 2009). Furthermore, Azizian et al. (2009), Cornford and Sarsfield (2004), Nolte (2008), and Fernandez (2010) point out that TRL is not well integrated into cost, schedule, and risk modeling tools. The general aim of this research is to explore the total potential benefit of integrating TRLs, cost, and schedule into a single technology management framework. In the spirit of the GAO and WSARA recommendations of keeping tighter control of technology maturity and of improving cost/schedule estimation and management, this thesis takes a more fundamental theoretical approach to study all TRL-based cost and schedule models.
Many models have already been proposed to use TRLs for cost and schedule modeling for individual technologies (e.g., GAO, 1999; Smoker and Smith, 2007; Dubos and Saleh, 2008; and Conrow, 2011) as well as technology systems and portfolios (e,g., Dubos and Saleh, 2010; Lee and Thomas, 2003; and Sauser at al., 2008). However, those models are based on different assumptions (which can lead to different results). Some models are based on a theoretical foundation, while other ones make implicit assumptions and don't justify the approach as long as it generates robust or useful results.
This research builds on an earlier paper by El-khoury and Kenley (2012), and goes into detail in constructing a unifying framework for all TRL models based on the assumptions that they make. The framework (seen below in figure 1.1) divides all TRL cost/schedule models into 4 categories based on how strong the assumptions about TRL they make. For each level in the framework, we will (1) state the assumption, (2) list the available literature relevant to that level of assumption, (3) look at theoretical evidence supporting this assumption, (4) look at empirical evidence supporting this assumption, and
finally we will (5) propose new methodologies that make better use of the assumptions whenever
possible.
Such a framework has many benefits: first it puts all TRL-based models in one clear theory. Second, it
makes explicit the assumption used by a model, which helps to tell what model has stronger theoretical
or empirical foundations. Third, once we know the assumptions being made, we can propose
modifications to improve the model, or alternative models that make full use of the assumptions.
Finally, the model goes beyond the statement and the clarification of the assumptions, to backing those
assumptions by theory, and more importantly by empirical data whenever possible. Similarly, we will
propose new methodologies at Levels 2,3, and 4 of the model, and the improvement brought by those
methodologies will be quantitatively tested.
Figure 1:1 The four-level framework for TRL-based cost and schedule models
In addition to the above benefits of the framework, the models developed at different levels will allow
* With a level-1 model, we will answer the research question:
o Does available evidence support or contradict GAO's recommendation on pre-production
maturation?
* At level 2, we will answer the questions:
o Does it make statistical sense to look at the distribution of each TRL transition time
separately?
o If yes, is there a way to improve the accuracy and fidelity of the estimates and
confidence intervals?
* At level 3, we will develop a model that answers:
o If we use historical data of a technology's development, can we significantly improve the
accuracy of the technology schedule forecast over level-2 models?
" And at level 4, we will answer:
o Out of the available methodologies, what is the best one to use in performing regression
of cost/schedule against TRL?
Answering those questions would have direct practical implications for project managers. In general,
improving cost and schedule modeling can lead to (1) reduction in cost and schedule uncertainty, which
itself can lead to (2) reduction of overall project cost and duration or (3) reduction of cost and schedule
overruns. Other benefits include (4) a better view of integrated cost, schedule, and maturity instead of a
non-integrated view of cost and schedule separately, and (5) increased control over the project by
having a high number of intermediate reference points, which would allow a better cost/schedule
arbitrage within a single project, or across different projects.
In opposition to this approach, Cornford and Sarsfield (2004) claim that TRL cannot be integrated in
in the cost estimations. Although the TRL scale has many inherent weaknesses (discussed in more detail
in section 3.3.3.2), this definitely should not prevent us from putting our full effort into looking for any
potential significant benefit of this approach, however minor it may be. After all, even a small
percentage of cost reduction will be multiplied by DoD's annual $300 billion in cost overruns. This is
especially true when "Every dollar spent on inefficiencies in acquiring one weapon system is less money
available for other opportunities" (GAO, 2006).
In Chapter 2, we scope the models by locating them within the risk management context, and then we
justify our choice of the adopted class of models. In chapter 3, we explore the relation between
technology maturity and TRL: we start by defining the multidimensional concept of technology maturity
and relate it to the maturity measures found in the literature. Then we focus on the TRL scale itself by
defining it, explaining how it is used in the acquisition lifecycle, and by looking at its most relevant
characteristics. In chapter 4, we introduce the two datasets used in the thesis and we evaluate their
quality. In chapter 5, we introduce the TRL models assumption-based framework and explain the logic
behind it. In chapters 6 to 9, we present each of the 4 levels by stating the assumptions and listing the
corresponding literature, then by looking for theoretical and empirical evidence supporting the
assumption, and then by proposing new methodologies (especially in chapters 7 and 8). Finally in
chapter 10, we conclude by summarizing our major results and by proposing directions for future
Chapter 2
Chapter 2. Research Scope
2.1 Placing this research in the larger context of risk management
While some project variables are beyond the control of the project managers such as budget cuts,
others are within their reach (for example, Browning and Eppinger (2002) model how the choice of
product development processes impacts project cost and schedule). Therefore, having better
information means that the project managers can make better decisions to address risks in technology
development. For instance, the manager can decide to drop a very high risk project in order to allocate
more resources to the highest identified risk in a Major Defense Acquisition Program (MDAP), he can
also engage in a risk reduction procedure, like rapid prototyping, or he can compare different system
requirements, configurations, or acquisition strategies and select a baseline set of requirements, system
configuration, and acquisition strategy that has an appropriate level of risk. More generally, proper risk
management requires the best risk analysis tools. A wrong identification/analysis of risk means that risk
We have already mentioned that the aim of this thesis is to propose a classification and improvement of
TRL models. By doing so, we are improving the risk analysis part of the risk management process. The
following diagram locates this research within the risk management context.
steps citicasl Information
SW+ 1: Risk events and impacts
I
Ste Drivers, probabiitlie,Anal and total loss
Step 3" -+t@, Subset of risks to be managed
Ste P 4k -- + Types of action plans avoidance.
transfer, redundancy and mitigation (prevention, contingency reserves)
Step 5: Assess status and closure of targeted risks, identify new risks
Figure 2:1 Simplified 5-step process of risk management (Smith and Merrit, 2002)
The below diagram summarizes how this research contributes to better technology management.
Classifying and better understanding TRL cost and
schedule models- - --- -- -- ----
More informed risk
better allocation of sceueorun
00,ii11 resources
Figure 2:2 Contribution of the research to better technology management
2.2 The choice of TRL-based cost and schedule models
It should be noted that acquisition programs entail many types of risks (for example design/engineering, manufacturing, support, technology, and threat, as defined in DoD5000.1 (2007)) and that there are
multiple ways and approaches to model those risks. In our case however, we only look at cost and
schedule risk types and we model them by using only TRL as an input (figure 2.3). Combined
cost-schedule modeling (grey area in figure 2.3) is recommended for future research when data becomes
available.
Figure 2:3 Types of models considered in the thesis
2.2.1 Reasons for choosing only Cost and Schedule risk types
Many risk types can be considered in risk management. However, we limit those to only cost and
schedule for the following reasons:
- Cost and Schedule are traditionally the most important factors and have the highest weight both practically and politically (this is why they are directly addressed in the GAO reports and in
WSARA).
-Those two are the most studied variables in the literature. We found that models in the
literature either deal with schedule-related variables such as total development time (Dubos
Saleh, 2008), risk of schedule slippage (Dubos and Saleh, 2008), or with cost-related variables
such as total cost (Smoker and Smith, 2007), absolute cost growth (Lee & Thomas, 2003), and
relative cost growth (Lee and Thomas, 2003).
-The program management literature traditionally reduces the major program variables to a
Cost-Schedule-Performance (CSP) "trade space" (Defense Acquisition Guidebook, 2010),
meaning that the project manager has a space of feasible (C,S,P) triplet solutions, and he
manages the program by trading between those 3 variables to achieve the best possible (C,S,P)
combination. However, microeconomic theory stipulates that P will get fixed to a high value
early on, and that (C,S) will be the only variables to be traded throughout the project. The
contracting environment will lead to an initial high P value that will be met, and as a
consequence, C and S will tend to surpass the original estimates. In fact the Government is
interested in a low C, low S, and high P, while the contractor is interested in a high C, high S, and
high P. Since both parties only agree on a high Performance, and since there is little initial
knowledge about the technical potential of the technology, P will get set to an unrealistically
high value (Conrow, 2003). Now that the contractor is having cost and schedule overruns
because of the high P, he has little incentive to go cheap or fast because the government usually
assumes those risks. Conrow (1997) empirically confirmed this conclusion. Using data from 3
different studies (Perry 1971, Dews 1979, and Conrow 1995), he found that major military
development programs met their Performance targets on average, while Cost and Schedule
were often adjusted upwards to meet performance. Based on Conrow's conclusions, we can
-Finally note that we decided to dismiss the bivariate Cost-Schedule models (i.e. models in the grey area in figure 2.3) that model Cost and Schedule together at the same time. Those represent a completely different class of models with a different set of assumptions. The tendency in those models would be to extend classical one-variable models to some bivariate normal (or lognormal) distribution of Cost and Schedule. However, Garvey (2000) warns that those distributions are not appropriate in representing Cost and Schedule. Such a simple distribution would reduce the interaction between cost and schedule to a simple linear coefficient of correlation that only says "high costs correspond to delayed schedules", or the opposite. It fails to capture the causation in cost-schedule decision making. It creates confusion between two types of cost/schedule correlation: (1) a post-decision-making positive correlation across projects (e.g. MDAPs and systems projects always consume more time and money than smaller projects), and (2) a pre-decision-making negative correlation within a project (i.e. the arbitrage done by the project manager between cost and schedule). On a more empirical level, Conrow (2003) notes that there are no bivariate distributions in the literature due to the lack of data. His own study shows that the bivariate lognormal distribution is a bad fit for
Cost-Schedule, and that Cost-Schedule correlations are low (which is expected, since although they are related, the relation is NOT linear). For all the above reasons, we dropped joint
cost-schedule models from our framework. The reader can refer to El-Khoury and Kenley (2012) on a method for bivariate cost-schedule modeling that takes the decision-making process into consideration.
2.2.2 Reasons for choosing TRL-based models only
In addition to the reasons that led to the choice of cost and schedule models, many practical reasons led to the choice of TRL-based models over other maturation measures:
-The TRL measurements are often already available. For all major DoD acquisition projects, the
assessments have to be performed for the milestones (The undersecretary of defense, 2011), so
there is no extra cost to perform the measurement. Furthermore, some projects (especially
Major Defense Acquisition Programs) get more frequent Technology Readiness Assessments,
which means more available TRL measurements.
-TRL scales have a widespread use across many agencies (e.g. DoD, DoE, NASA, FAA, and the
Army) and countries (US, UK, Canada, EU), and the procedures of determining the scores are
already established.
-There are available tools to determine TRL scores (Technology Readiness Calculator, Nolte,
2005) that further streamline and encourage its use. Hence the cost of integrating it into technology cost and schedule models will be minimal, while the benefit for the program
manager is potentially high.
-Finally, and as a consequence of the above, TRL is the only maturity variable that has available
data. As we mentioned earlier, it is important to note that this thesis is not only limited to the
theoretical framework, it also uses a data-based approach to empirically validate the proposed
models at each level in our framework. In fact, the literature points out a lot of weaknesses of
using TRL in technology management (refer to section 3.3.3.2), and proposes many more
developed alternative frameworks such as AD2, RD3
, SRL, ITI (all discussed in detail in section
3.2.4), or combinations of those (Mankins, 1998; Nolte, 2008; Bilbro, 2008; and Sauser et al,
2008). However, there is no way of quantitatively evaluating those alternative approaches due to absence of data, as they are still not used by any of the major agencies. As a result, we look at
models that use TRL as the only input. Future research can look into augmenting our models
Chapter 3
Chapter 3. Technology Maturity and the TRL scale
Before going into TRL-based technology forecasting models, it is important to understand technology
maturity along with the different measures (especially TRL) of technology maturity.
The main purpose of this chapter is to define the "maturity" scope of this thesis by putting the TRL scale
in the right context. This section can be also considered a literature review on the TRL scale and the
measurements of technology maturity.
In subsection 3.1, we define the multidimensional concept of technology maturity, and then we locate
the technology development phase (phase captured by the TRL scale) within the larger technology
lifecycle.
In subsection 3.2, we introduce the concept of technology maturity measurement. We classify all the
maturity measurements found in the literature (based on their relation with the NASA TRL), and see
Finally in subsection 3.3, we focus on the TRL scale. First, we propose a (more intuitive) definition of the
TRL scale. Then, we describe how TRL is officially used in DoD's acquisition cycle, and we finish by
looking at the TRL scale's properties and characteristics that will be relevant for the models developed in
subsequent chapters.
3.1 Technology maturity
The purpose of this section is to locate TRL within the larger context of technology maturation. First, we
look at the technology lifecycle that defines the technology evolution process and delimit the section
captured by the TRL scale. Then we go deeper into the definition of technology maturity, its
measurement, and its determining factors.
3.1.1 TRL's location in the technology lifecycle
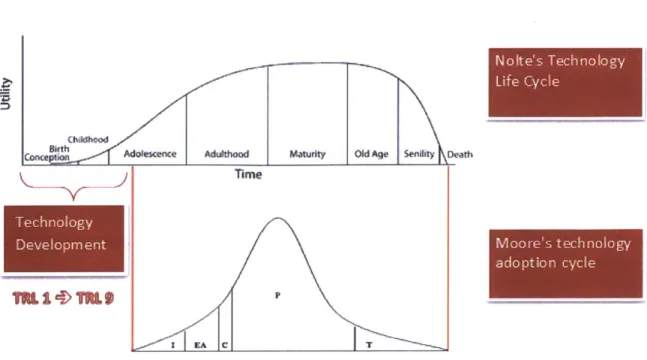
In his book, Nolte (2008) presents a technology's "whale chart" biological lifecycle from initial idea to
obsolescence.
Conception is when the initial thought or supposition appears. It is the sometimes long process of
incubating the idea while unsure if it might work or not.
Birth is when the inventor realizes that the idea might work. It is when all the earlier concepts are
developed enough so that an early application can be determined.
Childhood consists mainly of the extensive laboratory research whose main goal is to prove that the
Adolescence is when the developer is ready to release the first version of the technology product. This marks the transition from an environment focused on the science and technology behind the product, to
an environment focused on the engineering challenges to make the product.
Adulthood is when the product has been successfully debugged and marketed, and that product adoption reaches its peak.
Maturity is when the market for the new product is already saturated. Suppliers can now only offer incremental innovations and product differentiations to keep market shares.
Old age is when the technology is old enough that it has no new adopters. A few suppliers keep serving the diminishing demand, while looking for new opportunities.
Senility is when the technology is old enough that there is no more room for incremental innovation and
that it is starting to lose its utility. The market is reduced to a niche one as most suppliers have now
turned to other more promising technologies
Death is when the technology dies because it has reached full obsolescence. Suppliers, materials, and
know-how start to disappear. The technology can no longer compete with newer substitutes, so it either
disappears entirely or survives in a museum.
When we map the utility of the technology as it goes through all the above stages, we get Nolte's
Whale-shaped chart (figure 3.1) illustrating the slow increase of a technology's utility as it is developed,
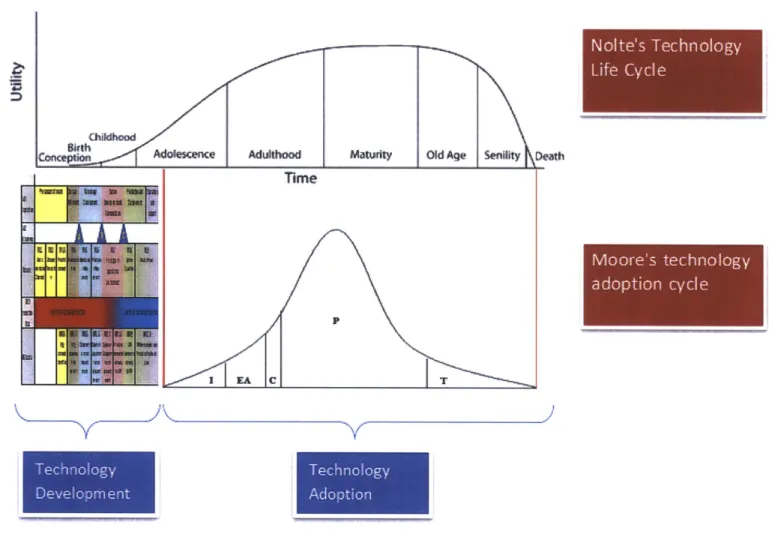
To put this cycle into perspective, Nolte superimposes his chart with Moore's technology adoption cycle. Goeffry Moore (1991) describes how a technology is adopted from a market perspective. Moore
distinguishes 4 groups of technology adopters:
First, the Innovators are the technology enthusiasts who buy the technology just because it is new.
Second, Early Adopters are the ones who recognize the potential of the technology, and they help debug the technology and make it more user-friendly.
Then, Pragmatists form the bulk of the technology adopters. They encompass those who use the technology because they've seen it already work, and those who are forced to use it in order to keep up with the competition.
Finally, traditionalists or laggards do not like high technology products, and will only adopt the technology at a late stage when no alternatives are left and when newer substitutes are starting to become available.
Moore (1991) stresses the importance of targeting each of those different segments in technology marketing, especially when "crossing the chasm" between the early adopters and the pragmatists.
Of course, this cycle is from a customer's adoption perspective, and a customer cannot adopt a technology unless it was developed enough to get to a usable level. This means that Moore's adoption cycle comes after the technology development phase, which we place in superposition to the
Figure 3:1 Nolte's technology life cycle superimposed with Moore's adoption cycle and the technology development phase
Now that we have located the technology development phase within the technology lifecycle, we will
next define technology maturity and establish a framework for measuring it.
3.1.2 The multidimensional concept of maturity
In theory, technology maturity could be defined as "the quantity of information we know about the
technology and how good/efficient we are at applying it". In practice however, product managers need
a more operational definition of technology maturity. For them, a technology's maturity is measured on
different practical dimensions such as "How long until I can market a functioning product? How much
investment do I still need? What is the risk of not having the technology work as intended?" Viewed
from this perspective, we can see that there is no straight answer to the question "how mature is a
developing technology?" since maturity is defined on many levels. Furthermore, if we pick one of those
definitions, measuring maturity operationally means estimating uncertain future outcomes, and those
outcomes are causally related to numerous aspects of the technology development environment, and of
MIoor)r e's
techIn
io ogythe technology itself. For example, if we want to look at "time remaining until the technology is fully operational" (or "Time-To-Maturity") as a measure of the maturity of the technology, then there are several factors that affect the technology's maturity: What is the type of the technology (software, hardware, satellite, military, space)? Is it a simple component or a complex system? Do we have a working prototype? Do we know how to manufacture the final product? Do we have stable funding? Do we have the resources to develop it?
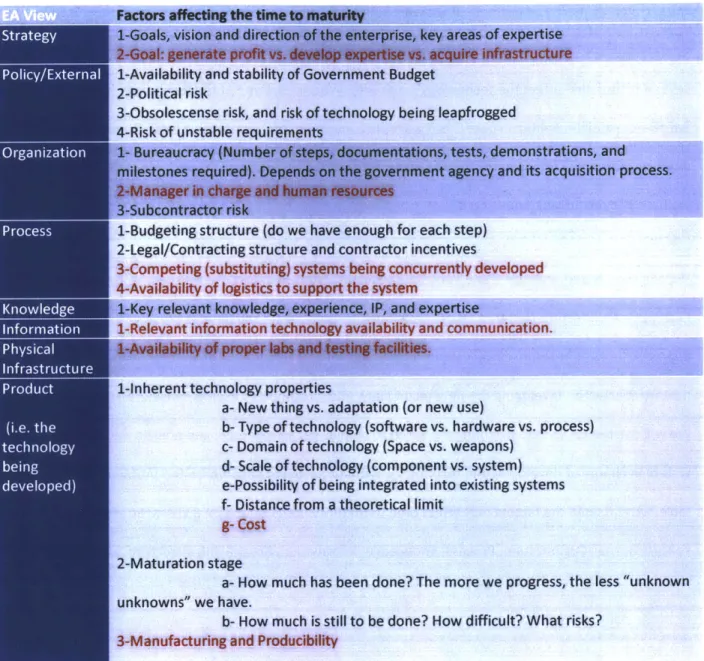
We can classify and organize those contributing factors from an enterprise perspective by using the Enterprise Architecture (EA) framework developed by Nightingale and Rhodes (2004). This holistic approach looks at enterprises as systems interacting with stakeholders. The enterprise in this case is a military contractor developing the new technology, and a technology itself is considered the product. We will use the EA 8 views (Nightingale, 2009) to help us get an extensive and holistic view of the system in charge of developing the technology, without having to decompose the problem. In the below table, we classified the factors that affect time to maturity based on the EA 8 views: Strategy,
Product 1-Inherent technology properties
a- New thing vs. adaptation (or new use)
(i.e. the b- Type of technology (software vs. hardware vs. process)
tech nology c- Domain of technology (Space vs. weapons)
being d- Scale of technology (component vs. system)
developed) e-Possibility of being integrated into existing systems f- Distance from a theoretical limit
g- Cost
2-Maturation stage
a- How much has been done? The more we progress, the less "unknown unknowns" we have.
b- How much is still to be done? How difficult? What risks?
3-Manufacturing and ProducIWilty
Table 3.1 Factors affecting Time-To-Maturity, grouped using the 8 views of Enterprise Architecting While all those factors ultimately determine how long a technology will take to mature, a lot of them are
beyond the control of the contractor. This is why we distinguished the controllable variables from the
uncontrollable ones by coloring them in red. Although the black and red variables all affect how long a
technology needs to mature, the contractor's risk management and decision making can only affect
In summary, we saw that measures of maturity correspond to early stages in the technology lifecycle, during Nolte's phases of conception, birth, childhood, and adolescence, and before the start of the product adoption cycle. Furthermore, we saw that maturity is defined on multiple dimensions, and that it is causally affected by a multitude of factors.
3.2 Measures of technology maturity
Since technology maturity (in the broad sense defined above) is a complex notion that depends on many factors, it cannot be reduced to one dimension, and hence cannot be fully captured by only one
measure. This explains why several measures were created to try to capture different aspects of the maturation progress. Although TRL is the most commonly used of those maturity scales, the aim of this section is to briefly present the TRL scale, and then compare it to the other scales so that it can be put in the context of the different measurements of technology maturity.
3.2.1 The NASA TRL scale
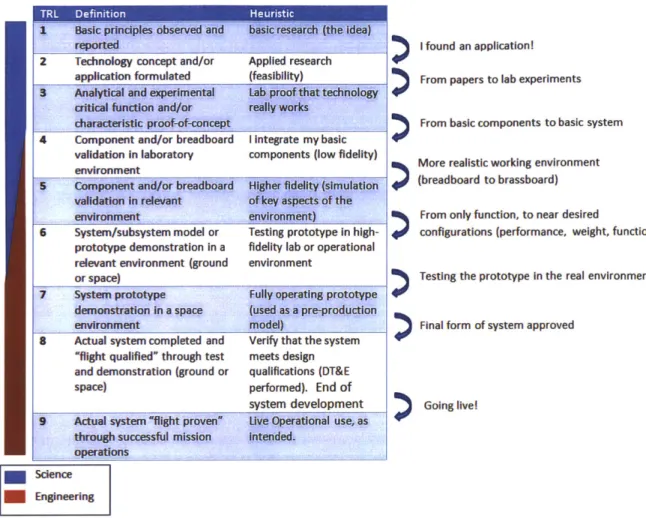
TRLs capture the maturity of the technology by looking at major milestones in the technology development process. At low TRLs, those milestones are concept development and basic laboratory tests. At high TRLs, they correspond to prototype validation and field testing. The TRL scale is a
systematic high-level measure of maturity that keeps track of important stages in the development of a technology. Below is the formal definition of the scale as used by NASA (Mankins, 1995):
1 Basic principles observed and reported
2 Technology concept and/or application formulated
3 Analytical and experimental critical function and/or characteristic proof of concept 4 Component and/or breadboard validation in laboratory environment
5 Component and/or breadboard validation in relevant environment
6 System/subsystem model or prototype demonstration in a relevant environment (ground or space) 7 System prototype demonstration in a space environment
8 Actual system completed and "flight qualified" through test and demonstration (ground or space) 9 Actual system "flight proven" through successful mission operations
Table 3.2 NASA TRL scale definitions
We can see that the TRL scale is intended to be consistent across technologies (Mankins, 1995), and that
it tries to encompass the major steps common to all technology development. As a result, it loses
specificity and fails to capture all the technology-specific factors mentioned in table 3.1. This is why a
plethora of alternative TRL scales and complementary maturity measures have emerged. Depending on
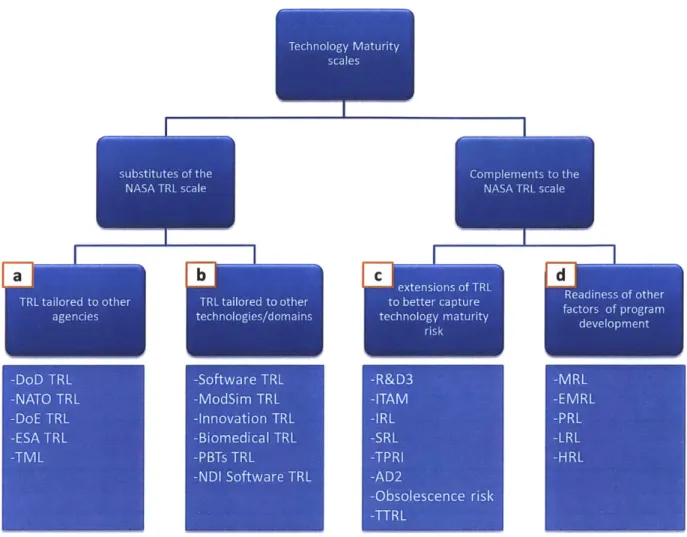
how they are a substitute for or a complement to the NASA TRL scale, those other maturity scales can be
classified into 2 main groups:
1. Alternative scales that substitute for TRL by adapting TRL to other organizations, domains, or technologies, making it more tailored or suited to the specific attributes of those domains.
2. Supporting scales that complement TRL either by (1) measuring other factors of technology
maturity risk, or by (2) measuring the readiness of factors or processes that support product
development, but that are not directly related to the technology itself. Those scales are
intended to be used with TRL to get a complete picture of technology development risk.
Ieholg-atrt
T I -DoD TRL -NATO TRL -DoE TRL -ESA TRL -TML 0 - 0 t -R&D3 -ITAM -IRL -SRL -TPRI -AD2 -Obsolescence risk -TTRLFigure 3:2 Classification of TRL-related technology maturity scales
3.2.2 TRL tailored to other agencies
9 DoD TRL: After the 1999 GAO report recommending the use of TRLs, the Deputy Under
Secretary of Defense for Science and Technology issued a memorandum recommending the use
of TRLs in all new major programs. The TRL was later included in the Technology Readiness
Assessment (TRA) Deskbook (DoD, 2009) with a 9-level definition very similar to that of NASA, but with more emphasis on the supporting information that needs to be produced at each level
(For more information about the DoD Acuisition cycle and Technology Readiness Assessment,
please refer to section 3.3.2).
I I I -Software TRL -ModSim TRL -Innovation TRL -Biomedical TRL -PBTs TRL -NDI Software TRL -MVRL -EMVRL -PRL -LRL -HRL
* NATO TRL: Following the formal adoption of TRL by DoD, the Undersea Research Centre (NURC) at the North Atlantic Treaty Organization (NATO) developed its own TRL scale. Although this
10-level scale is based on the DoD TRL definitions, the NURC scale has more detailed descriptions in
an attempt to make it more compatible with NATO needs (NATO, 2010).
* DoE TRL: The Department of Energy (DoE) has also adopted a tailored 9-level version of the
NASA TRL scale for its own Technology Readiness Assessment process. For example, the level descriptions go more into detail on the use of simulants, the scale of pilot projects, and the
transition from cold to hot commissioning. The DoE TRA guide (2009) also maps 3 dimensions of
testing recommendations relative to TRL: Scale of Testing (Going from Lab, to Engineering/Pilot,
to Full scale), Fidelity (Going from Paper, to Pieces, to Similar, to Identical), and Environment
(going from Simulated, to Relevant, to Operational). However, before that in the late nineties,
DoE's Nuclear Materials Stabilization Task Group (NMSTG) used another scale called
"Technology Maturity" (TM). Unlike TRL, the TM score was a continuous scale with values from
0 to 10 since it was computed as a weighted average between seven different maturity scales (requirements, processes, equipment, facilities, schedule, personnel, and safety). Kenley and
Creque (1999) later used regression analysis to identify Hardware equipment, Facility,
Operational safety, Process Maturity as the four most relevant maturity parameters when
predicting schedule.
* ESA TRL: is a TRL scale used by the European Space Agency. Since it is geared towards space technologies, it is very similar to the NASA TRL scale. The Technology Readiness Levels
Handbook for space applications (TEC-SHS, 2008), contains relatively detailed definitions of each
TRL level, with examples, key questions to ask for transitions, and appropriate evidence
e TML: Technological Maturity Levels. It was developed for the Canadian Department of National Defense (DND). It is based on the NATO TRL definition combined with an Interface Maturity Level, a Design Maturity Level, a System Readiness Level (all defined by the UK MoD, 2006), and the Manufacturing Readiness Level (MRL) scale. Although the intention is to capture the
multidimensional aspect of technology maturity, those S scales end up being merged into one TML number. (Hobson, 2006)
3.2.3 TRL tailored to other technologies/domains
* Software TRL: While the original TRL scale was intended for hardware, this 9-level scale was developed to track Software development. It was first developed by NASA in 1999 (Nolte, 2008), and it now has different versions for different agencies (DoD, NASA, Army, Missile Defense Agency, Air Force Research Laboratory). The levels go from scientific feasibility, to application of software engineering principles, to final implementation/integration steps.
* ModSim TRL: It is a modified 9-level version of the NASA TRL by mainly adding the Predictive Capability Maturity Model (PCMM) attributes. It is tailored for Modeling and Simulation applications. The methodology consists of first giving maturity scores on 9 dimensions (Capability Maturity, Verification, Validation, User Qualification, Code Readiness, Models, Geometry, Quantification of Margins and Uncertainties, and System), and then assigning the ModSim TRL score as the minimum of those scores. (Clay et al, 2007)
* Innovation TRL: The innovation readiness level is a 6-level scale intended to depict the
development of innovation. This is why the 6 levels of IRL correspond to 6 phases of technology adoption. Each of those levels (phases) is measured along 5 dimensions: Technology, Market, Organization, Partnership, and Risk. (Tao, 2008)
* Biomedical TRL: was developed by the U.S. Army Medical Research and Materiel Command. It consists of four 9-level TRL scales developed for four different categories: Pharmaceutical
(Drugs) TRL, Pharmaceutical (Biologics, Vaccines) TRL, Medical Devices TRL, and Medical IM/IT
and Medical Informatics TRL. While it is similar in the overall structure to the NASA TRL, most
descriptions of the TRL levels tend to have more specific category-related descriptions. The
levels also have detailed descriptions of the required supporting information to pass a certain
TRL (U.S. Army Medical Research and Materiel Command, 2003)
* PBTs TRL: Process-based Technologies TRL is a 9-level scale developed by Graettinger et al.
(2003). It is intended for practices, processes, methods, approaches, (and frameworks for those), as opposed to technologies like hardware, software, embedded systems, or biomedical
devices. PBTs mature on two levels: the environment (which becomes more representative as
the community of users expands from initial risk takers to mainstream users), and the
completeness of the technology (as it goes from basic properties, to a defined core, to
implementation mechanisms, to best practices, to a body of knowledge).
* NDI Software TRIL: Smith (2005) proposes to address the weaknesses of software TRLs by adopting a multi-criteria measure of maturity for Non-Developmental Item (NDI) Software. He
simultaneously measures 5 relevant attributes on 5 different scales: Requirements Satisfaction,
Environmental Fidelity, Criticality, Product Availability, and Product Maturity (Smith, 2005).
3.2.4 Extensions of TRL to better capture technology maturity risk
* R&D3
: The Research and Development Degree of Difficulty scale was proposed by Mankins (1998) to address TRL's weak predictive power. R&D3 complements TRL as a measure of how
much difficulty is expected to be encountered in the maturation of a technology. It consists of 5
Level I corresponds to 99% or almost certain success, while Level V corresponds to 10%-20% or almost certain failure (Mankins 1998).
* ITAM: After introducing the R&D3
measure, Mankins (2002) proposed the Integrated Technology Analysis Methodology (ITAM) as a framework to measure both technology development progress as well as anticipated future research and technology uncertainties, while taking into account the importance of critical subsystem technologies. The methodology is based on calculating, then ranking the Integrated Technology Indexes (ITIs) of different
competing candidate technology systems. The ITIs are calculated using 3 numbers: ATRL (Delta TRL, which is simply the difference between current and desired TRL), R&D3
(Research &
Development Degree of Difficulty, explained earlier), and Technology Need Value (TNV, measures how critical a technology is: TNV=3 if the technology is "enabling", 2 if it is "very significant", and 1 if it is just "enhancing"). The ITI for a candidate system is defined as:
ITI = Esubsystem technologies(ATRL X R&D 3 X TNV)
Total # of subsystem technoloogies
The ITI is a measure of the cumulative maturation that must be achieved for each technology, amplified by the anticipated difficulty of its maturation, and the project importance of the technology within the system, all normalized by the total number of technologies in the system. The ITI number is intended to be later used in comparing different technology system solutions as an indicator of required R&D risk (the lower the ITI, the better). Although the ITI was a first step in developing a more integrated/complete predictive measure, Mankins does not explain the logic behind the way he aggregated the factors: why multiplication and not addition? Are the scales calibrated in the right way so that the multiplication of a 1-to-8 number by a 1-to-5 number by a 1-to-3 number makes sense? Or should those 3 factors somehow be weighted?
Another weakness is that computing ATRL makes no practical sense because TRL is an ordinal
scale: the TRL numbers are simply placeholders and the values have no inherent meaning, hence
there is no reason to believe that the difference TRL3-TRL1= 2 is equal to the maturity difference
of TRL9-TRL7=2 (this ordinality problem is discussed in details in sections 3.3.3.2 and 9.4).
IRL: The Integration Readiness Level scale is the first step towards extending TRL from
component technologies to systems of technologies. An IRL measures how well two
technologies are integrated, and is defined only with respect to those two technologies. It is a
9-level scale that goes from the identification of an interface between the two technologies, to
creating a common interaction language, to enhancing quality, then the control over the
interaction, to exchanging structured information for the communication, and finally to testing
and validating the integration (Sauser et al, 2010).
* SRL: The System Readiness Level scale uses IRL to measure the readiness of a system. It is an
improvement over the ITI in that it does consider the system structure of the technology
(through all the pairs of IRLs between components). If [TRL], 1 is the vector of TRLs of
technology components, and [IRL],., the symmetric matrix of Integration Levels of all pairs of
component technologies. Then Sauser et al.(2008) defines the SRL vector as [SRL],. =
[IRL]n.n .[TRL]n1 , and then defines the System Readiness Level as the normalized sum of the elements of [SRL]na. The obtained SRL is a number between 0 and 1 that is correlated to
phases in the DoD acquisition lifecycle: low values correspond to early phases in the acquisition
cycle, while higher values correspond to production and operations and support. In other words,
SRL is the (normalized) sum of products of each technology's TRL by the IRLs of all the
technologies it interfaces with. One weakness is that it reduces the maturity of the whole
take into account the criticality of some components in the WBS. Tan et al.(2009) extend SRL to the stochastic domain by allowing TRL and IRL to be variable (distributions generated by the different expert opinions for TRL and IRL measures) , then repeating the above calculation in a Monte-Carlo simulation to generate a distribution for SRL.
TPRI: the Technology Performance Risk Index is an extension to R&D3 with respect to a
particular performance measure. If A is the percentage of achieved performance (relative to a predefined threshold), then the TPRI is defined as TPRI = 1 - A)*R&D3 (the formula
1+(l-AJ*R&D3 (hfoml corresponds to a closed-loop feedback mechanism). The resulting TPRI is a number between 0 and 1 where low values correspond to low performance risk, and where high values correspond to high chances of failing to meet performance goals. Mahafza (2005) does not provide evidence in support of the closed-loop mechanism functional form.
* AD2: The Advancement Degree of Difficulty is similar to Mankins' R&D3 in that it also tries to
determine the remaining effort/risk in maturing the technology. The main addition is that it provides a methodology and application framework for R&D3 (whereas R&D3 scale by itself is
just a list of risk levels with high-level definitions, with no accompanying methodology on how to determine those risk levels). A team of experts determines the steps necessary for maturing the technology; they then estimate the expected degree of difficulty to advance to the R&D goals,
and design tests that help determine those degrees of difficulty. They give R&D3 scores in 5
specific areas: Design and Analysis, Manufacturing, Software Development, Test, and Operations (Bilbro, 2007). AD2 is intended to be completely complementary to TRL by measuring everything we could know about the difficulty of advancement. Nolte (2008) says that AD2 is the best
predictive method for determining difficulty of advancement because of its comprehensiveness and available procedure. As a result, it would be very useful in developing cost and schedule risk
models since it actually is the best idea we have of what is left to be done to mature the
technology.
* Obsolescence/Leapfrogging risk: Valerdi and Kohl (2004) consider the risk of a technology becoming obsolete or being leapfrogged by another one. They develop a 5-level scale of
obsolescence risk and integrate it via a cost multiplier under technology risk in the Constructive
Systems Engineering Cost Model (COSYSMO).
* TTRL: stands for Technology Transfer Readiness Level. This scale deals with the issue that the
TRL scale measures maturity only with respect to a certain application. For example, many
mature military technologies needed time and development before getting mature enough for
civilian use. The TTRL was developed by the European Space Agency to evaluate and monitor
the transfer of technologies from space application to commercial non-space applications (Holt,
2007).
3.2.5 Readiness of other factors of program development
" MRL: Manufacturing Readiness Level addresses the gap between developing the technology and manufacturing the product. It is the only scale other than TRL used in DoD TRA assessments.
MRLs provide a common understanding of the relative maturity and risks associated with
manufacturing technologies, products, and processes being considered to meet DoD
requirements (Morgan, 2008). It is a 10-level scale that follows manufacturing from early stages
of proof of concept of manufacturability, to refining the manufacturing strategy with
demonstration of proper enabling/critical technologies, components, prototype materials,
tooling and test equipment, and personnel skills, to the full-rate reliable production with all
Manufacturing Technology Program, 2011). Figure 3.5 shows how MRLs correlate with TRLs
within the DoD Acquisition lifecycle.
* EMRL: stands for Engineering and Manufacturing Readiness Level. The Missile Defense Agency
uses this 5-level maturity scale to capture design and manufacturing knowledge for product
development, demonstration, production, and deployment (Fiorino, 2003).
" PRL: Programmatic Readiness Levels were developed by Nolte (2008) to measure the
programmatic dimension of technology maturity. PRLs mainly focus on measures of
Documentation (scientific articles/papers, progress reports, technical reports), Customer Focus
(to track the customer's changing expectations and requirements, until he settles finally by
putting money in the project), and Budget (to make sure the project has an appropriate budget
structure, for example through the use of Earned Value Management).
* LRL: The Logistics Readiness Level measures logistical support (e.g. logistics workload,
manpower requirements), especially for new technologies inserted into existing systems. The
scale goes from Lab test/R&D, to project definition, to fleet verification and use (Broadus, 2006).
An excel-based tool was developed to calculate a numeric LRL giving the percentage of required
tasks completed.
* HRL: stands for Human Readiness Level. The aim of HRL is to measure the human factors
affecting technology maturity and maturation risk. It is a 9-level scale tht records the evolution
of Human Systems Integration (HSI) considerations such as Human Factors Engineering, System
Safety, Health Hazards, Personnel Survivability, Manpower, Personnel, Training, and Habitability
(Phillips, 2010).
Other scales within that category that are mentioned in the literature, but for which we did not
find the definitions of the scales are Design Readiness Level, Operational Readiness Level, and
3.2.6 Relating the maturity scales to the multidimensional measurement of technology maturity
Now that we have laid out the different maturity measures, Table 3.3 shows how they relate to the
factors influencing Time-To-Maturity that were defined earlier:
ty and stability of Government Budget
isk Obsolescence
:ense risk, and risk of technology being leapfrogged risk measure
istable requirements iL
H RL
gstructure (dowe have enoughforeach step)
ntractingstructure and contractor incentives
1g (substituting) systems being concurrently developed
information technology availabillity and communication.
;LID~
technology properties
a- Newthingvs. adaptation-(or new use)
b- Type of technology (software vs. hardware vs. process)
Domain of technology (Space vs. weapons) RL/SRL/M
et Crainnf tarhnnkwn mnmnnn-antoce ctopml
i
WOW-ZP(Choice of g- Cost
prope TRLR&D3
proper TRI 2-Maturation stage
scae urrk n a- How much has been done?The m orewe progre
(a) and MbU unknownsewe have.
b- Howmuch isstill to be done?How difficult. What risks? 3-Manufacturingand Pr
Table 3.3 Correspondence between maturity measures and factors influencing "time to maturity"
Those multiple scales allow for a more tailored measurement for every case, which means a more
complete picture of technology maturity. Hence, for a good maturity assessment, one should start by