HAL Id: hal-02347099
https://hal.umontpellier.fr/hal-02347099
Submitted on 19 Jan 2021
HAL is a multi-disciplinary open access
archive for the deposit and dissemination of sci-entific research documents, whether they are pub-lished or not. The documents may come from teaching and research institutions in France or abroad, or from public or private research centers.
L’archive ouverte pluridisciplinaire HAL, est destinée au dépôt et à la diffusion de documents scientifiques de niveau recherche, publiés ou non, émanant des établissements d’enseignement et de recherche français ou étrangers, des laboratoires publics ou privés.
Seeking signatures of reinforcement at the genetic level:
a hitchhiking mapping and candidate gene approach in
the house mouse
Carole Smadja, Etienne Loire, Pierre Caminade, Marios Thoma, Yasmin
Latour, Camille Roux, Michaela Thoss, Dustin Penn, Guila Ganem, Pierre
Boursot
To cite this version:
Carole Smadja, Etienne Loire, Pierre Caminade, Marios Thoma, Yasmin Latour, et al.. Seeking signatures of reinforcement at the genetic level: a hitchhiking mapping and candidate gene approach in the house mouse. Molecular Ecology, Wiley, 2015, 24 (16), pp.4222-4237. �10.1111/mec.13301�. �hal-02347099�
Seeking signatures of reinforcement at the genetic level: a
hitchhiking mapping and candidate gene approach in the
house mouse
Carole M. Smadja 1§, Etienne Loire 1§, Pierre Caminade 1, Marios Thoma 1, Yasmin Latour 1, Camille Roux 1,2, Michaela Thoss 3, Dustin J. Penn 3, Guila Ganem 1 and Pierre Boursot 1.
§ These authors contributed equally.
1 Institut des Sciences de l’Evolution UMR 5554 (Centre National de la Recherche
Scientifique CNRS, Institut pour la Recherche et le Développement IRD, Université de Montpellier), cc065 Université de Montpellier, Campus Triolet, 34095 Montpellier, France
2 Current address: Department of Ecology and Evolution, Lausanne University,
Biophore/Sorge, Lausanne, Switzerland
3 University of Veterinary Medicine Vienna, Konrad Lorenz Institute of Ethology,
Department of Integrative Biology and Evolution, Vienna, Austria
Corresponding author: Carole M. Smadja: carole.smadja@univ-montp2.fr
Running title: genetic signature of reinforcement
Abstract
Reinforcement is the process by which prezygotic isolation is strengthened as a response to selection against hybridisation. Most empirical support for reinforcement comes from the observation of its possible phenotypic signature: an accentuated degree of prezygotic isolation in the hybrid zone as compared to allopatry. Here, we implemented a novel approach to this question by seeking for the signature of reinforcement at the genetic level. In the house mouse, selection against hybrids and enhanced olfactory-based assortative mate preferences are observed in a hybrid zone between the two European subspecies Mus
musculus musculus and M. m. domesticus, suggesting a possible recent reinforcement
event. To test for the genetic signature of reinforcing selection and identify genes involved in sexual isolation, we adopted a hitchhiking mapping approach targeting genomic regions containing candidate genes for assortative mating in mice. We densely scanned these genomic regions in hybrid zone and allopatric samples using a large number of fast evolving microsatellite loci that allow the detection of recent selection events. We found a handful of loci showing the expected pattern of significant reduction of variability in populations close to the hybrid zone and showing assortative odour preference in mate choice experiments as compared to populations further away and displaying no such preference. These loci lie close to genes that we pinpoint as testable candidates for further investigation.
Keywords: hybrid zone, speciation, genomics, selective sweep, Major Urinary Protein,
Introduction
Identifying the mechanisms shaping the evolution of reproductive isolation between populations is critical for understanding the origin and maintenance of biodiversity. Reinforcement is the process by which prezygotic isolating barriers are strengthened in contact zones as a consequence of selection against hybridisation (Dobzhansky 1940; Servedio and Noor 2003; Smadja and Butlin 2011). This hypothesis has received
theoretical support (e.g., Servedio and Kirkpatrick 1997; Kirkpatrick and Servedio 1999; Servedio 2000, 2004; Lemmon and Kirkpatrick 2006; Servedio et al. 2009; Bank et al. 2012), though empirical tests of reinforcement are still needed. Experimental evolution studies provide the most direct method to test this hypothesis, but have rarely been conclusive (reviewed in Hostert 1997; but see Higgie et al. 2000; Matute 2010) and are applicable to a limited set of organisms. Another approach is to identify phenotypic
signatures of reinforcement in the wild, i.e. an accentuated divergence in populations living in sympatry compared to those in allopatry (Reproductive Character Displacement (RCD); Butlin 1987; Howard 1993). Examples of RCD have been found in a variety of taxa, including birds (Saetre et al. 1997), mammals (Smadja and Ganem 2005; Bimova et al. 2011), fish (Rundle and Schluter 1998; Gregorio et al. 2012), frogs (Pfennig 2003; Lemmon and Lemmon 2010), insects (Noor 1995; Nosil et al. 2003; Jaenike et al. 2006; Kronforst et al. 2007; Urbanelli and Porretta 2008), and plants (Kay and Schemske 2008; Hopkins and Rausher 2011). However, several processes other than reinforcement can potentially generate RCD (e.g., differential fusion, ecologically-based divergence, sexual selection, competition; Noor 1999), and ruling out these alternatives with only phenotypic data is difficult (but see Nosil et al. 2003; Yukilevich 2012).
The purpose of this study was to implement a novel genetic test of reinforcement, and to complement experimental phenotypic evidence for RCD already found in the wild. We investigated signatures of directional selection that can be found at the genetic level in the form of selective sweeps, i.e., a reduction in variability at the selected loci and at their neighbouring sites due to genetic hitchhiking (Maynard Smith and Haigh 1974; Barton 2000). We predicted that reinforcement should produce selective sweeps at genes subject to reinforcing selection (i.e., genes underlying prezygotic isolation) and specifically in
populations where the phenotypic signatures of reinforcement are observed (i.e., hybrid zone populations as opposed to allopatric populations). This test, by exploring new
predictions associated with a reinforcement process, has the potential to provide additional arguments in favour of this mechanism in natural systems, and to contribute to the
challenge of identifying the genes underlying reinforcement and the evolution of prezygotic isolation (Ortiz-Barrientos et al. 2009; Feder et al. 2012). Few studies have addressed the genetic basis of reinforcement, using either crosses (Hopkins and Rausher 2011) or QTL approaches (Ortiz-Barrientos et al. 2004; Saether et al. 2007), and even fewer have investigated the expected genetic signature of reinforcement, such as selective sweeps affecting genes involved in assortative mating. In a recent study, Hopkins and colleagues (2012) showed that one of the two genes involved in flower colour divergence between two
Phlox species is evolving under divergent selection in sympatric populations, which
provides evidence for reinforcement. However, when genes involved in assortative mating are not yet identified, genomic scans for exceptional divergence in sympatric populations could help pinpoint them. We adopted such an approach in the context of the
well-characterised hybrid zone between two European subspecies of the house mouse (Mus
musculus domesticus and Mus musculus musculus), in which there is strong phenotypic
evidence of assortative mate preference displacement suggesting the action of reinforcement.
These two taxa are thought to have originally diverged in allopatry in the Middle East and Western Asia during the last 500 K years. More recently, M. m. domesticus colonised the Mediterranean basin and Western Europe, likely from the cradle in the fertile crescent, whereas M. m. musculus colonised Eastern Europe from a cradle in central Asia (Boursot et al. 1996; Duvaux et al. 2011). Following these independent expansions, the two subspecies met secondarily in the central part of Europe less than 5 K years ago (Cucchi et al. 2012). They now hybridise along a narrow zone that crosses Europe from Scandinavia to the Black Sea and has the characteristics of a tension zone (Dod et al. 2005; Raufaste et al. 2005; Macholán et al. 2007, 2008, 2011; Teeter et al. 2008). Evidence for selection against hybrids comes from observations of reduced fertility of hybrids in the laboratory and in nature (Britton-Davidian et al. 2005; Albrechtova et al. 2012; Turner et al. 2012; Bhattacharyya et al. 2013; Turner and Harr 2014) and reduced sexual attractiveness of natural hybrids when presented to parental forms (Latour et al. 2014). In addition, divergence of the mate recognition system may result in prezygotic barriers further
reducing gene flow between these two taxa. Indeed, behavioural investigations pointed out that populations from areas at the border of the hybrid zone in Denmark discriminate against each other and mate assortatively on the basis of subspecific recognition signals present in the urine (Smadja and Ganem 2002; Smadja et al. 2004; Ganem et al. 2008). Importantly, divergence of mating signals and preferences is enhanced close to the hybrid zone as compared to further away (Smadja and Ganem 2005, 2008; Ganem et al. 2008). The same pattern of reproductive character displacement has been confirmed in another part of the hybrid zone in the Czech Republic (Bimova et al. 2011). Taken together, these findings support the hypothesis that olfactory-based assortative mating is evolving by reinforcement in the house mouse hybrid zone.
Since the house mouse hybrid zone is of very recent origin (at most 3,000 years in Denmark, Cucchi et al. 2012), reinforcing selection must have started to operate only recently. To be able to detect regions that recently experienced an episode of positive selection, we used a hitchhiking mapping approach and fast evolving microsatellite loci, less abundant than SNPs but more informative to characterise very recent selective sweeps (Wiehe 1998; Kim & Stephan 2002; Schlötterer 2002, Schlötterer 2003; Kauer et al. 2003; Ihle et al. 2006; Kane and Rieseberg 2007; Chapman et al. 2008; Teschke et al. 2008; Li et al. 2010). We applied this microsatellite-based hitchhiking mapping approach to genomic regions that contain candidate genes for premating isolation in mice, so that inferences of selection can be more easily associated with reinforcing selection in contrast to any other sources of selection.
The prime genetic candidates for premating isolation in the house mouse are loci encoding pheromone signals and olfactory recognition (pheromone receptors), and we considered the most likely candidates: (i) the Major Urinary Proteins (MUPs), a family of ligand proteins that constitute pheromones involved in individual recognition and mate choice in house mice (e.g., Hurst et al. 2001; Cheetham et al. 2007) and are produced in different quantity in the urine of the two European subspecies of mice (Stopková et al. 2007) and (ii) the Vomeronasal Receptors (VRs), a family of G protein-coupled receptors that mediate pheromone reception and signal transduction in mammals (e.g., Lane et al. 2004; Ibarra-Soria et al. 2013), have the potential to specifically detect sex-specific, conspecific and heterospecific signals in mice (Isogai et al. 2011) and the repertoire of which varies between mouse subspecies (Wynn et al. 2012). Both MUPs and VRs belong to large multigene families whose genomic organisation has been characterised in the mouse genome (Figure S1): the MUPs are grouped in a cluster on chromosome 4 containing 21 intact genes and 21 pseudogenes (Logan et al. 2008; Mudge et al. 2008), while the
numerous VR loci, divided into two families V1R and V2R, are spread out over several chromosomes (V1R: 164 intact genes on chromosomes 6, 7, 13 and 17; Zhang et al. 2007; V2R: 63 intact genes on 8 different chromosome, Yang and Zhang 2007).
We set out to screen as many microsatellite loci as possible in large genomic regions containing these candidate genes, in samples representative of the hybrid zone and
allopatric areas. As we expected the sought signal of reinforcing selection to concern only a small number of genes, the exploration of such a large genomic region could serve as an internal control overall not submitted to the selective process we are interested in. We focused on the M. m. musculus side of the contact zone where signs of reinforcement were previously shown to be the strongest (Smadja and Ganem 2005; Ganem et al. 2008; Latour et al. 2014) and chose three sampling areas: (1) the border of the hybrid zone in Denmark (50 km North to the genetic centre of hybrid zone) where strong assortative mating was documented (‘Contact’ sample) (Smadja et al. 2004; Smadja and Ganem 2005), (2) another area in Denmark but further out of the hybrid zone, where assortative mating is expected and was found to be absent (‘Close allopatry’ sample); and (3) an area located very far from the hybrid zone, namely in Vienna, Austria (‘Distant allopatry’ sample). Genomic regions showing a significant reduction of variability specifically in the contact zone sample, as compared to the two allopatric samples, could be considered to contain genes involved in the reinforcement process.
MATERIALS AND METHODS
Sampling
All mice used in this study were wild trapped in Jutland, Denmark in October 2010 (‘Contact’ and ‘Close allopatry’ mice) or around Vienna, Austria, in October-December 2010 (‘Distant allopatry’ mice). In Denmark, ‘Contact’ mice were trapped at the northern edge of the hybrid zone where evidence of strong assortative mate preference was
documented (Smadja et al. 2004). ‘Close allopatry’ mice were trapped approximately 50 km North of the M. m. musculus border of the zone. In each geographical area (‘Contact’, ‘Close allopatry’, ‘Distant allopatry’), we selected 4 mice from each of 8 different sites (consisting of farms and other human dwellings), leading to 32 individuals per zone (Table S1 and Figure S2). We balanced the number of males and females from each geographical zone as much as possible.
Mate preference estimation
Assortative mate preference was assessed in a sample of 100 wild male and female mice trapped as adults in the same sites as mice involved in the genetic study and therefore representing the three geographical areas (‘Contact’, ‘Close allopatry’, ‘Distant allopatry’). Following previous studies (Smadja and Ganem 2002, 2005; Ganem et al. 2008; Latour et al. 2014), mate preference for hetero- or homosubspecifics was assessed by presenting urinary stimuli representative of each subspecies. The protocols used to prepare urinary stimuli and assess mate preferences are described in detail in the Supplementary Material.
Hybrid index estimation
To evaluate the subspecific ancestry of our samples, we used PCR assays of
insertion/deletion polymorphisms of transposable elements, determined to have contrasted allele frequencies between the two subspecies in allopatry. Eighteen of these markers were autosomal, two were X-linked and one Y-linked. On this basis, samples could be
characterised by a multilocus hybrid index estimated by maximum likelihood given the parental allele frequencies estimated in samples from populations more than 200km away from the hybrid zone. The loci and experimental procedures are identical to those described in Latour et al. (2014).
DNA sample preparation
DNA was extracted from mouse ear samples and DNA quality was controlled on agarose gel. Since our genomic scan approach required a large number of microsatellite loci, we adopted a DNA pooling strategy (Shaw et al. 1998; Skalski et al. 2006; Thomas et al. 2007; Teschke et al. 2008) and constitute DNA pools representing each of the three geographic regions (‘Contact’, ‘Close allopatry’ and ‘Distant allopatry’) by pooling DNA extracts of 32 individuals per geographic region (Table S1). To ensure equimolarity of each pool, we quantified individual DNA extracts based on three independent measures of absorbance using a Nanodrop instrument and diluted each individual sample to about 30 ng/µL. These three pools were used for the large-scale microsatellite typing, in which DNA from a single specimen was also included as a control for PCR quality (mouse I693, see Table S1).
Genomic regions and microsatellite markers analysed
Definition of the studied genomic regions
The list of annotated genes and pseudogenes corresponding to Major Urinary Proteins and Vomeronasal Receptors was downloaded from the Mouse Genome Informatics (MGI) database (www.informatics.jax.org). Genes and pseudogenes that were less than 400 kb apart were arbitrarily grouped together, and 200 kb were added on each side of the
There were a total of 342 intact genes and 164 pseudogenes (Table S2) distributed among 49 clusters (Table S3) on 15 different chromosomes, and spanning a total of nearly 48 Mb.
Search of microsatellite loci and design of PCR primers
We used an automated pipeline (adapted from the msfinder Perl pipeline originally developed by Dr. Till Bayer) to find in the reference mouse genome all microsatellite loci with characteristics suitable for this study (purity of the array of repeats, number of repeats). We then defined PCR primers flanking these arrays and predicted to generate unique PCR products based on the reference mouse genome sequence. Whenever possible, primers lying outside repeated elements were chosen but otherwise, one of the two primers was allowed to overlap with such an element. From the resulting list, we selected 1,248 loci for the experiment. By choosing such a scale we were able to include all possible loci lying between the first and last gene of each of the clusters we defined, as well as some flanking loci. The average distance to the nearest candidate gene was 20 kb and the average distance between adjacent microsatellites was 33 kb.
Large-scale screening on pooled samples
The 1,248 microsatellite loci were typed on four samples: the three pooled samples representing the ‘Contact’, ‘Close allopatry’ and ‘Distant allopatry’ areas and a single individual sample used as a control (see ‘Data analysis’). Each locus was PCR amplified independently for each sample (1,248*4 = 4,992 PCR reactions performed). The PCR primers used were not fluorescently labelled because of excessive cost, but one primer for each locus had a common, non locus-specific, 18 bp 5’ tail added. The inclusion in each locus-specific reaction of a third, fluorescently labelled, primer with a sequence identical to this common 18 bp tail allowed the production of fluorescently labelled PCR products, this suing only one labelled primer per colour rather than one per locus. Primer pairs were
distributed into four groups with non-overlapping ranges of predicted PCR product sizes, and each group was treated with a different colour. Each capillary for electrophoresis on the automated sequencer (ABI) was loaded with a mixture of four loci with different colours, and thus also different size ranges, so as to minimise possible interference between loci in the interpretation of the complex electrophoregrams resulting from the pooled samples. All pipetting needed for this large scale experiment (from separate ingredients to complete PCR mixtures and sequencer loading preparation) were performed using pipetting robots executing commands generated by ad hoc in–house programs ensuring traceability and accuracy. Further details of the protocols are described in Supplementary Materials.
Validation of the pooling approach
We conducted a pilot experiment to assess our ability to estimate microsatellite heterozygosity from pooled DNA samples. We used 14 M. m. musculus and M. m.
domesticus samples from various geographical origins across the ranges of the two
subspecies (Table S4). We first typed 96 microsatellite loci out of the 1,248 loci in the conditions of our main experiment (the 3 pools and the control individual). On the basis of visual inspection of the profiles (see below), we selected 24 loci that passed the quality filters. We PCR amplified those 24 microsatellite loci on the 14 samples separately, and compared the heterozygosity estimated on this basis to that estimated from the PCR product on the pool of these 14 samples (see below the method of heterozygosity estimation from pooled samples).
We also verified the results obtained in the large-scale screening on the pooled samples for some loci identified as potential candidates for selection linked to reinforcement. These loci were typed separately on each of the individuals included in the DNA pools (3x32
individual samples rather than 3 pools corresponding to the three geographical areas: ‘Contact’, ‘Close allopatry’, and ‘Distant allopatry’).
Data analysis
Analysis of microsatellite electrophoregrams and filtering steps
The chromatograms of the capillary electrophoresis were generated with the GeneMapper v4.0 software (Applied Biosystems). We checked them visually for the 1,248 markers in order to discard uninformative ones, defined as follows: 1) the profile of the “control” individual exhibited an abnormally high number of peaks: we thus suspected artefactual PCR amplification; 2) PCR product sizes overlapped those of another locus loaded in the same capillary: this was not expected in our design (see above and supplementary
methods), may reflect structural variations outside the microsatellite, and in any case could cause interference between loci in the interpretation of the chromatograms; 3) the profiles of the three DNA pools had multiple peaks but exhibited exactly the same pattern: such high similarity obtained from such complex and disparate samples is likely to result from PCR artefacts.
For the remaining loci, we applied additional filtering conditions on the quantitative data (list of peaks each characterised by its area and estimated DNA fragment length) attempting to exclude loci that failed and otherwise exclude non-reliable peaks in the complex profiles from pooled DNAs. We first discarded peaks with intensities inferior to 50 RFUs (Relative Fluorescence Units) as they were not distinguishable from base noise, and migration profiles with no signal (total peak area of zero). We then used custom R scripts to automatically filter out uninformative migration profiles and peaks, conditionally to
areas of all peaks was lower than a certain quantile of the empirical distribution across loci (parameter “Quant”), 2) we discarded peaks corresponding to fragment lengths predicting a number of repeats of the microsatellite motif differing from that of the reference genome by more or less than certain numbers (parameters “Max” and “Min”, respectively), 3) peaks with intensities (relative to the total signal summed over all peaks) lower than a certain threshold (parameter “Freq” were discarded.
Heterozygosity and lnRH estimation
All peaks retained by the filtering procedure above were treated as if they were alleles with frequencies estimated as the relative intensities of the peaks, and used for the estimation of heterozygosity on pooled data. No correction for sample size bias was applied since all pooled samples were prepared from the same number of individuals. We tried several values of the peak filtering parameters described above, and retained the combination that led to the best correlation with heterozygosity estimated from individual genotyping in the pilot experiment. The retained combination of filtering parameters was then applied to the main experiment.
We then computed the lnRH statistic (Kauer et al. 2003 (equation 2); Schlötterer and Dieringer 2005) for each pair of pooled samples and each locus, using estimates of
heterozygosity derived as described above. Null values of hererozygosities would prevent quantitative estimate of lnRH due to division by zero, so they were replaced by the smallest possible value (two alleles, one of which with a frequency of 1 over twice the number of individuals in the pool). The lnRH statistics is the log ratio of estimators of 4Nu in two compared populations, based on estimated heterozygosities at the locus considered. A significantly negative value as compared to the distribution over loci would indicate reduced variability in the numerator population as compared to the denominator one,
possibly caused by a selective sweep in the former population at the focal locus. The lnRH statistics equals zero when the two compared samples have equal heterozygosities at a given marker. For each pair of samples considered, we used the Kolmogorov-Smirnov test to evaluate whether the observed lnRH statistics were normally distributed across loci, and we calculated skewness and kurtosis for each distribution.
Identification of candidate microsatellite loci under selection in the contact zone sample
Loci were classified as candidate if they exhibited both an exceptionally low (negative) lnRH in the ‘Contact’ / ‘Close allopatry’ comparison, and an average value in the
comparison between the two allopatric samples (‘Close allopatry’ / ‘Distant allopatry’). As the lnRH values across loci in our study were not normally distributed, we used Gaussian mixture models to infer outlier loci from the relevant lnRH distributions (e.g., Aggarwal, 2013; Duforet-Frebourg et al. 2014).
We searched for a potential over-representation of outlier loci in some of the genomic clusters defined in the study irrespective of their position within clusters, using a binomial test (probability of success = number of outliers / number of tested loci, success = number of outliers in the cluster, failure = number of loci in the cluster – number of success). We also tested for an aggregation of outliers along the chromosomes. This distance analysis tested the prediction that outlier loci will be closer together than randomly selected pairs of loci if they are influenced by the same event of selective sweep at one point in the cluster. In each cluster, we randomly selected a number of loci equal to the number of outliers (replicated 100,000 times). We then recorded the minimal distance between the genomic positions of these random outliers in order to generate an expected distribution. The observed value of the minimum distance between outliers was then compared to the simulated distribution in order to obtain an empirical P-value.
Identification of genes showing regional patterns of reduced diversity
To test whether low diversity is associated with some candidate MUP and VR genes significantly more often than expected and identify those candidate genes showing a regional pattern of reduced variability (i.e. sweep windows), we performed the following tests. For the first test (permutation test), we defined windows of 200kb around each gene (100kb on each side) containing at least 3 microsatellite loci, and computed the observed mean lnRH. Then, for each window, we sampled in the whole dataset as many lnRH values as there were loci in the window, computed the mean lnRH value in each permutation, generating an expected distribution (n = 100,000). We then examined genes whose mean lnRH value lie below the fifth percentile of its expected distribution.
This approach was complement by another test (a resampling test), designed to account for the correlation structure among microsatellite loci in our permutation. Instead of permuting the loci, we directly sampled 200kb windows in our dataset, allowing loci to stay grouped. Again, we kept only windows containing at least 3 loci were rejected. In order to compare the genetic diversity of those random windows - which contain a variable number of microsatellite loci and variable distances among those loci - to the one observed around a gene, we defined a weighted mean lnRH as follows:
𝑊ln𝑅𝐻 = ∑
!"#
$ (&!'($)&!'($)#)/,-$./($,$)#) #$% ,
where dist(i,i+1) is the genomic distance between loci i and i+1. Thus, more weight is given to physically close loci when computing the mean lnRH. The observed WlnRH was compared for each gene to the WlnRH distribution generated by sampling 100,000 windows in our dataset. We examined genes whose WlnRH values were below the fifth percentile of the random distribution.
Data accessibility
Primer information as well as all genotyping and behavioural raw data are available on Dryad (http://dx.doi.org/10.5061/dryad.c6jh2). Scripts developed for data analysis are available upon request.
RESULTS
Mate odour preferences
The preference for opposite sex odour displayed by mice from the ‘Contact’ sample was significantly higher compared to the allopatric mice (ANOVA: F1,99 = 4.26, P = 0.04) and
for males compared to females (F1,99 = 8.68, P = 0.004). Moreover, these preferences were
assortative (i.e., more time spent with the M. m. musculus than with the M. m. domesticus stimulus) only in the ‘Contact’ sample (Student t tests with 𝑋) = [time sniffing musculus stimulus] – [time sniffing domesticus stimulus]: Contact: n = 45, 𝑋) = 0.15 ± 0.04, t = 3.63,
P = 0.0007; Close allopatry: n = 36, 𝑋) = 0.047 ± 0.049, t = 0.95, P = 0.35; Distant allopatry: n = 19, 𝑋) = 0.008 ± 0.086, t = 0.088, P = 0.93). We thus confirmed that mice from the same localities of origin as those used for the scan for selection were
behaviourally divergent with assortative mate preference only observed in the ‘Contact’ geographical zone.
Hybrid index
The maximum likelihood estimate of HI (0 for pure domesticus and 1 for pure musculus) was 0.989 for the ‘Contact’ sample (2LL interval: 0.980-0.994, n = 32) and 0.993 for the ‘Close allopatry’ sample (2LL interval: 0.987-0.997, n = 32). The distribution of HI across individuals (see Table S1) did not reveal any outlier, that could be due for instance to long distance migrants from another population with a different HI, or sample identification
error. The fact that the ‘Contact’ and ‘Close allopatry’ samples have similar subspecific ancestry proportions (but differ in their behavioural phenotype) makes them particularly appropriate to search for genetic differences that could explain behavioural divergence.
Validation of the pooling approach
In the pilot study, we compared heterozygosity estimated from individual and pool typing on a sample of 24 microsatellite loci that passed the initial quality filters applied to all loci in the genomic scan. Figure S3 shows the results obtained with different parameter sets used to filter the peaks in the complex profiles (see material and methods). The correlation between the two estimates of heterozygosity is generally high (e.g., r2 = 0.815), and little affected by the filtering parameters. For the following steps, however, we selected the set of filtering parameters that gave the highest correlation in this pilot experiment (r2 = 0.968; Figure 1; filtering parameters: Min = −10; Max = 10; Quant = 0.001; Freq = 1/2N = 1/28). The pilot experiment therefore indicated that multiplexed microsatellite profiles combined with stringent filtering steps could provide relevant information for the estimation of heterozygosity from pooled samples. We thus applied this pooling strategy to screen levels of heterozygosity in different samples at a very large scale (1,248 microsatellite loci), using the optimised set of automated filtering parameters tested in the pilot experiment but
adjusting the threshold of peak size to sample size in this experiment (Freq = 1/64). Note though that small peaks (translating into low allele frequency estimates) have anyway little effect on heterozygosity estimates.
Effective scale and density of the scan for selection
We surveyed a total of 1,248 microsatellite loci in the ‘Contact’ (Denmark), ‘Close allopatry’ (Denmark) and ‘Distant allopatry’ (Austria) samples. We obtained migration profiles for all loci, but by combining visual and automated filtering steps to discard
uninformative peaks and profiles (see Methods), we excluded 499 loci. Heterozygosity and lnRH statistics were thus computed on a final set of 749 loci, among which 30 were
monomorphic over the combined samples. The average inter-locus distance (within clusters) was 37 kb but was very heterogeneous (standard deviation 144 kb), some regions were poorly covered (Figure S5), and some clusters had no microsatellite. Within a window of 50 kb centred on the locus, 251 loci had more than two neighbouring loci. This number rose to 533 with 100 kb windows and 686 with 200 kb.
Variation in heterozygosity and lnRH distributions between pairs of samples
As expected, heterozygosity varied among microsatellite types, with highly mutable loci (long and perfect repeats) showing the highest heterozygosity (Figure S4). We found that variability did not differ between the ‘Contact’ and the ‘Close allopatry’ samples (H Contact =
0.560 ± 0.010 (mean ± SE), H Close allopatry = 0.560 ± 0.010, Wilcoxon signed rank test, n =
721, V = 128697, P = 0.696) while ‘Close allopatry’ was significantly less variable than ‘Distant allopatry’ (H Distant allopatry = 0.563 ± 0.010, Wilcoxon signed rank test, n = 718, V =
114378, P = 0.030).
In order to perform our scan for traces of hitchhiking, we used the lnRH statistics. It is expected to be normally distributed, with apparent robustness of this prediction to the exact demographic history of populations (Schlötterer and Dieringer 2005), thus allowing the application of parametric tests. However, we found that none of the three pairwise comparisons produced normally distributed lnRH (Kolmogorov-Smirnov tests: Contact-Close allopatry: D= 0.11, P= 5.2E-8; Contact-Distant allopatry: D= 0.0973, P = 4.9E-06; Close allopatry-Distant allopatry: D= 0.0973, P= 2.5E-06). As shown in Figure 2, the distributions were zero inflated and slightly skewed (Skewness tests: Contact-Close
allopatry-Distant allopatry: skew= 0.53, P = 0.0002). We found that the ‘Contact’/‘Distant allopatry’ and the ‘Close allopatry’/‘Distant allopatry’ lnRH distributions had similar variances (Levene’s tests: F = 0.014, P= 0.91), but the ‘Contact’/‘Close allopatry’ distribution had a significantly lower variance (Levene’s tests: comparison between
Contact/Close allopatry and Contact/Distant allopatry distributions: F = 43.1, P = 7.5E-11; comparison between Contact/Close allopatry and Close allopatry/Distant allopatry
distributions: F = 40.8, P = 2.2E-10). Similar statistics can be computed for each gene, gene cluster and gene family, as reported in Supplementary Table S5. Overall, at those different genomic scales, lnRH estimates did not significantly differ from global
estimations on the whole dataset. However, lnRH was significantly lower in clusters 16VR and 36VR than for the whole dataset, when comparing the 'Contact' and 'Distant allopatry' samples (Wilcoxon paired rank test, FDR < 0.05, Table S5). Moreover, the V1R gene family exhibited significantly lower mean lnRH values than the other gene families for the 'Contact' versus 'Close allopatry' comparison.
Identification of microsatellite loci showing signs of selection exclusively in the contact
zone sample
Applying Gaussian mixture models to the ‘Contact/Close allopatry’ and ‘Close
allopatry/Distant allopatry’ lnRH distributions, we found that the best model allowing us to cluster each of them (BIC factor < 2000) was a mixture of two underlying normal
distributions of similar means (near zero for ‘Contact’/‘Close allopatry’, and slightly inferior to zero for ‘Close allopatry’/‘Distant allopatry’) but with dissimilar variances (Figure 3). The central part of each lnRH distribution was assigned to a low variance normal distribution, this part of the distribution being likely to aggregate loci driven by common, neutral evolutionary forces, while the extreme part of the distribution was assigned to a high variance normal distribution likely to aggregate loci experiencing
sample-specific selective processes. We therefore computed the posterior probabilities of each locus being assigned to one of the distributions and used them to identify outlier loci (i.e. posterior probability of belonging to the high variance distribution > 0.95, Table S5 - sheets 6 & 7). We retained as candidate loci for reinforcement those that were outliers with negative lnRH values in the ‘Contact’/‘Close allopatry’ comparison. To be conservative, we however excluded loci that were outliers (positive or negative lnRH values) in the ‘Close allopatry’/‘Distant allopatry’ comparison, after which 17 loci were retained as candidates for hitchhiking in the ‘Contact’ sample (Table 1). We randomly selected 9 of these for individual typing and could confirm in 8 cases the pattern observed on the pooled data (Table S6). The closest candidate genes (Vomeronasal Receptors or Major Urinary Proteins) to the 17 candidate microsatellite loci are listed in Table 1.
We examined the genomic organisation and physical proximity of candidate microsatellite loci (Figure S5). We first tested whether candidate loci tended to concentrate on some of the gene clusters we defined using a binomial test. We did not find any significant results, but we found a tendency for the candidate loci to concentrate on cluster 16 VR on
chromosome 6 (containing 4 candidate loci, P= 0.066, Table S7). We then searched for unusual proximities between pairs of candidate loci (permutation test by simulation) but found no significant such evidence (Table S7). We however note that candidate
microsatellites ‘14326’ and ‘14363’ are only 38 kb apart on cluster 16VR (Table 1).
Identification of genes showing regional patterns of reduced diversity
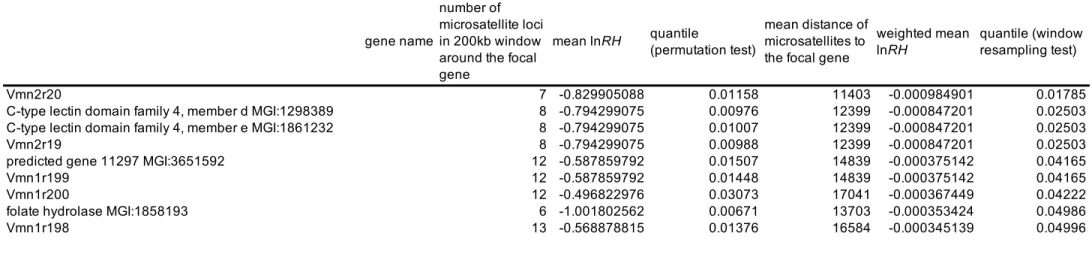
We found 20 genes showing a significant regional pattern of reduced variability (in 200kb windows around each gene), among which 14 VRs, 2 MUPs and 6 other genes present in the genomic clusters under study (permutation test, Table S8). When accounting for the correlation structure among microsatellite loci (windows resampling test), we found 9 genes showing a significant regional pattern of reduced variability, among which 5 VRs
and 4 genes unrelated to MUP and VR gene families, all of them being also detected as outliers in the permutation test (Table 2). As expected the test taking into account the correlation structure is more stringent. In both cases, some genes (two C-type lectin genes; one folate hydrolase and 3 predicted genes of unknown function) not belonging to the original list of candidate genes were found to exhibit a significant regional pattern of reduced diversity.
DISCUSSION
In this study, we developed a microsatellite-based hitchhiking mapping approach to seek for the genetic signature of a potentially recent event of reinforcement in the house mouse. We carried out a large-scale scan for selection in candidate genomic regions for sexual isolation, namely regions with members of the large multigene families of MUPs and VRs. We expected loci under reinforcing selection to show reduced variability in populations close to the hybrid zone where assortative mating is enhanced as compared to populations further away from the hybrid zone. To enhance the power of our approach, we used as many microsatellite markers as possible spread across large genomic regions containing candidate genes, and to render this feasible, we applied a pooling strategy and automated scoring methods. The high correlation between heterozygosity estimates from pooled and non-pooled samples confirmed that we could infer heterozygosity from the peak patterns of pooled samples. An outlier analysis identified a handful of loci showing significant
reduction of diversity in the sample close to the contact zone and showing behavioural phenotypes suggestive of reinforcement, as compared to a close population that does not display such phenotype. This suggests that some VR or MUP genes close to these outlier
microsatellite markers could be under selection in the hybrid zone and involved in sexual isolation in the house mouse. We address each of our main findings below in more detail.
Large-scale scan for selection based on microsatellites using pooled samples
Assessing variation in nearly 100 samples at more than a thousand microsatellite loci is a technical challenge hampered by budgetary constraints. We used a strategy to reduce cost of reagents (labelled primers), but also had to use a pooling approach to make the
experiment feasible. Previous studies have used a pooling approach to carry out a visual pre-screen of loci potentially under selection, but without quantitative inference of heterozygosity or allele numbers from peak patterns (Thomas et al. 2007; Teschke et al. 2008). Inferring allele frequencies from pooled samples would ideally imply being able to differentiate peaks corresponding to alleles from artefacts. One source of artefacts is unspecific PCR, which can be detected because most of the time it produces identical patterns across samples. We eliminated loci with identical patterns across samples, as well as peaks of very low intensities, or peaks corresponding to unexpectedly short or long fragments. The second and most serious source of artefactual peaks is polymerase stuttering. In the case of individual typing, stutter peaks can usually be inferred because their intensity is lower than that of real peaks, and because of the simple expectations of only one or two major non-stuttering peaks for a diploid individual. However in the case of pooled samples, teasing apart genuine and stuttering peaks would need specific statistical modelling with training on the loci and samples used (e.g., Schnack et al. 2004), which we were not able to conduct on such a large number of loci. We therefore used the
electrophoregram as if each peak represented an allele and its intensity the allele frequency to derive what appeared to be a reasonable proxy of heterozygosity. There is little doubt that estimates of H derived this way must be biased for some loci, but the pilot study showed a high overall correlation between this measure and heterozygosity estimated by
the more accurate individual typing procedure. This presumably reflects the fact that the major peaks (highly influencing heterozygosity estimation) in the pooled profiles generally represent actual alleles, and artefacts mostly lie in minor peaks (that have little influence on heterozygosity estimates). We also attempted to minimise the potential bias by applying a stringent locus filtering procedure, but at a price of eliminating many of them (449 out of 1,248). Moreover, Skalski et al. (2006) had shown that, even in the presence of bias in allele frequency estimation, the pooling approach could be accurately used to detect relative differences in allele frequency among samples, as long as pool size was sufficiently large (n ≥ 24, and here we used n = 32).
The lnRH statistic and inference of selection
Microsatellite markers are less dense than single nucleotide polymorphisms (SNPs) but offer the advantage of being multiallelic markers, which is highly informative for detecting potentially mild and recent reductions in diversity. We used the lnRH statistics to detect population-specific signs of selection because it has a number of interesting properties, especially when applied to microsatellites: it accounts for overall differences of variability between populations, is insensitive to variations of mutation rates among loci, its
distribution can be predicted to be Normal and appears rather robust to the demographic history of populations (Kauer et al. 2003; Schöfl and Schlötterer 2004; Schlötterer and Dieringer 2005). However in our study, departure from normality of the lnRH distributions did not allow the straightforward detection of outliers from the density function of a normal distribution as applied in a number of previous studies (e.g., Schlötterer 2002; Kauer et al. 2003; Kane and Rieseberg 2007).
As compared to the Normal expectation, our empirical distributions of lnRH showed an excess of near zero values and reduced variance in all pairwise population comparisons, but
especially so in that between the two Danish populations. There is evidence that the colonisation of Northern Jutland by M. m. musculus is recent and was accompanied by a probable bottleneck (Prager et al. 1993), and simulations have shown that recent
bottlenecks can result in slightly narrower lnRH distributions (Schlötterer 2002; Schlötterer and Dieringer 2005). Note though that this relative lack of overall differentiation between the two Danish populations put us in a favourable situation to detect divergence under selection after the foundation of Denmark (Schlötterer 2002). The fact that these Danish populations appear similarly affected by introgression from M. m. domesticus, as attested by our estimations of hybrid index, is also favourable for the same reason.
Although part of the deviation from normality of the lnRH distribution could thus be attributed to demographic history, most of it is likely due to a bias in the estimate of heterozygosity from pooled samples, most probably through the inclusion of loci with patterns resembling each other across samples because of undetected PCR artefacts
affecting all samples alike. However, this bias is not expected to create false outliers of the lnRH distribution, which is why we considered legitimate to look for outliers in the tails of the high variance Gaussian of the adjusted mixture model.
Microsatellite loci potentially under hitchhiking by reinforcing selection and related
candidate genes
Our analyses pinpointed a relatively large number of potential candidates for hitchhiking in pairwise sample comparisons: 56 outliers in the comparison between the two allopatric populations, and 63 between the two Danish populations (Table S5). This may indicate that divergent selection is frequent in these genomic regions, with causes independent from hybridisation and reinforcement. However the combination of predictions for these two sample contrasts identified only 17 microsatellites showing the expected pattern for
candidate loci for reinforcement, i.e. a significant reduction in diversity in ‘Contact’
compared to ‘Close allopatry’, and no difference between the two allopatric samples. These 17 loci meet the predictions of variability contrasts expected under hitchhiking by selection specifically acting in the Contact sample where the reinforcement phenotype is observed, as opposed to the closely related Danish sample where it is not observed. The candidate genes closest to the outlier microsatellite loci belong to the three families of genes we considered (V1R, V2R and MUP genes). We also found that some outlier microsatellites lie near or within other genes present in the genomic clusters but not listed as candidates (Table 1). Although the putative functions of these genes are usually unknown, it is possible that selection on these genes could have influenced patterns of reduced variability in these candidate regions and that they are involved in the phenotype we are interested in. Nevertheless, the MUP and VR genes lying closed to the outlier microsatellite loci
constitute the most likely targets of reinforcing selection. It is interesting to notice that the candidate VRs belong to the two families of vomeronasal receptors (V1Rs and V2Rs). Although V1Rs are thought to be involved in the detection of physiological status of other animals and V2Rs are thought to be involved in pheromone recognition (Chamero et al. 2012), recent advances challenge this categorisation. In particular, Isogai et al. (2011) provided a comprehensive functional characterisation of a large set of VRs, and revealed that both V1R and V2R are involved in conspecific and pheromone recognition. This functional study however concerned only a subset of VRs and focused on particular cues (female, male, other Mus species, and predator cues) not including subspecies specific cues, making any further interpretation of our results in the light of functional characterisation at the gene level premature, but perhaps testable in the future. We also found that the outlier microsatellite loci lying close to each other in the genome (loci ‘14326’ and ‘14363’ on chromosome 6) map slightly upstream of the Vmn1r4 gene, potentially affecting a region regulating expression of this VR gene or of the entire cluster of closely related VR genes
downstream of Vmn1r4 (subclade C: Vmn1r5 to Vmn1r20) (Stewart and Lane 2007). In fact, regulatory changes could contribute to the evolution of premating isolation in the house mouse hybrid zone, which could be tested by comparing gene expression between allopatric and contact zone populations.
Under a hard sweep scenario, selection and hitchhiking are expected to leave regional signatures of reduced variability, i.e. sweep windows around selected loci. Screens for recent selective sweeps in mouse populations have revealed frequent hitchhiking effects spanning hundreds of kilobases (Teschke et al. 2008; Staubach et al. 2012), i.e. regions much larger than the typical scale of background linkage disequilibrium prevailing in mouse populations that extends at most over 100 kb (Laurie et al. 2007; Staubach et al. 2012). In our case, it is difficult to predict the extent of sweeps under a reinforcement scenario without information about the strength of selection and the type of selection acting (hard versus soft sweep), but we can expect some regional patterns of reduced variability to be detectable within 100 to 200kb regions. We did not find any clustering of the candidate microsatellite loci along the genome, which could have been detected only if several markers within a sweep window were to present extreme reductions of variability.
However, we identified several MUP and VR genes showing significant regional patterns of reduced variability (Table 2). Most of the microsatellite loci around those genes do not present exceptionally low levels of diversity, but the average over the 200kb window is low. Those MUP and VR genes showing regional patterns of reduced variability therefore also constitute interesting candidates for reinforcement, and in particular the ones that both show this regional pattern of low diversity and lie in the vicinity of an outlier microsatellite locus (Vmn2r19 and its neighbour Vmn2r20, as well as Vmn1r198). We note however that the strategy of hitchhiking mapping we applied here is expected to be mostly efficient in detecting hard sweeps where a novel advantageous mutation spreads rapidly to fixation
(Thornton et al. 2007). Soft selective sweeps and polygenic adaptation (Przeworski et al. 2005; Pritchard et al. 2010) would be difficult to detect using an approach like ours, despite being also consistent with a reinforcement process (Hopkins et al. 2012). Targeted or whole-genome resequencing could complement the approach taken here by enabling a denser analysis of marker loci and the use of other methods to detect selection.
Reinforcement or other causes?
One difficulty when addressing reinforcement is ruling out the possibility that differences between allopatric and sympatric samples are not due to other causes (Noor 1999). Whether the inferred selection is linked to behavioural reinforcement (rather than adaptation to local environmental conditions) can only be evaluated by indirect arguments. One argument is that, given the close geographic origins in Northern Jutland of the ‘Contact’ and ‘Close allopatry’ samples, they share a very recent common ancestor and live in very similar environments, yet show contrasted subspecific mate preferences. We therefore expect genetic differences between these two samples to reflect, at least in part, the observed differences in behaviour. However, we cannot rule out the possibility of other selective processes differentially affecting the ‘Contact’ and ‘Close allopatry’ samples since we also found some loci specifically under selection in the ‘Close allopatry’ sample. As we
developed a hypothesis-driven strategy focusing on genomic regions bearing genes known to be involved in pheromone recognition in mice, most of the outlier microsatellite loci lie near MUP or VR genes, suggesting in those cases that the identified selective processes should be more likely related to pheromone recognition functions than to any other type of function. It is possible that such pheromone recognition functions are selected in the frame of local sexual selection regimes unrelated to reinforcement in the contact zone.
Nevertheless, if our candidate genomic regions are the targets of reinforcing selection, loci experiencing this type of selection should be contained in the group of candidate loci
showing a reduction of variability in the ‘Contact’ sample. The approach taken here therefore provides a first list of candidates whose role as barriers to gene flow could be confirmed by scaling up this type of analysis to more biological replicates and by
combining other lines of evidence at the genetic level such as patterns of introgression of the candidate loci across the hybrid zone. This study nevertheless represents the first attempt to tackle the question of the genetic signature of reinforcement at a large genetic scale, which should open new research directions in the future.
ACKNOWLEDGEMENTS
We warmly thank Josette Catalan, Marco Perriat-Sanguinet and Vanessa Sutaine who helped us to collect mice in Denmark in 2010. We also wish to thank the Danish farmers and people of Jutland who kindly accepted our intrusion. We are grateful to R. Osterballe and Givskud zoo for their warm support during fieldwork. We thank Till Bayer from the GEOMAR Helmholtz Center for Ocean Research for sharing with us the msfinder program he developed, and Khalid Belkhir, from the Institut des Sciences de l’Evolution
(Montpellier, France) for his help in modifying the msfinder program. Capillary electrophoresis was conducted on the GenSeq platform of LabEx CeMEB (Centre
Méditerranéen Environnement et Biodiversité). We also thank Teresa Klaus for assistance with Y-maze experiments in Vienna. Finally, we thank Diethard Tautz and Meike Teschke from the Max Planck Institute for Evolutionary Biology (Plön, Germany) and Roger Butlin (University of Sheffield, UK) for discussions on this study.
The research leading to these results has received funding from the European Union's Seventh Framework Programme [FP7/2007-2013] - Marie Curie European Reintegration Grant (ERG), under grant agreement n°PERG06-GA-2009-251008, as well as from the Agence Nationale pour la Recherche (ANR) under grant agreement No.
REFERENCES
Aggarwal, C. C. 2013. Outlier Analysis. Springer New York, New York, NY.
Albrechtova, J., T. Albrecht, S. J. E. Baird, M. Macholan, G. Rudolfsen, P. Munclinger, P. K. Tucker, and J. Pialek. 2012. Sperm-related phenotypes implicated in both
maintenance and breakdown of a natural species barrier in the house mouse. Proc. R. Soc. B-Biological Sci. 279:4803–4810.
Bank, C., J. Hermisson, and M. Kirkpatrick. 2012. Can reinforcement complete speciation? Evolution (N. Y). 66:229–239.
Barton, N. H. 2000. Genetic hitchhiking. Philos. Trans. R. Soc. London Ser. B-Biological Sci. 355:1553–1562.
Bhattacharyya, T., S. Gregorova, O. Mihola, M. Anger, J. Sebestova, P. Denny, P. Simecek, and J. Forejt. 2013. Mechanistic basis of infertility of mouse intersubspecific hybrids. Proc. Natl. Acad. Sci. 110:E468–E477.
Bimova, B. V, M. Macholan, S. J. E. Baird, P. Munclinger, P. Dufkova, C. M. Laukaitis, R. C. Karn, K. Luzynski, P. K. Tucker, and J. Pialek. 2011. Reinforcement selection acting on the European house mouse hybrid zone. Mol. Ecol. 20:2403–2424. Boursot, P., W. Din, R. Anand, D. Darviche, B. Dod, F. Von Deimling, G. P. Talwar, and
F. Bonhomme. 1996. Origin and radiation of the house mouse: mitochondrial DNA phylogeny. J. Evol. Biol. 9:391–415.
Britton-Davidian, J., F. Fel-Clair, J. Lopez, P. Alibert, and P. Boursot. 2005. Postzygotic isolation between the two European subspecies of the house mouse: estimates from fertility patterns in wild and laboratory-bred hybrids. Biol. J. Linn. Soc. 84:379–393.
Chamero, P., T. Leinders-Zufall, and F. Zufall. 2012. From genes to social communication: molecular sensing by the vomeronasal organ. Trends Neurosci. 35:597–606.
Chapman, M. A., C. H. Pashley, J. Wenzler, J. Hvala, S. X. Tang, S. J. Knapp, and J. M. Burke. 2008. A Genomic Scan for Selection Reveals Candidates for Genes Involved in the Evolution of Cultivated Sunflower (Helianthus annuus). Plant Cell 20:2931– 2945.
Cheetham, S. A., M. D. Thom, F. Jury, W. E. R. Ollier, R. J. Beynon, and J. L. Hurst. 2007. The genetic basis of individual-recognition signals in the mouse. Curr. Biol. 17:1771– 1777.
Cucchi, T., J.-C. Auffray, and J.-D. Vigne. 2012. History of house mouse synanthropy and dispersal in the near east and europe: a zooarchaeological insight. Pp. 65–93 in M. Macholan, S. J. E. Baird, M. P, and J. Pialek, eds. Evolution of the house mouse. Cambridge University Press.
Dobzhansky, T. 1940. Speciation as a stage in evolutionary divergence. Am. Nat. 74:312– 321.
Dod, B., C. Smadja, R. C. Karn, and P. Boursot. 2005. Testing for selection on the androgen-binding protein in the Danish mouse hybrid zone. Biol. J. Linn. Soc. 84:447–459.
Duforet-Frebourg, N., E. Bazin, and M. G. B. Blum. 2014a. Genome scans for detecting footprints of local adaptation using a Bayesian factor model.
Duforet-Frebourg, N., E. Bazin, and M. G. B. Blum. 2014b. Genome scans for detecting footprints of local adaptation using a Bayesian factor model. Mol. Biol. Evol. msu182–.
Duvaux, L., K. Belkhir, M. Boulesteix, and P. Boursot. 2011. Isolation and gene flow: inferring the speciation history of European house mice. Mol. Ecol. 20:5248–5264.
Feder, J. L., S. P. Egan, and P. Nosil. 2012. The genomics of speciation-with-gene-flow. Trends Genet. 28:342–350.
Ganem, G., C. Litel, and T. Lenormand. 2008. Variation in mate preference across a house mouse hybrid zone. Heredity (Edinb). 100:594–601. The Genetics Society.
Gregorio, O., E. L. Berdan, G. M. Kozak, and R. C. Fuller. 2012. Reinforcement of male mate preferences in sympatric killifish species Lucania goodei and Lucania parva. Behav. Ecol. Sociobiol. 66:1429–1436.
Higgie, M., S. Chenoweth, and M. W. Blows. 2000. Natural selection and the reinforcement of mate recognition. Science (80-. ). 290:519–521.
Hopkins, R., D. A. Levin, and M. D. Rausher. 2012. Molecular signatures of selection on reproductive character displacement of flower color in Phlox drummondii. Evolution (N. Y). 66:469–485. Blackwell Publishing Inc.
Hopkins, R., and M. D. Rausher. 2011. Identification of two genes causing reinforcement in the Texas wildflower Phlox drummondii. Nature 469:411–+.
Hostert, E. E. 1997. Reinforcement : a new perspective on an old controversy. Evolution (N. Y). 51:697–702.
Howard, D. J. 1993. Reinforcement: origin, dynamics, and fate of an evolutionary hypothesis. Pp. 46–69 in R. G. Harrison, ed. Hybrid zones and the evolutionary process. Oxford University Press, New-York.
Hurst, J. L., C. E. Payne, C. M. Nevison, A. D. Marie, R. E. Humphries, D. H. L.
Robertson, A. Cavaggioni, and R. J. Beynon. 2001. Individual recognition in mice mediated by major urinary proteins. Nature 414:631–634.
Ibarra-Soria, X., M. Levitin, and D. Logan. 2013. The genomic basis of vomeronasal-mediated behaviour. Mamm. Genome 1–12. Springer US.
Ihle, S., I. Ravaoarimanana, M. Thomas, and D. Tautz. 2006. An analysis of signatures of selective sweeps in natural populations of the house mouse (vol 23, pg 790, 2006). Mol. Biol. Evol. 23:790–797.
Isogai, Y., S. Si, L. Pont-Lezica, T. Tan, V. Kapoor, V. N. Murthy, and C. Dulac. 2011. Molecular organization of vomeronasal chemoreception. Nature 478:241–245. Nature Publishing Group, a division of Macmillan Publishers Limited. All Rights Reserved. Jaenike, J., K. A. Dyer, C. Cornish, and M. S. Minhas. 2006. Asymmetrical reinforcement
and Wolbachia infection in Drosophila. Plos Biol. 4:1852–1862.
Kane, N. C., and L. H. Rieseberg. 2007. Selective sweeps reveal candidate genes for adaptation to drought and salt tolerance in common sunflower, Helianthus annuus. Genetics 175:1823–1834.
Kauer, M. O., D. Dieringer, and C. Schlotterer. 2003. A microsatellite variability screen for positive selection associated with the “Out of Africa” habitat expansion of Drosophila melanogaster. Genetics 165:1137–1148.
Kay, K. M., and D. W. Schemske. 2008. Natural selection reinforces speciation in a radiation of neotropical rainforest plants. Evolution (N. Y). 62 :2628–2642.
Kirkpatrick, M., and M. R. Servedio. 1999. The reinforcement of mating preferences on an island. Genetics 151:865–884.
Kronforst, M. R., L. G. Young, and L. E. Gilbert. 2007. Reinforcement of mate preference among hybridizing Heliconius butterflies. J. Evol. Biol. 20:278–285.
Lane, R. P., J. Young, T. Newman, and B. J. Trask. 2004. Species specificity in rodent pheromone receptor repertoires. Genome Res. 14:603–608.
Latour, Y., M. Perriat-Sanguinet, P. Caminade, P. Boursot, C. M. Smadja, and G. Ganem. 2014. Sexual selection against natural hybrids may contribute to reinforcement in a house mouse hybrid zone. Proc. R. Soc. B Biol. Sci. 281.
Laurie, C. C., D. A. Nickerson, A. D. Anderson, B. S. Weir, R. J. Livingston, M. D. Dean, K. L. Smith, E. E. Schadt, and M. W. Nachman. 2007. Linkage disequilibrium in wild mice. Plos Genet. 3:1487–1495.
Lemmon, A. R., and M. Kirkpatrick. 2006. Reinforcement and the genetics of hybrid incompatibilities. Genetics 173:1145–1155.
Lemmon, A. R., C. Smadja, and M. Kirkpatrick. 2004. Reproductive character displacement is not the only possible outcome of reinforcement. J. Evol. Biol. 17:177–183.
Lemmon, E. M., and A. R. Lemmon. 2010. Reinforcement in Chorus frogs: lifetime fitness estimates including intrinsic natural selection and sexual selection against hybrids. Evolution (N. Y). 64:1748–1761. Blackwell Publishing Inc.
Lenormand, T. 2012. From Local Adaptation to Speciation: Specialization and Reinforcement. Int. J. Ecol. 2012:11.
Li, M. H., T. Iso-Touru, H. Lauren, and J. Kantanen. 2010. A microsatellite-based analysis for the detection of selection on BTA1 and BTA20 in northern Eurasian cattle (Bos taurus) populations. Genet. Sel. Evol. 42:14.
Logan, D. W., T. F. Marton, and L. Stowers. 2008. Species Specificity in Major Urinary Proteins by Parallel Evolution. PLoS One 3:e3280. Public Library of Science. Macholán, M., S. J. E. Baird, P. Dufková, P. Munclinger, B. V. Bímová, and J. Piálek.
2011. Assessing multilocus introgression patterns: a case study on the mouse X chromosome in central Europe. Evolution (N. Y). 65:1428–1446. Blackwell Publishing Inc.
Macholán, M., S. J. E. Baird, P. Munclinger, P. Dufkova, B. Bimova, and J. Pialek. 2008. Genetic conflict outweighs heterogametic incompatibility in the mouse hybrid zone? Bmc Evol. Biol. 8:14.
Macholán, M., P. Munclinger, M. Sugerkova, P. Dufkova, B. Bimova, E. Bozikova, J. Zima, and J. Pialek. 2007. Genetic analysis of autosomal and X-linked markers across a mouse hybrid zone. Evolution (N. Y). 61:746–771.
Matute, D. R. 2010. Reinforcement Can Overcome Gene Flow during Speciation in Drosophila. Curr. Biol. 20:2229–2233.
Maynard Smith, J., and J. Haigh. 1974. The hitchhiking effect of a favourable gene. Genet. Res. 23:23–35.
Mudge, J. M., S. D. Armstrong, K. McLaren, R. J. Beynon, J. L. Hurst, C. Nicholson, D. H. Robertson, L. G. Wilming, and J. L. Harrow. 2008. Dynamic instability of the major urinary protein gene family revealed by genomic and phenotypic comparisons between C57 and 129 strain mice. Genome Biol. 9:16.
Nadeau, N. J., and C. D. Jiggins. 2010. A golden age for evolutionary genetics? Genomic studies of adaptation in natural populations. Trends Genet. 26:484–492.
Noor, M. A. F. 1999. Reinforcement and other consequences of sympatry. Heredity (Edinb). 83:503–508.
Noor, M. A. F. 1995. Speciation driven by natural selection in Drosophila. Nature 375:674– 675.
Nosil, P., B. J. Crespi, and C. P. Sandoval. 2003. Reproductive isolation driven by the combined effects of ecological adaptation and reinforcement. Proc. R. Soc. London Ser. B-Biological Sci. 270:1911–1918.
Ortiz-Barrientos, D., B. A. Counterman, and M. A. F. Noor. 2004. The genetics of speciation by reinforcement. Plos Biol. 2:e416.
Ortiz-Barrientos, D., A. Grealy, and P. Nosil. 2009. The Genetics and Ecology of Reinforcement Implications for the Evolution of Prezygotic Isolation in Sympatry and Beyond. Pp. 156–182 in T. A. Mousseau and C. D. Schlichting, eds. Year in Evolutionary Biology 2009. Blackwell Publishing, Oxford.
Pfennig, K. S. 2003. A test of alternative hypotheses for the evolution of reproductive isolation between spadefoot toads: Support for the reinforcement hypothesis. Evolution (N. Y). 57:2842–2851.
Prager, E. M., R. D. Sage, U. Gyllensten, W. K. Thomas, R. Hübner, K. S. Jones, L. Noble, J. B. Searle, and A. C. Wilson. 1993. Mitochondrial DNA sequence diversity and the colonization of Scandinavia by house mice from East Holstein. Biol. J.Linn.Soc. 50:85–122.
Pritchard, J. K., J. K. Pickrell, and G. Coop. 2010. The Genetics of Human Adaptation: Hard Sweeps, Soft Sweeps, and Polygenic Adaptation. Curr. Biol. 20:R208–R215. Przeworski, M., G. Coop, and J. D. Wall. 2005. The signature of positive selection on
standing genetic variation. Evolution (N. Y). 59:2312–2323.
R development core team. 2012. R: A Language and Environment for Statistical Computing.
Raufaste, N., A. Orth, K. Belkhir, D. Senet, C. Smadja, S. J. E. Baird, F. Bonhomme, B. Dod, and P. Boursot. 2005. Inference of selection and migration in the danish house mouse hybrid zone. Biol. J. Linn. Soc. 84:593–616.
Rundle, H. D., and D. Schluter. 1998. Reinforcement of stickleback mate preferences: sympatry breeds contempt. Evolution (N. Y). 52:200–208.
Saether, S. A., G. P. Saetre, T. Borge, C. Wiley, N. Svedin, G. Andersson, T. Veen, J. Haavie, M. R. Servedio, S. Bures, M. Kral, M. B. Hjernquist, L. Gustafsson, J. Traff, and A. Qvarnstrom. 2007. Sex chromosome-linked species recognition and evolution of reproductive isolation in flycatchers. Science (80-. ). 318:95–97.
Saetre, G.-P., T. Moum, S. Bures, M. Kral, M. Adamjan, and J. Moreno. 1997. A sexually selected character displacement in flycatchers reinforces premating isolation. Nature 387:589–592.
Schlötterer, C. 2002. A microsatellite-based multilocus screen for the identification of local selective sweeps. Genetics 160:753–763.
Schlötterer, C. 2003. Hitchhiking mapping - functional genomics from the population genetics perspective. Trends Genet. 19:32–38.
Schlötterer, C., and D. Dieringer. 2005. A novel test statistic for the identification of local selective sweeps based on microsatellite gene diversity. Pp. pp. 55–64 in D.
Nurminsky, ed. Selective Sweep. Landes Bioscience, Georgetown, TX.
Schnack, H. G., S. C. Bakker, R. van ’t Slot, B. M. Groot, R. J. Sinke, R. S. Kahn, and P. L. Pearson. 2004. Accurate determination of microsatellite allele frequencies in pooled DNA samples. Eur. J. Hum. Genet. 12:925–34.
Schöfl, G., and C. Schlötterer. 2004. Patterns of Microsatellite Variability Among X Chromosomes and Autosomes Indicate a High Frequency of Beneficial Mutations in Non-African D. simulans. Mol. Biol. Evol. 21:1384–1390.
Servedio, M. R. 2000. Reinforcement and the genetics of nonrandom mating. Evolution (N. Y). 54:21–29.
Servedio, M. R. 2004. The evolution of premating isolation: Local adaptation and natural and sexual selection against hybrids. Evolution (N. Y). 58:913–924.
Servedio, M. R., and M. Kirkpatrick. 1997. The effects of gene flow on reinforcement. Evolution (N. Y). 51:1764–1772.
Servedio, M. R., and M. A. F. Noor. 2003. The role of reinforcement in speciation: Theory and Data. Annu. Rev. Ecol. Syst. 34:339–364.
Servedio, M. R., S. A. Saether, and G. P. Saetre. 2009. Reinforcement and learning. Evol. Ecol. 23:109–123.
Shaw, S. H., M. M. Carrasquillo, C. Kashuk, E. G. Puffenberger, and A. Chakravarti. 1998. Allele Frequency Distributions in Pooled DNA Samples: Applications to Mapping Complex Disease‚ÄâGenes. Genome Res. 8:111–123.
Skalski, G. T., C. R. Couch, A. F. Garber, B. S. Weir, and C. V Sullivan. 2006. Evaluation of DNA pooling for the estimation of microsatellite allele frequencies: a case study using striped bass (Morone saxatilis). Genetics 173:863–75.
Smadja, C., J. Catalan, and G. Ganem. 2004. Strong premating divergence in a unimodal hybrid zone between two subspecies of the house mouse. J. Evol. Biol. 17:165–176. Smadja, C., and G. Ganem. 2005. Asymmetrical reproductive character displacement in the
house mouse. J. Evol. Biol. 18:1485–1493.
Smadja, C., and G. Ganem. 2008. Divergence of odorant signals within and between the two European subspecies of the house mouse. Behav. Ecol. 19:223–230.
Smadja, C., and G. Ganem. 2002. Subspecies recognition in the house mouse: a study of two populations from the border of a hybrid zone. Behav. Ecol. 13:312–320.
Smadja, C. M., and R. K. Butlin. 2011. A framework for comparing processes of speciation in the presence of gene flow. Mol. Ecol. 20:5123–5140.
Staubach, F., A. Lorenc, P. W. Messer, K. Tang, D. A. Petrov, and D. Tautz. 2012.
Genome Patterns of Selection and Introgression of Haplotypes in Natural Populations of the House Mouse (<italic>Mus musculus</italic>). PLoS Genet 8:e1002891. Public Library of Science.
Stewart, R., and R. P. Lane. 2007. VIR promoters are well conserved and exhibit common putative regulatory motifs. BMC Genomics 8:16.
Stopková, R., P. Stopka, K. Janotová, and P. L. Jedelský. 2007. Species-specific expression of major urinary proteins in the house mice (Mus musculus musculus and Mus
musculus domesticus). J. Chem. Ecol. 33:861–869.
Teeter, K. C., B. A. Payseur, L. W. Harris, M. A. Bakewell, L. M. Thibodeau, J. E.
O’Brien, J. G. Krenz, M. A. Sans-Fuentes, M. W. Nachman, and P. K. Tucker. 2008. Genome-wide patterns of gene flow across a house mouse hybrid zone. Genome Res. 18:67–76.