HAL Id: halshs-01651080
https://halshs.archives-ouvertes.fr/halshs-01651080
Preprint submitted on 28 Nov 2017
HAL is a multi-disciplinary open access
archive for the deposit and dissemination of
sci-entific research documents, whether they are
pub-lished or not. The documents may come from
teaching and research institutions in France or
L’archive ouverte pluridisciplinaire HAL, est
destinée au dépôt et à la diffusion de documents
scientifiques de niveau recherche, publiés ou non,
émanant des établissements d’enseignement et de
recherche français ou étrangers, des laboratoires
Replication in experimental economics: A historical and
quantitative approach focused on public good game
experiments
Nicolas Vallois, Dorian Jullien
To cite this version:
Nicolas Vallois, Dorian Jullien. Replication in experimental economics: A historical and quantitative
approach focused on public good game experiments. 2017. �halshs-01651080�
Replication in experimental economics: A historical and
quantitative approach focused on public good game
experiments
Nicolas Vallois
∗& Dorian Jullien
†GREDEG Working Paper No. 2017–21
02/08/17, third version; comments are more than welcome
Abstract.
We propose a historical perspective on replication in experimental economics focused on public good games. Our intended contribution is twofold: in terms of method and in terms of object. Methodologically, we blend traditional qualitative history of economics with a less traditional quantitative approach using basic econometric tools to detect unnoticed historical patterns of replication. In terms of our object, we highlight a type of replication that we call “baseline replication”, which is not present in explicit methodological discussions, yet central in the specificity of experimental economics regarding replication in economics.
Keywords: Experimental Economics, Replication, History of Economic Thought, Methodology, Public Good Experiments.
JEL Codes: B20, C83, A14, C90
∗CRIISEA, Universit´e Picardie Jules Verne
Corresponding author. Email adress: nicolas.vallois@u-picardie.fr
Introduction
Replication in science can be broadly defined as the reproduction of empirical results using the same methods and protocols. According to many authors, replication is the hallmark of science because it makes research findings more reliable (see the references in Schmidt, 2009). Since the 1980’s, seminal publications have pointed out replication difficulties in applied economics and econometrics (Kane 1984; Dewald et al. 1986; Mirowski and Sklivas 1991; see also Ashenfelter et al., 1986 for the methodological challenges that replication poses to journal editors). As Hamermesh puts it “economists treat replication the way teenagers treat chastity - as an ideal to be professed but not to be practised” (Hamermesh, 2007, p.715). On the other hand, the experimental method is often praised for the ease of replicability that comes with it compared to other forms of empirical observations. This belief tends to be held by both non-experimentalists (e.g., ibid, p.5) and experimentalists, e.g., when Plott says bluntly that “the heart of the ex-perimental method is replication” (Plott, 1982, p.1490). The goal of this paper is to provide a historical perspective on the practice of replication in experimental economics.
This perspective can help better understand the place of economics within the current “repli-cation crisis” that is impacting several disciplines using controlled experiments (see the references cited by Camerer et al., 2016, p.1433). The crisis has triggered a renewed interest in replication within economics at large, including experimental economics (e.g., Rosenblat et al. 2015)1. The overall picture is messy. Outside of experimental economics, some argue that most of empiri-cal economics is not reproducible (e.g Chang et al., 2017), while some others suggest that the academic market provides sufficient and strong incentives to replicate (Hamermesh, 2016).
Experimental economists seem to be more optimistic: 61,11% (11 out of 18) of experimental results were successfully replicated in a large collaborative project recently published in the prestigious journal Science (Camerer et al., 2016). The authors suggest that EE’s results are relatively more reproducible and robust than in psychology, where a similar study found a repli-cation rate of 38% (Collaboration et al., 2015). This “relatively good replirepli-cation success” would be the result of “editorial practices [that] created norms of transparency and made replication
1Outside of experimental economics, see Koenker and Zeileis 2009; Glandon 2010; Coffman and Niederle 2015;
Clemens 2015; Rosenblat et al. 2015; Hamermesh 2016; Camerer et al. 2016; Mueller-Langer et al. 2017; Chang et al. 2017. Furthermore, a collaborative wiki appeared in 2015 to promote replication studies in economics (replication.uni-goettingen.de/wiki) and the 2017 annual meeting of the AEA in Chicago included a session on replication.
and reanalysis relatively easy” in EE (Camerer et al., 2016, p.1435).
This optimism is questionable. The result of Camerer et al. is indeed hard to interpret: 61,11% is better than 38%, but it still means than more than a third (7 out of 18 studies, i.e. 38,88%) of lab experiments are not reproducible. More importantly, it can be argued that the replicated experiments are not representative of EE on at least three grounds. Firstly, only 18 articles were included in the study whereas the similar collective project in psychology replicated a hundred experiments. Secondly, another problem is that replicated experiments in economics were published in the American Economic Review and the Quarterly Journal of Economics between 2011 and 2014, and most papers in EE are not published in AER or QJE. . Although focusing on highest impact journals make sense from their perspective (i.e., checking the replicability of the ‘best’ papers), it is too restrictive from our perspective in terms of disciplinary scope. both in ter Last but not least, the three-year time period (2011-2014) is too short to investigate long-term replication patterns. Low (respectively relatively high) replication rates could imply that things are really bad (resp. not too bad). An alternative explanation is that these problems always existed and were probably much worse in the past; we may not have to be excessively pessimistic because replication failures are due mainly to a greater awareness of replication issues.
A historical approach is therefore needed in order to evaluate the state of replication in EE over a longer period. More precisely, our goal is to provide a quantitative approach to highlight the historical dynamics of replication in experimental economics. Our intended contribution is twofold: in terms of approach and in terms of object. Our historical approach is to use basic econometric tools to find unnoticed historical patterns of interests for both historians of eco-nomics and economists. This is meant to facilitate dialog between each academic community by using the same standard of evidence (as promoted by Backhouse et al., 1997) and by indicat-ing long-term tendencies in a given economic research domain (e.g., as with meta-studies but with time as the main variable of interest). Our historical object, replication in experimental economics, is in need of two refinements to be empirically meaningful. On the one hand, we restrict our observations to a specific type of economic experiments: public good (PG) game experiments. A typical PG game consists in a group of subjects, each of which has money (experimental tokens) that can be used either to contribute to a PG (yielding returns to all
the subjects in the group) or to invest in a private good (yielding returns only to the investor). Contributing to the PG can yield better return than investing in a private good only if at least some others are investing in the PG. Using different types of experiments would have made the results less precise or too long for a single paper. We chose PG game because the field is relatively well homogeneous, it notably contains mostly contributions from economic journals (contrary to ultimatum game experiments for instance2. Furthermore, historians and method-ologists of EE consider that PG game played a central role in the long-term development of the discipline (Guala, 2005; Svorenˇc´ık, 2015). On the other hand, we have to make explicit a type of replication in experimental economics, which we will call “baseline replication”, that seems to be part of experimental economists’ tacit knowledge and common practice, yet absent from explicit methodological discussion of replication.
The paper is structured as follows. Section 1 exposes the specificity of our historical object, i.e., baseline replication in PG game experiments. Section 2 discusses the methodological speci-ficity of our historical approach and describes how we collected our data. Section 3 presents and interprets the main empirical findings. Section 4 discusses more broadly the meaning of our results and the specificity of our method. Section 5 summarizes and suggests further work.
1
Baseline replication in EE
“Replication” has different meanings in explicit methodological discussions, and a given meaning can have different names from author to author. A basic distinction is between what we call here “pure replication” and “robustness test”3. A pure replication tries to find the same results of a given study by using the same data and the same method. There can be pure econometric replication: “taking the actual data generated by an experiment and reanalyzing the data to confirm the original findings”(Levitt and List, 2009, p.14); or pure experimental replication: “to
2We suspected that different disciplines (psychology, political science, anthropology, and so forth) might have
different replication practices and might not reflect the culture and method of experimental economists.
3Respectively named“econometric auditing” and “improvisational replication” (Kane, 1984), “replication” and
“reproduction” (Mirowski and Sklivas, 1991), “pure replication” and “scientific replication (Hamermesh, 2016). Clemens describes a pure replication as an estimation of parameters “drawn from the same sampling distributions as those in the original study”, while a robustness test “ estimates parameters drawn from a different sampling distribution from those in the original study”(Clemens, 2015, p.327).
run an experiment which follows a similar protocol to the first experiment to determine whether similar results can be generated” (ibid). By contrast, a robustness test tries to find whether a given result holds in a new context (e.g., with different types of subjects, in a new geographical place, at different times, when other variables are present, etc.). Robustness test can be done in (non-experimental) econometrics as well as in experimental economics.
We suggest here the existence of a third type of replication, which is specific to experimental methods. Experimental economists usually report their results as a significant difference between (at least) two sets of observations: one from a so-called “baseline” condition (or “control group”) and another from a treatment condition (usually similar to the baseline except for one detail). For a given type of experiments in economics, e.g., PG game experiments, most experiments will have a baseline condition that is similar or very close to another baseline condition, so that, overall, it makes sense to check whether the observation in a given baseline condition is close to the average observation across all baseline conditions. We will call “baseline replication” the fact that results in baseline conditions of similar experiments are converging toward the same level.4
While absent from explicit methodological discussions (e.g., in the references from the pre-vious paragraph), baseline replications are pervasive in casual methodological discussions of experimental economists. Smith is indeed talking about baseline replication when he wrote: “if I do an experiment similar to yours as a baseline control for comparison with a related experiment I intend to perform, I am testing the robustness of your original results using my instructions, subjects and a different experimenter” (Smith, 1994, p.128). In a collective book on replication in EE, Deck et al. (2015) recognize that pure replication is very rare in EE but argue that experimental results are reproducible mostly through replication across papers (i.e., “baseline replication”). Baseline replication can be seen as in-between pure replication and robustness test and is specific to the use of lab experiments in economics (and in other social sciences, including psychology). It is not explicit replication in the sense that it is a mere by-product of finding a possibly new effect in a given domain. This specificity partly justifies taking
4It can be argued that baseline replication is a specific case of robustness test where it is not the robustness
of an effect (in the sense of a difference between conditions) that is tested but the robustness of an observation (in the sense of whether a given variable will have the same value) across laboratories. This explains Smith’s use of “robustness” in the next paragraph. For the sake of clarity and concision, we distinguish baseline replication and robustness test throughout the paper.
baseline replication as our historical object.
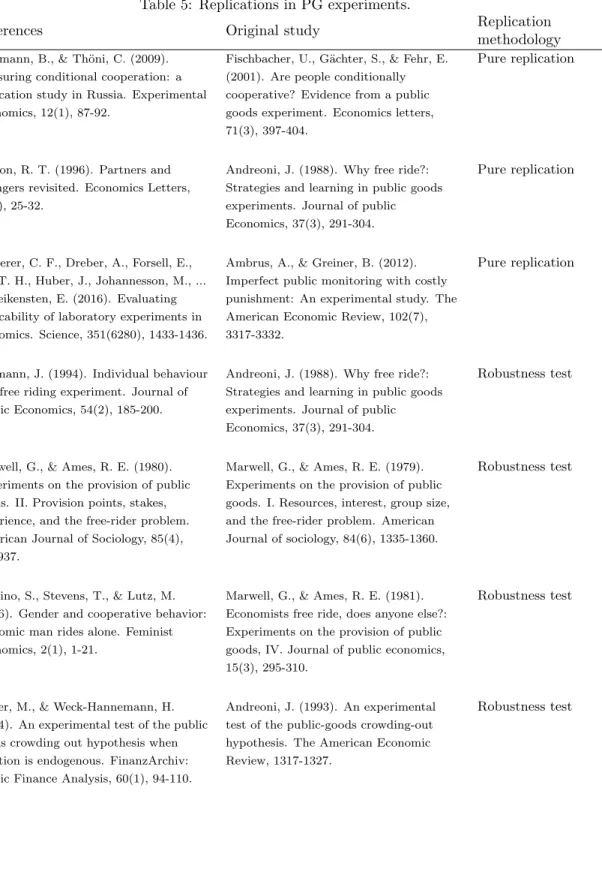
The other part of the justification for introducing a new notion of replication is that pure replications are even less frequent in EE than in other branches of applied economics. In other branches of applied economics, bibliometric studies such as Mueller-Langer et al. (2017) show that, among 1,243 published papers from the top-50 economic journals from 1974 to 2014, less than 0.1% were replications. Also, Hamermesh (2016) analyzes every publication that have cited the 10 most heavily-cited publications in applied labor economics. Only 0,6% of these citing articles are pure replication and 1,5% are robustness test. Yet out of the 10 most cited articles, 7 were replicated at least 5 times and the remaining 3 replicated 1, 2 and 4 times. Hamermesh therefore argues that replicability in labor economics is satisfying, at least for most-cited studies. A closely related result is found by Sukhtankar et al. (2017) who establishes that in development economics, the stronger predictor of whether a paper is replicated or not is its Google Scholar citation count. What is the state of pure replications in EE compared to these results? Using a method similar to Hamermesh’s (i.e., using Google Scholar citations instead of Web Of Science citations), we selected the 10 most heavily-cited publications in PG experiments (Table 4 in the Appendix)5. Only four of these ten publications were replicated (and only one was replicated two times). In total, we found three pure replications and four robustness tests (Table 5 in the appendix). Provided that there are thousands of publications in the field, our result shows that replication (in a large sense, including both pure replication and robustness tests) is even rarer in EE than what was found in economics by previous bibliometric studies (Mueller-Langer et al., 2017; Hamermesh, 2016). This result might seem surprising because incentives for replications are usually considered to be stronger in EE (Mueller-Langer et al., 2017)6. More importantly, as an experimental discipline EE does not face the problems associated with data sharing in econometrics (see Dewald et al. 1986; Ashenfelter et al. 1986; Bernanke 2004; Duvendack et al. 2015). Hamermesh for instance takes for granted that pure replication are easier to perform in EE than in labor economics: “replication in the case of labor economics (and presumably
5Given that citations on Web Of Science are usually less numerous than on Google Scholar we would have
found even less replications if we used Hamermesh’s method.
6In particular, the journal Experimental Economics is the only top economics journal with an explicit
repli-cation policy: “Lastly, the journal publishes articles with a primary focus on methodology or replirepli-cation of controversial findings” (EE’s website). Deck et al. (2015) also point out that the recently launched Journal of the Economic Science Association strives to promote replications. In fact, one of the reasons of the establishment of this journal was that the practice of publishing replications in Experimental Economics was not well developed (Nikiforakis and Slonim, 2015).
of other areas of applied microeconomics) does not take the form of repetition of a particular protocol on laboratory rats (or their equivalent in economic research, undergraduate students)” Hamermesh (2016, p.5).
However, the lack of pure replications in our bibliometric data is not surprising for anyone familiar with experimental science. Even in biological experiments with mice, replications are never “pure”, since generations of inbreeding have resulted in significant differences between individuals7. Subjects in EE are usually undergraduate students and disparities between human individuals are obviously even more problematic in public good games. As Clemens argues, most replications in lab economic experiments are not pure replications because most original results are understood as being valid in University X (hence, a similar experiment conducted in University Y is a robustness test; Clemens, 2015, p.330)8. But there is a deeper reason for the lack of replications (not only pure but also robustness test) in our data: replications in EE are often implicit, in the sense that the explicit purpose of a study where there is a replication is not to replicate. For instance, Chaudhuri et al. replicate in the initial part of their experiment the result of Fischbacher and G¨achter (2010) that the majority of subjects are “conditional cooperators” and then study the effect of information about conditional cooperators on contribution to the PG (Chaudhuri et al., 2006). In their article, replication is merely a by-product of the main finding, and the paper cannot be classified as replication per se. But of course Chaudhuri et al. really show that Fischb¨acher et al.’s result is reproducible and they really have to design a similar experimental condition to compare their results. This part of the experimental method plays an important role in baseline replication. In short, Plott’s (1982, p.1490) statement that “the heart of the experimental method is replication” makes much more sense in terms of baseline replication than in terms of pure replication or robustness test.
7Paradoxically, Richter argue that “environmental standardization is a cause of, rather than a cure for, poor
reproducibility of experimental outcomes” (Richter et al., 2009, p.257)
8Other sources for the lack of pure replications in EE are the same as in (non-experimental) econometrics:
computer code is essential to run a replication and do-files are difficult to obtain (McCullough et al., 2006); a related problem is that econometric software might be unknown to the researcher planning a replication (Koenker and Zeileis, 2009); some programs might not be available (Mirowski and Sklivas, 1991); understanding differences between the original study and its replication might not be straightforward (Mirowski and Sklivas, 1991); no sufficient incentives for economists to work on replications since very few journal publish replication studies.
2
Method
Our paper aims at evaluating the effectiveness of baseline replication in EE through the case of public good games. Assessing baseline replication implies that control results in control conditions can be compared across studies. An additional reason for choosing PG experiments in this regard is that experimental results in this subfield usually provide a clear common variable of interest, the rate of individual contributions to the public good, which allows for easy inter-studies comparison9. Also, the academic literature in EE is huge and our bibliometric analysis could not be exhaustive. We had to rely on sampling methods, and another advantage of public good games is that there already exists meta-studies and surveys that we took as representative of the whole literature on the topic (Ledyard, 1995; Zelmer, 2003; Chaudhuri, 2011).
Our data set consists of 66 published papers on PG game experiments. We collected single studies from the references cited in Ledyard (1995) for the pre-1995 period and from Chaudhuri (2011) for the 1995-2010 period. We obtained a total of 55 studies from 1979 to 2009, i.e. on average 55/30=1,8 study per year. For the later time period (2009-2015), no survey was available, so we randomly sampled 11 studies using a method similar to Zelmer (2003): we conducted a research in EconLit with the keywords “public goods” and “experiment*” (with the asterisk being a wildcard that can be associated with experiment, experimental, experimentally, and so forth). This research for the 2009-2015 time period yielded 306 results. To keep the same average of 1,8 article per year, we had to sample 1, 8 × 6 years, which is approximately 11 studies. We displayed 30 articles per page. To avoid alphabetical bias (cf. Ray and Robson, 2016), we displayed results by alphabetical order and select the middle-range article (on the 15th position). If the study did not meet our inclusion criteria, we took the next articles in alternative ascending/descending order (the 16th, then the 14th, then the 17th, and so forth).
The next (and longer) step was to collect data on “baseline” result for each study. The task was easy in some cases where the authors explicitly mentioned that one of their conditions was “control” or “baseline”. But some other studies only contrast various conditions without
char-9In some other areas of EE (e.g., asset experimental markets, auctions experiments), experimental results are
much harder to compare because there is common variables of interest are less clear than the rate of individual contribution in public goods games. The discount rate in experiments on intertemporal choices provide this common variable, but a meta-study showed that experimental designs in this subfield are too different to allow for inter-studies comparison (Percoco and Nijkamp, 2009). An alternative candidate was the mean relative choice in the ultimatum game, but this subfield is much more interdisciplinary and was suspected to be not sufficiently representative of EE, as argued previously (cf. section 1).
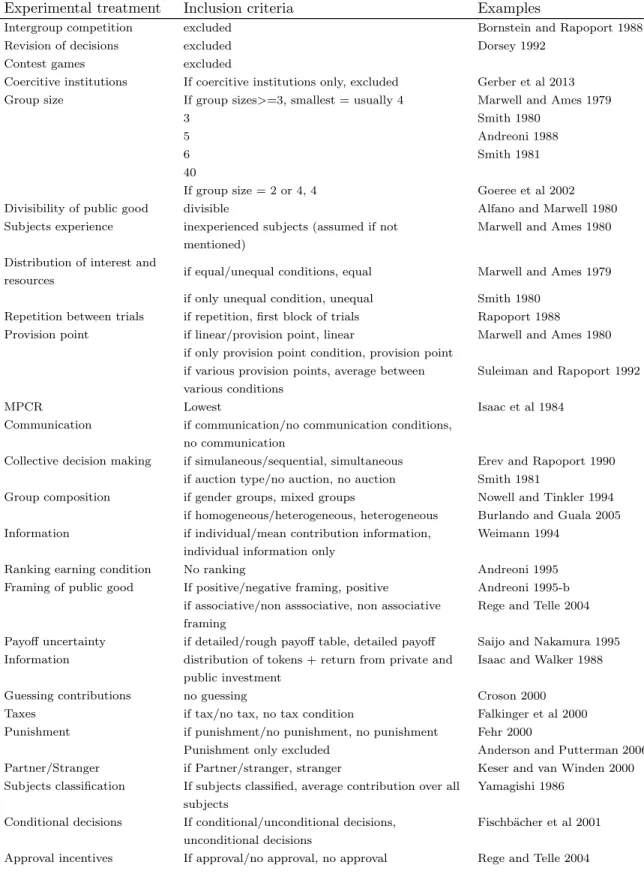
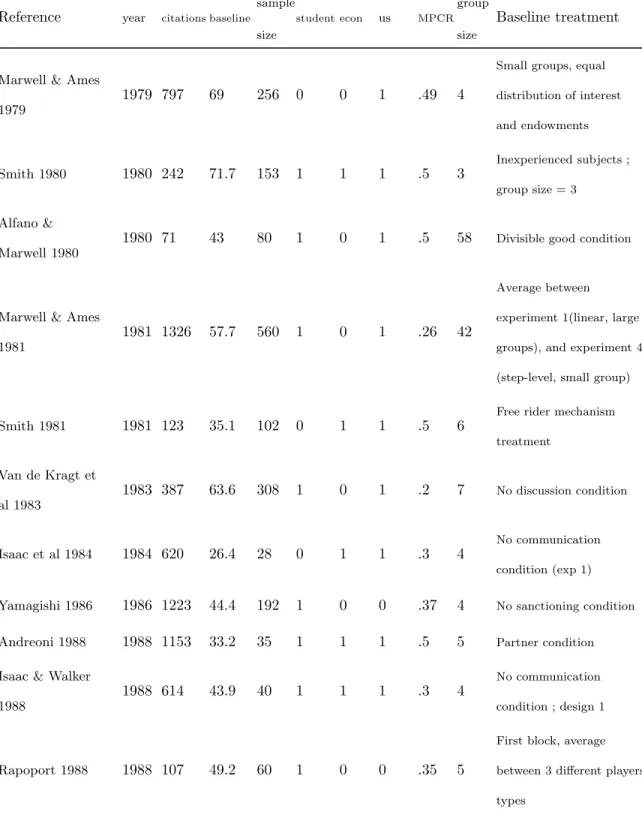
acterizing one in particular as control (for instance, Marwell and Ames, 1981). Using previous experiments in which a baseline condition was explicitly identified, we progressively manage to define several features of what could count as a baseline condition (see Table 6 in the appendix). For instance, since Andreoni (1988) takes the “stranger condition” as control, we decided that if a subsequent study included a stranger treatment versus a partner treatment, we should give priority to the first one to be considered as the control condition. We also collected data on methodological variables that might explain disparities across baseline results: citations, sample size, type of subjects (economic or non-economic students), geographical location of the lab, the marginal per capita return (MPCR) and the group size in the baseline condition.
The only criterion of restriction that we imposed on single studies is that they have to provide our “baseline” variable: average group contribution rate to the PG. It requires only that in the experimental design, subjects are given an initial endowment and have to choose between a contribution to a private good or a PG. This criterion led mainly to the exclusion of experiments on social dilemmas that do not give initial endowments to subjects (e.g., Schneider and Pommerehne, 1981). Unlike Zelmer (2003), we had no restriction criteria on the linearity of the PG (provision point accepted) or on the MPCR. As detailed in table 6 in the appendix, we chose however to exclude several studies that brought structural changes to what can be considered as a classic PG game, in particular: intergroup competition, revision of decision, contest game, or coercive institutions. Of course, if these conditions were compared to a baseline condition without intergroup competition, revision, and so forth, we included the study in our database. Like Zelmer (2003), we only include studies that report accurate group results; one of the main reason for exclusion in this regard is when data on contribution rates are only presented graphically.
Meta-studies such as Zelmer’s collect experimental results on what is usually considered as a dependent variable in PG games (average level of contribution to the PG) and then run a “meta” regression of this variable on the different independent variables considered in particular studies (e.g., MPCR, communication, group composition, use of children as subjects and so forth). The purpose is to identify which of these independent variables have a significant effect on contribution to the PG over all studies. A crucial feature of meta-studies is that they need to include studies that are as homogeneous as possible; ideally, experiments should vary only
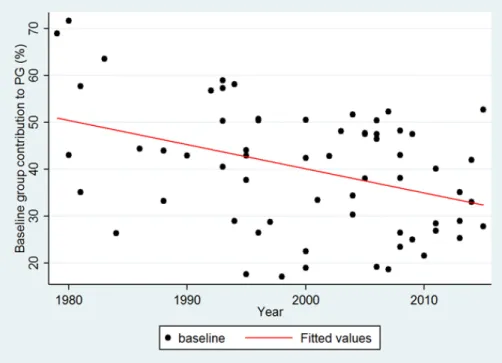
regarding independent variables (corresponding to various treatments) and maintain the same control conditions. In other words, meta-studies take for granted that baseline controls are indeed replicated across studies. On the contrary, we were interested in the way experimenters measure contribution in baseline conditions, and if these measurements do converge over time. Instead of restricting our analysis to a particularly coherent (and recent) subset of the literature, we were looking for tendency toward coherence in a representative (and not necessarily coherent from the beginning) subset. In other words, the variations we observe between each baseline are deliberately not controlled for usual treatment variables such as group size, communication and so on. Figure 1 is a graphical representation of our database. It plots the average baseline result for each study included in our database from 1979 to 2015.
Figure 1: Baseline group contribution to PG, 1979-2009
To illustrate how to interpret this figure, take the first point to the left below the trend. This point means: “in 1980, a PG game experiment was published with a baseline condition in which the contribution to the PG was on average about 40% of the initial endowment”. Perfect baseline replications across PG game experiments, i.e., always the same average group contributions in baseline conditions, would be represented by all the points being very close
to one another (low deviation) and forming a horizontal line (displaying stability over time of average contribution in baseline conditions). This is obviously not what we observe. However, there are two blurred historical tendencies. On the one hand, it seems that the points are getting closer to each other, i.e., baseline contributions seem to converge over time. On the other hand, the trend line decreases, i.e., baseline contributions seem to decrease over time. The goal of our historical approach is to go beyond this descriptive use of our data and use econometrics to check the significance of these two tendencies. To do so, we propose two sets of econometric models.
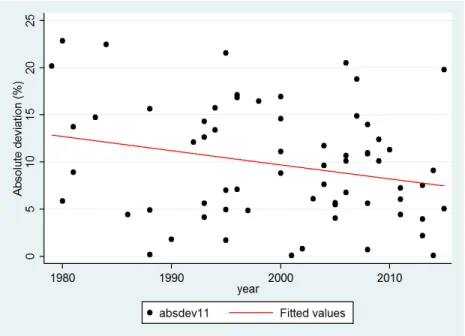
The first set of models is about the tendency of baseline contributions to converge over time. To do so, we ranked the 66 experiments in chronological order and then we split our database into 6 subgroups of 11 experiments. Each subgroup corresponds to a time period: 1979-1989, 1990-1995, 1995-2001, 2002-2006, 2006-2009, 2010-2015. For each time period, we computed the average of baseline results. Then we obtained for each study its absolute deviation from this subperiod average. This variable that we call absdev11 measures how much a particular study is deviating from the subperiod average contribution observed in other studies. It is therefore an indicator of between-studies convergence. Figure 2 provides a graphical illustration of this variable.
To illustrate how to interpret this figure, take the first point to the left below the trend. This point means: “in 1980, a PG experiment was published with a baseline condition in which the average contribution to the PG deviated by 5% from the average group contributions to all the PG experiments published between 1979 and 1990”. Each point just indicates absolute deviation, i.e., we do not (want to) know if the baseline result is below or above the per-period mean. Hence absdev11 says nothing about increase or decrease of baseline contributions over time, it is only about baseline convergence over time. To examine the convergence of baseline replications over time, we estimate the following specification:
absdev11 = α. + β.year (1)
where α is a constant term and year is the year of publication for each study that makes our quantitative approach historical. We also estimate the longer specification:
absdev11 = α + β.year + γ.citations + δ.samplesize + ε.student + θ.econ + λ.us (2)
where citations is the number of Google Scholar citations; samplesize is the number of subjects who participated in the experiment; student and econ are dummies that take value 1 if subjects were respectively students, students in economics. The last regressor us is also a dummy that takes value 1 if the experiment was run in the US. The second set of models is about the tendency of baseline contributions to decrease over time. To examine this (unsuspected) tendency, we estimate the following specification:
baseline = α. + β.year (3)
where baseline is the baseline contribution rate in each study; α is a constant term. We also estimate the longer specification:
For both sets of models, we use ordinary least square (OLS) to estimate their specifications. Most bibliometric meta-studies in EE (e.g. Croson and Marks 2000; Prante et al. 2007; Zelmer 2003; Johnson and Mislin 2011) and also in economics (e.g., Blackwell et al., 2002) and other domains (e.g., DerSimonian and Laird, 1986 for clinical trials in biology) do not apply simple OLS regression because they have to take into account heterogeneity between studies. The problem in meta-studies is that each publication contains several treatments, and each treatment is counted as a single independent observation. Of course, there is a large correlation between the treatments of the same experiment. For instance, Engel finds in dictator game experiments that between-studies variance explains 97% of total variance (Engel, 2011). This difficulty is tackled by using weighted least square in which the regression is weighted by the precision of each experiment (usually the inverse number of independent observations). We do not face this problem here because we have only one observation (i.e. baseline condition) per experiment and we are not interested in non-control treatments. Yet we suspected that our data could be clustered around subgroups of labs and researchers that might use similar methods. We therefore tested for heteroskedasticity for each of our regression using both Breusch-Pagan test and White test. We never found any significant level of heteroskedasticity. We also estimated the same regressions with heteroskedastic-robust standard errors and that did not change significantly our results.
3
Results and interpretation
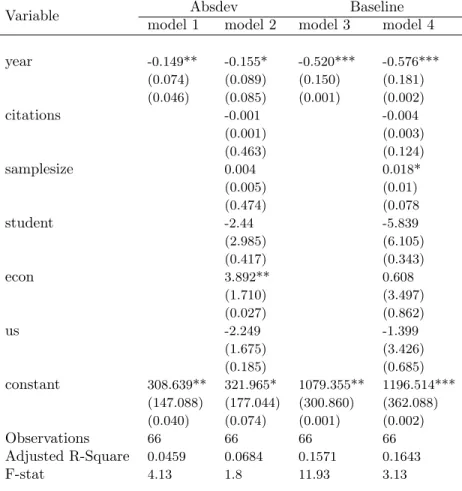
Table 1 shows regression results for the two sets of models. We discuss these results for each set in separate subsections.
Variable Absdev Baseline
model 1 model 2 model 3 model 4
year -0.149** -0.155* -0.520*** -0.576*** (0.074) (0.089) (0.150) (0.181) (0.046) (0.085) (0.001) (0.002) citations -0.001 -0.004 (0.001) (0.003) (0.463) (0.124) samplesize 0.004 0.018* (0.005) (0.01) (0.474) (0.078 student -2.44 -5.839 (2.985) (6.105) (0.417) (0.343) econ 3.892** 0.608 (1.710) (3.497) (0.027) (0.862) us -2.249 -1.399 (1.675) (3.426) (0.185) (0.685) constant 308.639** 321.965* 1079.355** 1196.514*** (147.088) (177.044) (300.860) (362.088) (0.040) (0.074) (0.001) (0.002) Observations 66 66 66 66 Adjusted R-Square 0.0459 0.0684 0.1571 0.1643 F-stat 4.13 1.8 11.93 3.13
Note: standard errors in parentheses, p-values below * coefficient is significant at the 10% level
** coefficient is significant at the 5% level *** coefficient is significant at the 1% level
Table 1: Regression results
3.1
Are baseline contributions converging over time? (models 1-2)
For model 1, there is a significant effect (p < 0, 05) of year on baseline. There is only mild evidence for the same effect in model 2 but the size effect is large; the coefficient parameter of approximately 0,15 means that experimental results have converged by 5,25% toward per-period average baseline contribution baseline over 35 years (0, 15 × 35years = 5, 25). Yet there is no strong evidence for convergence over time (p > 0, 01 in model 1; p > 0, 05 in model 2) and
Figure 2 suggests that this effect is very noisy. This is confirmed in table 2 (below), which displays differences between highest and lowest baseline contributions at different time periods. Discrepancy between minimum and maximum experimental results is relatively higher for early experiments from 1979-1989 (45,34%) but is then fairly constant over time, ranging around 30%. Important deviations from per-period average baseline contribution are still to be found in the later time period.
Period Baseline
Highest Lowest Difference
1979-1989 71.7 26.36 45.31 1990-1994 59 28.97 30.03 1994-1999 50.72 17.13 33.59 1999-2004 41.67 19 32.67 2005-2009 52.27 18.61 33.66 2009-2015 52.7 21.6 31.1
Table 2: Differences between highest and lowest baseline contribution
The noise in the convergence effect is also confirmed by the low R-squared of our regressions. The variable year explains a very small part of the total variation between studies. It is not surprising because there is substantial heterogeneity in our dataset. Unlike previous meta-studies in EE (e.g., Zelmer, 2003), we included meta-studies with very different experimental designs. For instance, in some studies the PG is linear and non-linear in some others. There is also great variation in MPCR across studies. Yet it should be noted that we still find a significant decrease of absdev11 over time despite these important between-studies differences. We conclude that baseline contribution rates are converging from 1979 to 2015, even if the convergence is effective over a large set of studies.
We do not find any significant effect for other regressors in the second specification (model 2), except for econ. Contrary to Hamermesh’s (2016) and Sukhtankar’s (2017) result, citations do not improve replicability (understood here as between-studies convergence of contributions in baseline conditions). Neither does the variable samplesize: extreme results (very higher or lower than middle-term average contribution) are not due to small samplesize leading to under or over-estimated effects. Interestingly, econ is significant at the 5% level (p = 0, 027) with a positive sign, meaning that “exceptional” baseline contributions are likely to be found in
experiments using exclusively students in economics.
3.2
Are baseline contributions declining over time? (models 3-4)
For model 3 and model 4, the variable year has a significant and negative effect on baseline. Experimental results are therefore decreasing over time. Note that this effect is even more significant than the previous convergence effect (p < 0, 01, which is “strongly” significant using popular terminology). The size effect is also important: the coefficient parameter of 0,576 in model 4 means that results in control conditions have decreased on average by 20% from 1979 to 2015 (0, 576 × 35years = 20, 16). Yet Figure 1 clearly shows that there is still substantial variation in contribution rates within each subperiod, as reflected by our low R-squared. Roughly speaking, experiments in the 1980’s are likely to find baseline contribution around 50 to 55%, while studies of the 2010’s would yield smaller rates around 30-35%; but there are important exceptions and baseline contribution rates over 50% are still to be found in the more recent time period. We do not find any significant effect for additional regressors (citations, econ, us, student, samplesize) at the 5% level. Higher or lower results are not explained by any of these methodological variables.
4
Discussion
There is a slight yet significant tendency for baseline results to converge over time in PG game experiments. But the constant and large fluctuation range (more than 30%) between lowest and highest baseline results of the same time period (as seen on Table 1) still allows for a substantial amount of between-studies variation. Our data include only published papers, and it can thus be argued that there are no strong incentives to publish control condition results very close to the middle-term average. A 50% baseline contribution rate might still seem acceptable in the 2010’s (where average baseline is 32,91%). Yet very high baseline contribution rates (superior to 60%) are very less likely to be found. Overall, baseline replication over time can be said to play the role of a “weak constraint” on experimental results.
Our second result (decrease of baseline results over time) is more difficult to interpret. This is not what we were initially looking for, but the effect is coherent with most replication studies in economics and other disciplines where the effect size is often found to be smaller than in the original study. This is not to say that original (older) results are necessarily false. For instance, in the collective replication project in EE mentioned above (Camerer et al., 2016), Ho and Wu’s replication result equals 69,35% of the original result (Ambrus and Greiner, 2012). Yet the main hypothesis of interest is said to be successfully replicated. However, we should keep in mind that the notion of effect size in explicit replications is not the same as the single measures in baseline replication.
With this caveat in mind, it may still be relevant to consider the various explanations that have been offered in other disciplines for this general – and controversial – “decline effect” in replications (see e.g., Schooler, 2011; de Bruin and Della Sala, 2015; see also Ioannidis, 2005)10. We propose to discuss the interrelations between three families of explanations for the decline effect. One family of explanations is in terms of publication biases. For instance, impressive results are easier to get published at first; once the research domain gets legitimized, publication practices favor more “normal” size effects, hence the decrease in experimental results. This does not seem to be an important factor here as we noted that there is still a large fluctuation range in contemporary baseline replication. Another family of explanations is in terms of experimenter biases. For instance, experimenters may (perhaps unconsciously) twist the design of their baseline condition so that the effect they hypothesized in the treatment condition is large. This could explain the decline we observe if there was a gradual shift in PG experiments toward treatment conditions testing mechanism to support cooperation (with larger effects when subjects are more selfish in the baseline condition). This is partially plausible in so far as many early experiments in the 1980’s were meant to provide evidence for non-free riding behavior. For instance, Marwell and Ames (1979; 1981) intended to show that most people (except economists) do actually contribute to PG, contrary to what is predicted by Nash equilibrium. Hence, the purpose was to obtain baseline contribution as high as possible to
10The controversy over the decline effect has taken place in the scientific blogosphere after the publication of
an article in The New Yorker (Lehrer, 2010) on this effect (see, e.g., Myers, 2010; Novella, 2010; Gorski, 2010). Most of the critics point that the decline effect is restricted to experiments involving humans or animal behavior, and does not concern, e.g., physics and chemistry, hence does not have the great implications for the whole of science suggested by the article in The New Yorker.
have the more counter-predictive results for economic theory. There is however a non-trivial counterexample to this explanation: the experiments of Fehr and colleagues (e.g., Fehr and G¨achter, 2000) test cooperation mechanisms, yet contributions in their baseline conditions are quite high (around 50%). Another type of experimenter bias is the non reporting of null and negative results because they are rarely accepted by journals (so this is also a publication bias, known as the “file-drawer” bias or effect). Hence, large and positive effects are over-represented.. This is notoriously difficult to measure as unpublished studies are hard to gather (Ioannidis, 2012, p.651). To hedge against this potential bias, some authors argue that studies should be accepted or rejected before the results are actually being produced (e.g., Zhang and Ortmann, 2013; Dufwenberg, 2015). This method is currently explored in other disciplines (e.g., in social psychology, Schweinsberg et al., 2016). The last family of explanations for the decline effect is in terms of statistical biases. Stricking new results (in our case, very high contribution rates in baseline conditions) tend to be underpowered but this is possibly corrected in subsequent studies (though not necessarily, see Ionnadis, 2012). This explanation is not very plausible in our case because we observed no significant effect of sample size on the convergence and decrease of baseline results. However, notice that in terms of the overall development of a field (e.g., for meta-analyses), global underpowerment is enhanced by the last two types of biases, i.e., selective reporting of significant results and selective acceptance of significant results (see Borenstein et al., 2009, chap.30).
Publications and statistical biases suggest an optimistic interpretation of our results (con-vergence and decrease of baseline results): lab experiments are “self-correcting” over time. Less and less exceptionally high control results are found in later time period, meaning that initial overestimation of size effects is then corrected. Under this interpretation, the incentive to pub-lish only impressive results with high contribution decreases over time so that the publication bias we highligthed progressively disappears from the published literature . We would like to propose a second, less optimistic (though not pessimistic per se) interpretation: both conver-gence and decrease in baseline results are the effect of a mere tendency toward standardization in experimental designs. Standardized protocols might not be the more adequate to measure “real” contribution to PG in the “real world”. If we suppose that the real rate is somewhere around 70%, initial high results in the 1980’s would be actually closer to the real size effect than
the 32,91% average contribution rate found in the 2010’s.
More homogeneous experimental methods are likely to be also the result of mimetic dynam-ics in research and do not obviously constitute a scientific improvement. For instance, after the 1980’s focus on evidence for non-free riding behavior, experimental protocols for baseline condi-tions seem to be more standardized in the 2000’s (similar group sizes, MPCR, and so forth) and thus yield converging results. These subsequent developments have led to the multiplication of experimental treatments. Protocols do not differ solely on basic parameters (e.g., group size, MPCR, communication or no communication) but also the forms of communication, the forms of punishment, payoff uncertainty, information, guessing or no guessing, and so forth (see table 7 in the appendix). The paradox is that control conditions have been increasingly standardized while experimental treatments have become more various. We observed indeed that baseline conditions looked more and more similar in later time periods (cf. infra). Also, we found in later experiments more examples of replications that are considered as “by-products” of the main results (e.g. Chaudhuri et al., 2006; cf. Section 2).. It can thus be hypothesized that in more recent years, experiments were not meant to provide the highest baseline contribution as possible, but rather to contrast a very singular treatment effect to an increasingly standardized (and hence converging) baseline condition. There is no guarantee that greater homogeneity in baseline condition protocols do actually converge to real effect, but they made informal replica-tion easier. This might play an important process in normalizing experimental disciplines such as EE. This is also well in line with the well-documented emphasis on internal validity in EE over external validity (see, e.g., Guala, 2010; Svorenˇc´ık, 2015). As Bardsley (2010, pp.338-339) put it:
“many experimental results [. . . ] have proved to be highly robust and replicable. The ability of experimental economics to establish such results is in part due to the standardization of methods among practitioners. In many aspects of experimental design, there has been convergence to “industry standards” [. . . ]. Whether or not these particular conventions are optimal, standardization itself makes results more comparable across research groups, and so promote replicability”
Standardization and convergence to “industry standards” were also noticeable intuitively when we were collecting data about PG experiments. Our job was a lot easier for more recent pub-lications in which our main variable of interests (group size, sample size, recruitment methods
and so forth) were given in a few short paragraphs of a section entitled “methods” or “exper-imental design”. Usually the same formula was used to determine each subject’s payoff, with a fixed MPCR. In some publications, experimental parameters were explicitly chosen from a previous study: for instance, Nikiforakis (2008) adopts the same VCM treatment as Fehr and G¨achter (2000). Collecting data in older publications took much more time. Experiments in the 1980’s and 1990’s seem to use more complex and singular forms of PG games: for instance, payoff matrices produced from Cobb-Douglas functions instead of fixed MPCR, multiple thresh-old conditions for the PG, or various endowments between subjects. Basic information about experimental parameters and protocol was frequently displayed in different parts of the paper, sometimes in footnotes or in appendix.
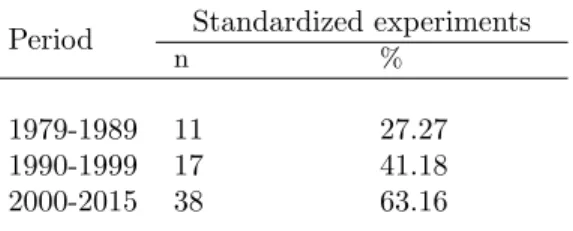
To test this hypothesis about the standardization of baseline treatments, we collected data about two experimental parameters: the MPCR and group size (of baseline treatment). These parameters are known to have a large influence on contribution to the PG (Zelmer, 2003) and we observed intuitively that more and more control treatments were conceived with a fixed MPCR of 0,3 or 0,4 or 0,5 and 4 or 5 subjects per group. We therefore classified a baseline experiment as “standardized” if those values were chosen for these two parameters.
Period Standardized experiments
n %
1979-1989 11 27.27
1990-1999 17 41.18
2000-2015 38 63.16
Note: Baseline treatements are classified as standardized if MPCR=0,3 or 0,4 or 0,5 and group size = 4 or 5
Table 3: Standardization in baseline experiments, 1979-2015
Table 3 shows a clear tendency toward standardization from 1979 to 2015. After 2000, about two-third of PG games use the same basic experimental protocol with 4 or 5 persons-groups and a linear PG payoff yielding an exact and fixed return of 0,3 or 0,4 or 0,5; whereas those values were found only in approximately one experiment out of four in the 1980’s. This greater similarity across baseline treatment played undoubtedly an important role in the convergence that we observed in the previous section.
Another – this time bibliometric – result of our study is that citations do not have a significant influence on the convergence of baseline results. If GS citations are taken as indicator of quality for published papers, it can be said that publishing incentives in the scholar market do not favor replication in EE, contrary to what Hamermesh finds in applied labour economics (2016) or Sukhtankar et al. (2017) in development economics11. Qualitative observation suggests that replication in EE does not target primarily most-heavily cited publications, but rather operates through networks of associated labs, experimenters and experiments. For instance, experiments of research group including Fehr and G¨achter (and experiments using similar protocols) clearly form a subgroup in our data that provide baseline contribution ranging around 50% (a fairly high contribution rate in the 2000’s). Networks and subgroups might also explain the great variability in baseline results within each time period. There is actually not a single standardized baseline protocol but rather several of them corresponding to different research subfields within PG experiments.
To conclude on our initial question, EE is not immune to the replication crisis. Replication studies are very rare in EE, and even less developed than in (non-experimental) applied eco-nomics, as argued in section 1. Yet we found a tendency for convergence in baseline results, suggesting that replication in EE might be mostly effective through baseline replication. Base-line replication provides a “weak constraint” on experimental results and partially guarantee their reproducibility. This might explain why EE performed relatively better than experimental psychology in recent replication surveys (cf. supra, Collaboration et al., 2015; Camerer et al., 2016). We therefore agree with Camerer et al. on the “relatively good replication success” of EE (compared to psychology). Yet we disagree on the interpretation of this result. Camerer et al. provide the following explanation for their result:
“two methodological research practices in laboratory experimental economics [...] may contribute to relatively good replication success. First, experimental economists have strong norms about always motivating subjects with substantial financial in-centives, and not using deception. These norms make subjects more responsive and may reduce variability in how experiments are done across different research teams, thereby improving replicability. Second, pioneering experimental economists were eager for others to adopt their methods. To this end, they persuaded journals to
11Of course their results are built on explicit replications, whereas we study implicit baseline replication. Yet
print instructions - and even original data - in scarce journal pages. These edito-rial practices created norms of transparency and made replication and reanalysis relatively easy.” (Camerer et al., 2016, p.1435)
In other words, EE’s results are more robust because they are based on more reliable methods: paying subjects and transparency in editorial practices. We provided evidence suggesting that better reproducibility in EE is not the effect of better methods but rather more similar methods. There are good reasons to believe that the decrease and convergence in baseline results reflect a tendency to standardize experimental protocols. Such standardization is not equivalent to pure scientific progress and it does not necessarily imply that EE is relatively more scientifically advanced than experimental psychology. In this regard, it might be interesting for further research to compare the state of standardization in EE and experimental psychology.
We propose to reflect on our historical approach to shed some light on the methodology of quantitative methods in the history of economics (HE). Our previous discussion clearly shows that qualitative insights are necessary for both the construction of the object, i.e., without baseline replication one cannot observe patterns of replication in EE, and to interpret our quantitative results, i.e., convergence and decrease of baseline replication over time do not have meaning per se. As de Vroey argues, purely bibliometric methods in HE might miss important features of the economic literature (De Vroey, 2016). Converging baseline results over time does not mean that EE’s results are more and more robust; familiarity with qualitative aspects of the field are needed to understand research tactics within subgroups and to provide hypothetical explanations for bibliometric statistics. Nevertheless, it would have been very hard to get the results of our study by using a purely qualitative approach, as traditional in HE. Indeed, a purely qualitative approach to the problem of replication in PG experiments would have probably missed the two effects we found. We might have suspected a general tendency for decrease and convergence in baseline results, but as these tendencies are very noisy, it is always possible to find counter-examples (e.g. a 50% contribution rate in the 2010’s) that would have led us to reject the validity of our hypothesis. Another related problem is that we would also have focused on heavily-cited publications that are not necessarily representative of the whole field, in particular the Fehr and G¨achter’s experiments that constitute a rather specific subgroup, with relatively high baseline results. As Backhouse et al. (1997) point out, an important advantage
of quantitative methods in this regard is that they allow to focus on the “average” contribution to the discipline, rather than the exceptional individual.
We therefore argue in favor of going beyond descriptive statistics by using basic econometric tools in HE that might indicate unnoticed historical patterns. This brings the method of histori-ans of economics closer to the methods of economists. One advantage is that historihistori-ans are thus submitted to the same standard of evidence than economists (cf. Backhouse et al., 1997), facil-itating the dialog between each academic community. The current state of quantitative history seems largely unsatisfactory in this regard. Most quantitative contributions in HE are based on purely descriptive statistics (e.g., Hoover, 2012) or at best network analysis (e.g., Emmett, 2009). It refers to what Daudin considers as the two most basic uses of quantitative methods in history: “counting things” and “exploring the data”(Daudin, 2011). Network analysis might be interesting to investigate connections between individuals, but large-scale publication patterns do not necessarily involve networks.
A more sophisticated use of quantitative methods in history consists in “establishing rela-tions” (Daudin, 2011). It requires to follow the basic method of hypothesis testing using the appropriate statistical tools, as we tried to do in this paper. An objection would be that there are already many applied economists and econometricians using econometric approaches to do bibliometrics (e.g. Card and DellaVigna, 2013), particularly in the A14 Jel Code which covers studies in “sociology of economics”, i.e. essentially applied economics of the economic profession. Historians would thus lose their specificity in becoming “economists of economics”. They could not become as good in statistics as professional econometricians and would face the competition of scholars using tools from quantitative sociology such as social network analysis (e.g., Claveau and Gingras, 2016). Our response to this objection is twofold. First, statistical tools are not necessarily very sophisticated to find relevant result in quantitative HE. Basic econometric tool (corresponding roughly to an undergraduate level) are probably sufficient for historians, i.e., in order to highlight patterns of historical interests. Second, the specificity of quantitative history relatively to the “economics of economics” subfield is that time remains the main variable of interest. In particular, this is what distinguished our approach in this paper from previous theoretical meta-studies in EE.
Conclusion
The goal of this paper was to propose a historical perspective on the practice of replica-tion in experimental economics. Explicit methodological discussions of replicareplica-tion in economics highlight several meanings of “replication”. However none of these meanings correspond to the most widely practiced type of replication in experimental economics, which we called “baseline replication”: that similar baseline conditions in different experiments have to yield similar re-sults. We proposed a quantitative approach to highlight the historical dynamics of replication in public good games experiments. We found that results in baseline conditions converge over time, which suggests that baseline replications are effective over time, but they also decline over time, which suggests a counter-intuitive (i.e., non-stable) notion of replication. We prefer to interpret our results as a sign of the standardization of experimental practice over time which favors internal validity, rather than a sign of scientific progress towards a “true” baseline re-sult in PG games. We hope that our blend of qualitative and quantitative approach to history of recent economics can motivate discussions with economists, both regarding our econometric method and our empirical results. In terms of further work, our results suggest that finding a measure of standardization of experimental protocols can provide an interesting variable to study long-term patterns in experimental economics. Finally, baseline replication in other types of experiments than PG games could be studied.
References
Ambrus, A. and B. Greiner (2012). Imperfect public monitoring with costly punishment: An experimental study. The American Economic Review 102 (7), 3317–3332.
Andreoni, J. (1988). Why free ride?: Strategies and learning in public goods experiments. Journal of public Economics 37 (3), 291–304.
Ashenfelter, O., H. Robert H, R. John G, and T. M. John T (1986). Editorial statement. American Economic Review 76 (4).
Backhouse, R., R. Middleton, and K. Tribe (1997). Economics is what economists do, but what do the numbers tell us? draft, University of Birmingham.
Bardsley, N. (2010). Experimental economics: Rethinking the rules. Princeton University Press. Bernanke, B. S. (2004). Editorial statement. American Economic Review 94 (1), 404.
Blackwell, C. et al. (2002). A meta-analysis of tax compliance experiments. In Annual Confer-ence on Public Choice in San Diego.
Borenstein, M., L. V. Hedges, J. P. Higgins, and H. R. Rothstein (2009). Introduction to Meta-Analysis, Chapter Publication Bias, pp. electronic version. Wiley.
Camerer, C. F., A. Dreber, E. Forsell, T.-H. Ho, J. Huber, M. Johannesson, M. Kirchler, J. Almenberg, A. Altmejd, T. Chan, et al. (2016). Evaluating replicability of laboratory experiments in economics. Science 351 (6280), 1433–1436.
Card, D. and S. DellaVigna (2013). Nine facts about top journals in economics. Journal of Economic Literature 51 (1), 144–161.
Chang, A. C., P. Li, et al. (2017). A preanalysis plan to replicate sixty economics research papers that worked half of the time. American Economic Review 107 (5), 60–64.
Chaudhuri, A. (2011). Sustaining cooperation in laboratory public goods experiments: a selec-tive survey of the literature. Experimental Economics 14 (1), 47–83.
Chaudhuri, A., T. Paichayontvijit, et al. (2006). Conditional cooperation and voluntary contri-butions to a public good. Economics Bulletin 3 (8), 1–14.
Claveau, F. and Y. Gingras (2016). Macrodynamics of economics: A bibliometric history. History of Political Economy 48 (4), 551–592.
Clemens, M. A. (2015). The meaning of failed replications: A review and proposal. Journal of Economic Surveys.
Coffman, L. C. and M. Niederle (2015). Pre-analysis plans have limited upside, especially where replications are feasible. The Journal of Economic Perspectives 29 (3), 81–97.
Collaboration, O. S. et al. (2015). Estimating the reproducibility of psychological science. Sci-ence 349 (6251), aac4716.
Croson, R. T. and M. B. Marks (2000). Step returns in threshold public goods: A meta-and experimental analysis. Experimental Economics 2 (3), 239–259.
Daudin, G. (2011). Quantitative methods and economic history. In F. Ammannati (Ed.), Where is economic history going? Methods and prospects from the 13th to the 18th centuries. Firenze University Press.
de Bruin, A. and S. Della Sala (2015). The decline effect: How initially strong results tend to decrease over time. Cortex 73, 375–377.
De Vroey, M. (2016). Bibliometric versus inside-knowledge history? an assessment of claveau and gingras’s ”macrodynamics of economics: A bibliometric history”. Technical report, Universit´e catholique de Louvain, Institut de Recherches Economiques et Sociales (IRES).
Deck, C., E. Fatas, and T. Rosenblat (2015). Encouraging replication of economics experiments. In C. Deck, E. Fatas, and T. Rosenblat (Eds.), Replication in Experimental Economics, pp. 3–9. Emerald Group Publishing Limited.
DerSimonian, R. and N. Laird (1986). Meta-analysis in clinical trials. Controlled clinical tri-als 7 (3), 177–188.
Dewald, W. G., J. G. Thursby, R. G. Anderson, et al. (1986). Replication in empirical economics: The journal of money, credit and banking project. American Economic Review 76 (4), 587– 603.
Dufwenberg, M. (2015). Maxims for experimenters. In G. R. Fr¨ı¿œchette and A. Schotter (Eds.), Handbook of experimental economic methodology. Oxford University Press.
Duvendack, M., R. W. Palmer-Jones, and W. R. Reed (2015). Replications in economics: A progress report. Econ Journal Watch 12 (2), 164–191.
Emmett, R. B. (2009). The chicago workshop model: normalizing or fragmenting scientific collaboration?
Engel, C. (2011). Dictator games: a meta study. Experimental Economics 14 (4), 583–610. Fehr, E. and S. G¨achter (2000). Fairness and retaliation: The economics of reciprocity. The
journal of economic perspectives 14 (3), 159–181.
Fischbacher, U. and S. G¨achter (2010). Social preferences, beliefs, and the dynamics of free riding in public goods experiments. The American economic review 100 (1), 541–556. Glandon, P. (2010). Report on the american economic review data availability compliance
project.
Gorski, D. (2010). The ”decline effect”: Is it a real decline or just science correcting it-self? Science-Based Medicine (blog). https://sciencebasedmedicine.org/the-decline-effect-or-a-exaggeration-of-the-messiness-of-science-and-science-based-medicine/.
Guala, F. (2005). The methodology of experimental economics. Cambridge University Press. Guala, F. (2010). History of experimental economics. In S. Durlauf and L. Blume (Eds.),
Behavioural and Experimental Economics, pp. 99–106. Springer.
Hamermesh, D. S. (2007). Viewpoint: Replication in economics. Canadian Journal of Eco-nomics/Revue canadienne d’´economique 40 (3), 715–733.
Hamermesh, D. S. (2016). Replication in labor economics: Evidence from data, and what it suggests.
Hoover, K. (2012). Microfoundational programs. In P. Duarte and G. L. Tadeu (Eds.), Mi-crofoundations Reconsidered: The Relationship of Micro and Macroeconomics in Historical Perspective, pp. 19–61. Cheltenham: Edward Elgar.
Ioannidis, J. P. (2005). Contradicted and initially stronger effects in highly cited clinical research. Journal of the American Medical Association 294 (2), 218–228.
Ioannidis, J. P. (2012). Why science is not necessarily self-correcting. Perspectives on Psycho-logical Science 7 (6), 645–654.
Johnson, N. D. and A. A. Mislin (2011). Trust games: A meta-analysis. Journal of Economic Psychology 32 (5), 865–889.
Kane, E. J. (1984). Why journal editors should encourage the replication of applied econometric research. Quarterly Journal of Business and Economics, 3–8.
Koenker, R. and A. Zeileis (2009). On reproducible econometric research. Journal of Applied Econometrics 24 (5), 833–847.
Ledyard, J. (1995). Public goods: A survey of experimental research. In J. H. Kagel and A. E. Roth (Eds.), The handbook of experimental economics. Princeton university press.
Lehrer, J. (2010). The truth wears off. The New Yorker December.
http://www.newyorker.com/magazine/2010/12/13/the-truth-wears-off.
Levitt, S. D. and J. A. List (2009). Field experiments in economics: The past, the present, and the future. European Economic Review 53 (1), 1–18.
Marwell, G. and R. E. Ames (1979). Experiments on the provision of public goods. i. resources, interest, group size, and the free-rider problem. American Journal of sociology 84 (6), 1335– 1360.
Marwell, G. and R. E. Ames (1981). Economists free ride, does anyone else?: Experiments on the provision of public goods, iv. Journal of public economics 15 (3), 295–310.
McCullough, B. D., K. A. McGeary, and T. D. Harrison (2006). Lessons from the jmcb archive. Journal of Money, Credit, and Banking 38 (4), 1093–1107.
Mirowski, P. and S. Sklivas (1991). Why econometricians don’t replicate (although they do reproduce). Review of Political Economy 3 (2), 146–163.
Mueller-Langer, F., B. Fecher, D. Harhoff, and G. G. Wagner (2017). The economics of replica-tion.
Myers, P. (2010). Science is not dead. ScienceBlogs. https :
//web.archive.org/web/20110303224843/http : //scienceblogs.com :
80/pharyngula/2010/12/scienceisnotdead.php?.
Nikiforakis, N. (2008). Punishment and counter-punishment in public good games: Can we really govern ourselves? Journal of Public Economics 92 (1), 91–112.
Nikiforakis, N. and R. Slonim (2015). Editors’ preface: introducing jesa. Journal of the Economic Science Association 1 (1), 1–7.
Novella, S. (2010). The decline effect. Neurologica Blog.
http://theness.com/neurologicablog/index.php/the-decline-effect/.
Percoco, M. and P. Nijkamp (2009). Estimating individual rates of discount: a meta-analysis. Applied Economics Letters 16 (12), 1235–1239.
Plott, C. R. (1982). Industrial organization theory and experimental economics. journal of Economic Literature 20 (4), 1485–1527.
Prante, T., J. A. Thacher, and R. P. Berrens (2007). Evaluating coasean bargaining experiments with meta-analysis. Economics Bulletin 3 (68), 1–7.
Ray, D. and A. Robson (2016). Certified random co-authors.
Richter, S. H., J. P. Garner, and H. W¨urbel (2009). Environmental standardization: cure or cause of poor reproducibility in animal experiments? Nature methods 6 (4), 257–261. Rosenblat, T., E. Fatas, and C. A. Deck (2015). Replication in Experimental Economics.
Emer-ald Group Publishing.
Schmidt, S. (2009). Shall we really do it again? the powerful concept of replication is neglected in the social sciences. Review of General Psychology 13 (2), 90.
Schneider, F. and W. W. Pommerehne (1981). Free riding and collective action: An experiment in public microeconomics. The Quarterly Journal of Economics 96 (4), 689–704.
Schooler, J. (2011, February). Unpublished results hide the decline effect. Nature 470, 437. Schweinsberg, M., N. Madan, M. Vianello, S. A. Sommer, J. Jordan, W. Tierney, E. Awtrey,
L. L. Zhu, D. Diermeier, J. E. Heinze, et al. (2016). The pipeline project: Pre-publication independent replications of a single laboratory’s research pipeline. Journal of Experimental Social Psychology 66, 55–67.
Smith, V. L. (1994). Economics in the laboratory. The Journal of Economic Perspectives 8 (1), 113–131.
Sukhtankar, S. et al. (2017). Replications in development economics. American Economic Review 107 (5), 32–36.
Svorenˇc´ık, A. (2015). The experimental turn in economics: a history of experimental economics. PhD Dissertation.
Zelmer, J. (2003). Linear public goods experiments: A meta-analysis. Experimental Eco-nomics 6 (3), 299–310.
Zhang, L. and A. Ortmann (2013). Exploring the meaning of significance in experimental economics.
Appendix
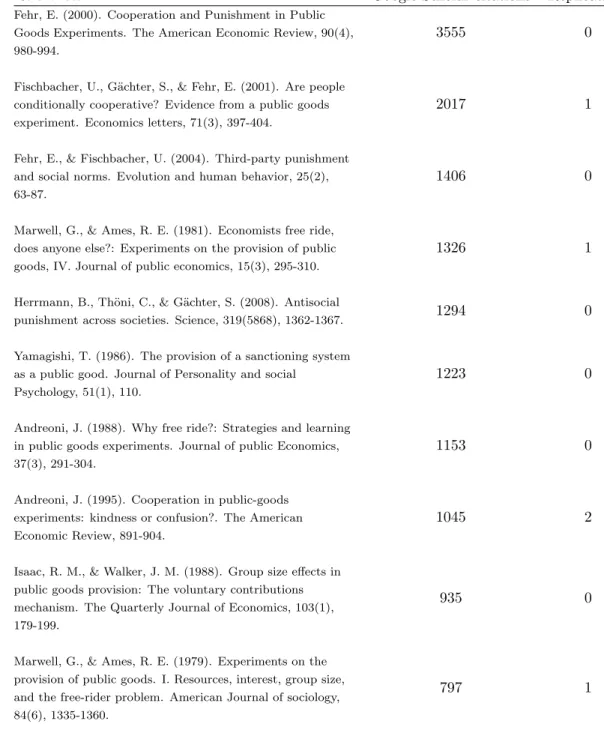
Table 4: 10 most-heavily cited publications in public goods experiments and their replications.
References Google Scholar citations Replications
Fehr, E. (2000). Cooperation and Punishment in Public Goods Experiments. The American Economic Review, 90(4), 980-994.
3555 0
Fischbacher, U., G¨achter, S., & Fehr, E. (2001). Are people conditionally cooperative? Evidence from a public goods experiment. Economics letters, 71(3), 397-404.
2017 1
Fehr, E., & Fischbacher, U. (2004). Third-party punishment and social norms. Evolution and human behavior, 25(2), 63-87.
1406 0
Marwell, G., & Ames, R. E. (1981). Economists free ride, does anyone else?: Experiments on the provision of public goods, IV. Journal of public economics, 15(3), 295-310.
1326 1
Herrmann, B., Th¨oni, C., & G¨achter, S. (2008). Antisocial
punishment across societies. Science, 319(5868), 1362-1367. 1294 0 Yamagishi, T. (1986). The provision of a sanctioning system
as a public good. Journal of Personality and social Psychology, 51(1), 110.
1223 0
Andreoni, J. (1988). Why free ride?: Strategies and learning in public goods experiments. Journal of public Economics, 37(3), 291-304.
1153 0
Andreoni, J. (1995). Cooperation in public-goods experiments: kindness or confusion?. The American Economic Review, 891-904.
1045 2
Isaac, R. M., & Walker, J. M. (1988). Group size effects in public goods provision: The voluntary contributions mechanism. The Quarterly Journal of Economics, 103(1), 179-199.
935 0
Marwell, G., & Ames, R. E. (1979). Experiments on the provision of public goods. I. Resources, interest, group size, and the free-rider problem. American Journal of sociology, 84(6), 1335-1360.
797 1
Note: to gather these 10-most cited references on PG game experiments, we compared the GS citations of papers : a) from our dataset, b) from Chaudhuri’s (2011) review, c) gathered through Zelmer’s (2003) method with keywords replic* + public games + experiment* in EconLit, d) gathered by searching
Table 5: Replications in PG experiments.
References Original study Replication
methodology
Herrmann, B., & Th¨oni, C. (2009). Measuring conditional cooperation: a replication study in Russia. Experimental Economics, 12(1), 87-92.
Fischbacher, U., G¨achter, S., & Fehr, E. (2001). Are people conditionally cooperative? Evidence from a public goods experiment. Economics letters, 71(3), 397-404.
Pure replication
Croson, R. T. (1996). Partners and strangers revisited. Economics Letters, 53(1), 25-32.
Andreoni, J. (1988). Why free ride?: Strategies and learning in public goods experiments. Journal of public Economics, 37(3), 291-304.
Pure replication
Camerer, C. F., Dreber, A., Forsell, E., Ho, T. H., Huber, J., Johannesson, M., ... & Heikensten, E. (2016). Evaluating replicability of laboratory experiments in economics. Science, 351(6280), 1433-1436.
Ambrus, A., & Greiner, B. (2012). Imperfect public monitoring with costly punishment: An experimental study. The American Economic Review, 102(7), 3317-3332.
Pure replication
Weimann, J. (1994). Individual behaviour in a free riding experiment. Journal of Public Economics, 54(2), 185-200.
Andreoni, J. (1988). Why free ride?: Strategies and learning in public goods experiments. Journal of public Economics, 37(3), 291-304.
Robustness test
Marwell, G., & Ames, R. E. (1980). Experiments on the provision of public goods. II. Provision points, stakes, experience, and the free-rider problem. American Journal of Sociology, 85(4), 926-937.
Marwell, G., & Ames, R. E. (1979). Experiments on the provision of public goods. I. Resources, interest, group size, and the free-rider problem. American Journal of sociology, 84(6), 1335-1360.
Robustness test
Seguino, S., Stevens, T., & Lutz, M. (1996). Gender and cooperative behavior: economic man rides alone. Feminist Economics, 2(1), 1-21.
Marwell, G., & Ames, R. E. (1981). Economists free ride, does anyone else?: Experiments on the provision of public goods, IV. Journal of public economics, 15(3), 295-310.
Robustness test
Sutter, M., & Weck-Hannemann, H. (2004). An experimental test of the public goods crowding out hypothesis when taxation is endogenous. FinanzArchiv: Public Finance Analysis, 60(1), 94-110.
Andreoni, J. (1993). An experimental test of the public-goods crowding-out hypothesis. The American Economic Review, 1317-1327.