HAL Id: cea-01840708
https://hal-cea.archives-ouvertes.fr/cea-01840708
Submitted on 16 Jul 2018HAL is a multi-disciplinary open access archive for the deposit and dissemination of sci-entific research documents, whether they are pub-lished or not. The documents may come from teaching and research institutions in France or abroad, or from public or private research centers.
L’archive ouverte pluridisciplinaire HAL, est destinée au dépôt et à la diffusion de documents scientifiques de niveau recherche, publiés ou non, émanant des établissements d’enseignement et de recherche français ou étrangers, des laboratoires publics ou privés.
Health Monitoring of the Saint-Jean bridge of Bordeaux,
France using Fiber Bragg Grating Extensometers
Sylvain Magne, Jonathan Boussoir, Stéphane Rougeault, Véronique
Dewynter-Marty, Pierre Ferdinand, Lionel Bureau
To cite this version:
Sylvain Magne, Jonathan Boussoir, Stéphane Rougeault, Véronique Dewynter-Marty, Pierre Ferdi-nand, et al.. Health Monitoring of the Saint-Jean bridge of Bordeaux, France using Fiber Bragg Grat-ing Extensometers. Smart Structures and Materials 2003 : Smart Sensor technology and Measurement Systems, Mar 2003, San Diego, United States. pp.305-316, �10.1117/12.484244�. �cea-01840708�
Health Monitoring of the Saint-Jean bridge of Bordeaux, France
using Fiber Bragg Grating Extensometers
Sylvain Magne*a, Jonathan BOUSSOi?, Stéphane Rougeaulta, Véronique MartyDewyntera,
Pierre Ferdinanda and
Lionel
Bureaub
a Laboratoire de Mesures Optiques, CEA-List (DIMRI-SIAR), CEA-Saclay F91 191 Gif-sur-Yvette
b HYDROLOG
S.A., Avenue Victor Hugo, F33560 Carbon-Blanc FRANCE
ABSTRACT
Most civil engineering structures have been built in the 50's and 60's and reach similar level ofdegradation accelerated by loading conditions and corrosion. In Europe, National Authorities and the European Commission promote Health Monitoring concepts, instrumentation of existing structures and help in the design of new durable structures of higher performance. In this context, the CEA-List has achieved a non-exclusive industrial transfer of its Bragg grating sensing technology for civil engineering applications to Hydrolog (French SME), supported by the European Community and the french ministry of Industry. In order to check the reliability and user-friendliness of this instrumentation, eleven spectrally-multiplexed Bragg grating-based extensometers, four FBG temperature sensors and an acquisition unit have been installed into the Saint-Jean bridge in Bordeaux, France with the help of the Infrastructure Regional Direction (DRE-Aquitaine) and the Bordeaux Authority (Communauté Urbaine de Bordeaux). A standardized loading of the bridge has been performed on October 29, 2001, with the purpose of correlating its mechanical reaction to loading conditions. Moreover, the equipment has been operating for one year to take into account the winter-summer cycle. Keywords : Health Monitoring, Civil Engineering, Extensometer, Optical Fiber Sensor, Fiber Bragg Grating
1. INTRODUCTION
Most civil engineering structures have been built in the 50's and 60's and most are badly maintained. Their level of degradation is accelerated by loading conditions and corrosion (mainly due to salt in winter) and varies according to climatic conditions and transportation capacity. Most countries are concerned and a few have already launched dedicated centers ofexcellence to deal with these civil engineering issues (such as the Intelligent Sensing for Innovative Structures (ISIS) Canadian center for instance). In Europe, National Authorities and the European Commission promote Health Monitoring concepts, instrumentation of existing structures and help in the design of new durable structures of higher performance. The challenge is to increase the road and train traffic while maintaining the structures in a safe state under a cost-effective approach. This is the raison d'être of the structure monitoring concept which assesses structural integrity, helps anticipating failure modes and thus helps optimizing planning for further structural interventions and rehabilitations. In France, although the situation is less worrying than in North America, 95 % of all civil structures are in good health, the remaining 5 % should be monitored and halfofthese are seriously damaged. The Optical Measurement Laboratory of the CEA-List, based in Saclay (South West ofParis) is actively working in the field of Fiber Bragg Grating (FBG) Sensors and Systems since 1992. Although this technology is useful for many industrial sectors, from the composite industry, transportation means (train bogie, ship hull and mast, aircraft wing, radome and rotor blades, aerospace structures), to electro-nuclear applications ,perhapsthe most important one (in
term of immediate market share) is surely Civil Engineering 2,Manycivil structures are likely to be instrumented with these sensors (historical monuments, box-girder bridges, cable-stayed bridges, dams, large buildings, tunnels, ...).
Applications include in-situ concrete curing process monitoring and pre-stress determination ,repairusing epoxy-bonded Carbon Fiber Reinforced Panels (CFRP) ",HealthMonitoring (micro-cracking, impact detection, post-seismic
damage evaluation) 6 Steel Corrosion Detection ,LoadRating, Weight-in-Motion (WIM) and Vehicle Counting!
*
sylvain.magnecea.fr;phone : 33 (0)1 69089047 ; Fax: 33 (0)1 690883 95
Identification (VCIId) 8 These applications have been described in a previous review .Many civil engineering structures have already been equipped by Optical Fiber Sensors, mainly Fiber Bragg Gratings and White light interferometers. Let us focus on Fiber Bragg Grating sensors applications in Civil Engineering.
In 1993, the city of Calgary (Alberta, Canada) commissioned the first highway bridge in the world (Beddington Trail bridge) to use carbon fiber composite prestressing tendons in some ofthe precast concrete girders. CFRP-made tendons are interesting alternatives to steel-made tendons because of their resistance to corrosion. Furthermore, the optical fiber may be inserted during the manufacturing process thus making optical sensors very appropriate for civil engineering purposes. This bridge has been equipped with 18 strain sensors (in various locations along the bridge) mounted on pre-stressing tendons by a team from the University ofToronto (UTIAS) '°
Inthe same context, a cable-stayed bridge (Strochenbrucke in Wintherthur, Switzerland) has been equipped with FBG strain sensors by a team from the Swiss Federal Laboratory for Materials Testing and Research 12Lateron, a dam
(Luzzone, Switzerland) has also been equipped by the same team 13,
Thesesensor types have also been installed on the 1-10 bridge in Las Cruces (New Mexico, USA) and on the Vaux Viaduct near Lausanne (Switzerland) 14
A
team from the US/Navy has also instrumented Interstate bridges with FBG sensors for static and dynamic strain monitoring 15,A
team from the Dresden University in Germany (now Avanced Optics Solutions) has embedded FBG strain sensors in a concrete bridge across the A4 motorway near Dresden 16,Theyhave observed the concrete shrinkage and loading conditions. Marine piles made of concrete with composite fiber over-wraps have also been equipped with FBG sensors to enable quasi distributed strain profiling over the pile length 6,
Finally,FBG are also useful to monitor the long-term health of historical monuments. In this perspective, people from
Blue Road Research have equipped an historical bridge near Portland, Oregon (Horsetail Falls bridge) with 28 FBG sensors during a rehabilitation phase including CFRP reinforcement above the concrete deck. Conversely, people from ISPRA (Italy) have equipped the Cathedral of Como (Duomo Di Como, Italy) with long-gage FBG extensometers to follow crack openings in some limited access locations (such as the roof) 17,
Afterthis brief outlook about the use of FBG sensors and systems for civil engineering applications, the reader should keep in mind that the global Smart Structure Concept not only implies sensor networks and demultiplexing systems but also actuation, so that a so-called 'smart' structure would automatically correct for its perturbation or wrong behaviour. Therefore, parallel researches are made on Active Control Systems such as those investigated during the European ACE (Active Control in Civil Engineering) project dedicated to active damping ofcable-stayed bridge 18,
In this context, the CEA-List has also made some field tests in the framework of previous National Programs (Electricité de France) and European Projects (STABILOS, COSMUS) 19,The COSMOS project dealt with 'smart public works'. FBG inclinometers with auto-thermal com?ensation have been designed and field-tested in an old church in Toulon, France during underground freeway tunneling 0
Forthe time being, CEA-List is achieving a non-exclusive industrial transfer of its Bragg grating sensing technology for civil engineering applications to Hydrolog (French SME), supported by the European Community and the french ministry of Industry. Furthermore, the partners have asked to field-test the product to check the reliability and user-friendliness of this instrumentation under civil engineering conditions. The CEA and Hydrolog have been assisted by the French Infrastructure Regional Direction (DRE-Aquitaine) and the Bordeaux Authority (Communauté Urbaine de Bordeaux) for the organization of this field test in the Saint-Jean bridge in Bordeaux, France. It consisted of a standardized loading of the bridge involving several heavy trucks and a one-year real-time acquisition of its thermo-mechanical behavior.
2. FIBER BRAGG GRATING CEA-PROPRIETARY INSTRUMENTATION
FOR CWIL ENGINEERING APPLICATIONS
2.1 Advantages of Fiber Bragg Grating Sensors for Civil Engineering applications
The Fiber Optic Sensing Technology developed by the CEA is based on Fiber Bragg Grating wavelength-encoded transducing operation. This transducing mechanism is now very well-known 19,Sincethese sensors are based upon spectral signatures, they enable wavelength multiplexing, render the measurement free from intensity fluctuations, and may be disconnected and reconnected at any time without recalibration procedure. Therefore, there is no need to leave the opto-electronic readout system permanently connected to the sensor array. Moreover, FBG sensors may be connected in series along a single fiber, greatly simpli!ying the cabling procedure. Since the gratings have to share the light source spectrum, the greatest the dynamic range, the smallest the number of sensors per line will be (for instance, 4
extensometers are spectrally-addressed when illuminated by a Superfluorescent Erbium-Doped Fiber Source (EDFS) of spectral bandwidth & =35 ran). Consequently, an optical switch is often incorporated into the acquisition unit to address several lines under a parallel arrangement. Therefore, each line is multiplexed in a time-sharing approach. Such a matrix sensor network, typically incorporating 32 to 64 sensors, is able to gather all the relevant information about the structural behavior oflarge structures.
Moreover, a great number of physical parameters is measurable (jnimarily temperature and strain, but also
displacement, force, pressure, humidity, angle, ...)viaappropriate transducing mechanisms. Of course, the fiber must be mechanically protected and dedicated housings must be designed. All the data gathered from all the FBG sensors are inherently coded the same way, i.e. as wavelength variations, and stored in a single acquisition unit. From the Civil Engineer point-of-view, the Fiber Optic Sensing technology conveys determinant advantages : quasi real-time and remote sensor operation, Ease ofcabling, Data sorting and acquisition, Electromagnetic and lightning immUnity.
Fiber Optic Sensors may be used merely to replace electrical sensors whenever these latter sensors fail (high temperature, high electromagnetic perturbation, etc). However, they provide additional functionalities. For instance, these sensors may be fixed onto or embedded into concrete structures while casting, or incorporated into reinforcing elements such as steel cables or tendons .Inthe same way, the CEA has patented an extensometer design in which the fiber sensors are pultruded into a composite bar to make a long-length gage extensometer (e.g. 10-meter long) including multiple transducers. This extensometer concept is particularly useful to provide a wide strain analysis over a large structure span. Alternatively, it may follow very large crack openings or displacements that otherwise could not be monitored by smaller gage length. Conversely, short-gage extensometers are useful to complete the strain information by aiming at a particular area of interest. The Civil Engineer has to choose the extensometer design according to the expected crack opening, so as to fit the sensor range and prevent any destruction ofits sensor.
However, the cost of the optical instrumentation and sensors (which basic components are standardized by the Optical Telecommunication market) is still higher than its electronic counterpart (strain gages, vibrating wires). Nevertheless, in the perspective of installation requiring a great number of sensors (several tens to several hundreds), the multiplexing capability of numerous sensor types, and the gain in maintenance cost (due to simplification in cabling and data handling) make this optical technology actually competitive. Moreover, the overcost penalty is very often surpassed by indirect costs (closed roads, accidents) and safety aspects, once again rendering this technology very attractive.
2.2 Description of the FBG sensors and associated system Optoelectronic acquisition unit
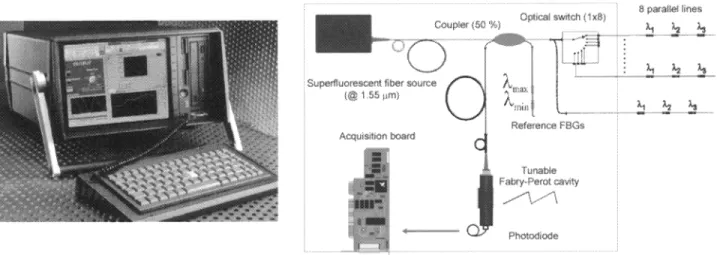
The optoelectronic readout system developed by the CEA is shown in fig. 1 .
It
is incorporated into an industrial Portable Computer which incorporates dedicated opto-electronic boards (fig. 2). The first board includes an optical source (EDFS). The second board includes a tunable Fabry-Perot cavity and its low-noise photodiode and electronic amplifiers. Finally, the third board includes an optical switch (typ. 1 x 8) and I/O connections. The spectral demultiplexing (sensor identification) and wavelength shift measurements are achieved simultaneously. Another interesting aspect is that the spectral acquisition is performed as the cavity is swept forward while the data processing and switch allocation are performed as the cavity is swept backward, in an optimized time-sharing configuration. The frequency range is suitable for long-term Health Monitoring of Civil Engineering structures. For such thenno-mechanical applications, the measurement frequency is 0.5 Hz for one optical line. It changes to 0.125 Hz for each line (among four parallel lines). A user-friendly software, implemented in a Lab-View® platform, incorporates a setup procedure, an acquisition mode and a data storing! display mode. This system is very easy to handle by civil engineers, as there is no need for them to be familiar with optics.Short- and Long-Gage Extensometers
Two types of extensometers have been developed by the CEA. Both may be connected in series (the fibre runs in and out) and may be screwed onto fasteners fixed onto concrete or embedded while casting.
The first type is a Short-Gage Extensometer (SGE). In this extensometer design (fig. 3), the fiber is bonded onto a steel bar (20-cm long) threaded to both ends and protected by a plastic sleeve. It may work either Under compression or Under traction up to 0.25 % in strain.
a
Fig.1 : Acquisition unit for FBG sensing purposes Fig. 2 : Optoelectronic system for the demultiplexing and acquisition built in an industrial PC ofthe FBG sensors data
The second type is a LongGage Extensometer (LGE) obtained by a pultrusion process 21(fig.4). In this process, parallel glass reinforcing fibres are bundled and projected through a resin-impregnation furnace and through successive heating zones enabling carefully-controlled polymerization and cooling phases. The composite profile is then cut to the desired length. The standard shape is cylindrical but other profiles may be obtained. Once the composite part is made and cut, threaded sheaths are crimped on each end.
When fixed on a surface, such extensometer cannot operate in a compression mode because of the buckling effect. Therefore, the extensometer is frequently pre-strained (to typ. 0.3 % )sothat it always works under a traction mode, even ifthe structure actually operates under compression.
Each extensometer needs to be compensated by a temperature sensor of similar constitution. Each optical line incorporates FBG extensometers of the same kind (LGE or SGE) and one FBG temperature sensor. The two temperature FBG sensors are bonded onto the same steel bar, as those used for making SGEs. In the same way, the two temperature FBG sensors are pultruded in the same material as those used for LGEs. The temperature compensation procedure is automatically performed by the software by subtracting the wavelength shifts of each extensometer to its associated temperature sensor spectral shift (auto-compensation principle). If needed, strain information may be converted into absolute displacements by multiplying the strain value by the gage length ofthe appropriate sensor.
Fig. 3 : Short-Gage Extensometer (SGE) Fig. 4 : Long-Gage Extensometer (LGE)
3. INSTALLATION OF FBG EXTENSOMETERS IN THE SAINT-JEAN BRIDGE
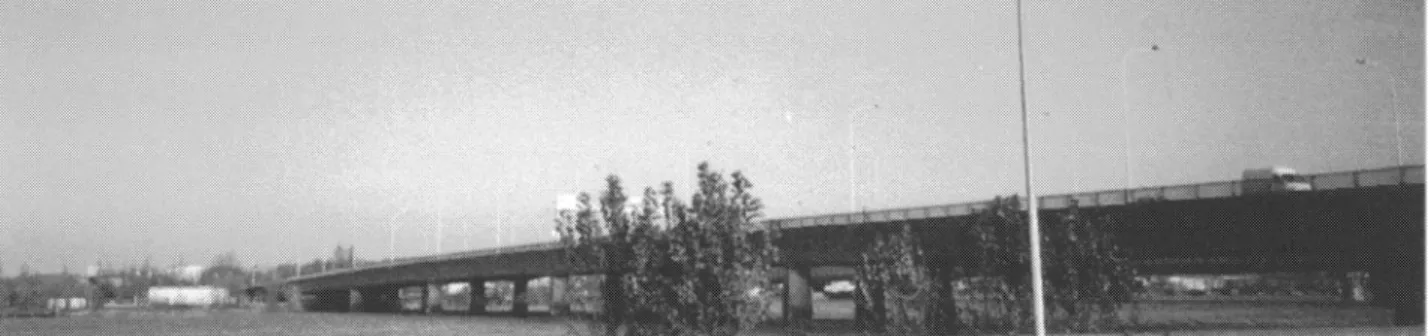
The Saint-Jean bridge is located in the city of Bordeaux, France (fig. 5). This pre-stressed box-girder bridge has been built in 1964. Each box is 3-meter long. The bridge is 474-meter long and each span (between successive piers) is 70-meter long. Bearings are inserted between the deck and the support (piers). Their purpose is to damp dynamic effects, ensure load transmission from the deck to the support and give a degree of freedom associated with vertical compression, horizontal shear and bending momentum.
The inside of the bridge consists of three parallel tunnels made of pre-stressed concrete box girders. At the time of its construction, thermal expansion issues were overlooked in the design and several cracks appeared some years later due to thermal overstress. Moreover, the geographical situation of Bordeaux makes the four bridges ofthe town the Gordian knot of all transportation issues. Since the traffic is expected to grow as the city gains more and more economical importance, Regional Authorities requested to assess the structural integrity of this bridge and to check its thermo-mechanical behavior.
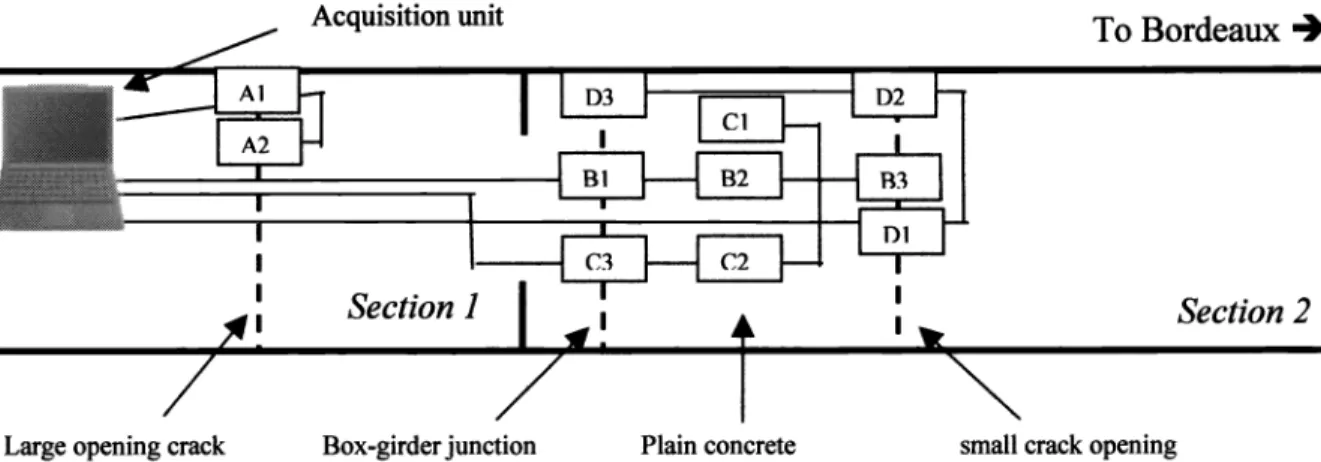
The sensors and acquisition unit were implemented into the central tunnel of the bridge, in the first and second section (fig. 6). Eleven FBG extensometers were fixed onto the concrete surface, inside the central tunnel. Six SGEs and five LGEs were connected to four optical lines running on sections 1 and 2, according to the installation scheme (see fig. 7). LGEs are connected on lines A (A1, A2) and B (B1, B2 and B3). SGEs are connected on lines C (C1, C2 and C3) andD (D1, D2, D3). The extensometers A1, D2 and D3 are horizontally fixed onto the wall (1.5 m high) whereas all other extensometers are fixed onto the floor parallel to the bridge. The LGEs are primarily fixed onto large crack openings whereas SGEs are mostly fixed onto box-girder junctions (with no apparent crack) or onto plain concrete. However, the sensor type were deliberately mixed in order to compare their behavior in a similar environment. Sensors A1 and A2 follow a large vertical crack opening. Sensors B1, C3 and D3 are fixed onto a closed junction (not expected to open). The
sensors B2, C1 and C2 are fixed onto plain concrete. Finally, sensors B3, D1 and D2 are fixed on a small crack opening.
Fig. 6 : Access to the bridge and installation of the optical instrumentation
To Bordeaux
Fig. 5: The Saint-Jean Bridge (Bordeaux, France)
Acquisition Uflit
To Bordeaux 4
Fig. 7 : Installation scheme ofthe extensometers inside the central tunnel ofthe Saint-Jean bridge (seen from top)
Each line incorporates a temperature sensor to allow the temperature compensation of each extensometer response (fig. 8). Temperature gradients between neighboring sensors are very unlikely to occur because the sensors are protected from outside weather perturbations (the tunnel is closed). Nevertheless, for each line, all the extensometers were grouped within a restricted area to render this thermal compensation the most effective.
For the purpose of this validation, the data obtained by the FBG extensometers were compared to the strain data obtained from classical electrical sensors that were previously installed nearby (fig. 9). Two types of classical sensors were used, i.e. strain gages and Linear-Variable Differential Transformers (LVDT).
Fig. 9: Sensors fixed onto the Box-girder junction on section 1 (strain gages, LVDT, Optical LGE). The PC is protected into a box fixed on the floor.
11
Large opening crack Box-girder junction Plain concrete small crack opening
Section 2
4. STANDARDIZED LOADING OF THE BRiDGE
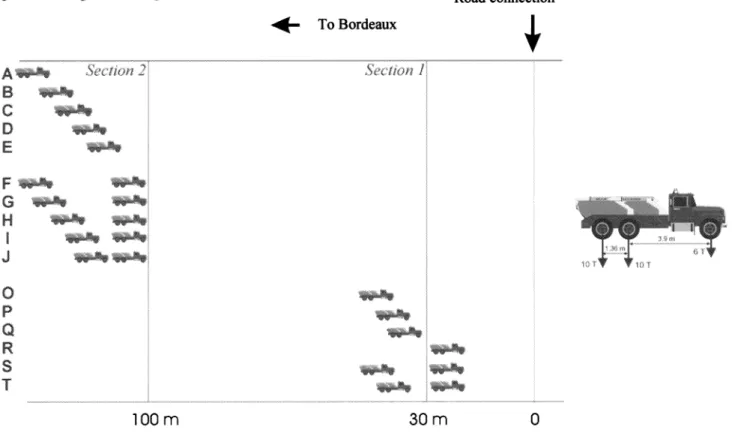
A standardized loading of the bridge has been performed on October 29, 2001 with the assistance of the Bordeaux Authority (Communauté Urbaine de Bordeaux), in the purpose of correlating its mechanical reaction to the loading conditions. The bridge had been closed to traffic and two series of4 trucks each moved along the bridge from Bordeaux towards section 1 of the bridge, according to the following protocol (fig. 10). Each truck weighted 26 tons and the global loading ofthe bridge was about 200 tons. Road connection
To Bordeaux
4
s
ffØ 2
'
( II(J,I
i..:W
C DE
F
G w
HwJ
1wJ
J
. :::
0
w,
p
c.. R Sw
T
lOOm
30m
0Fig.10 : Truck movements and associated labels A to J and 0 to T
(each figure symbolizes a series of4 trucks similar to that described above)
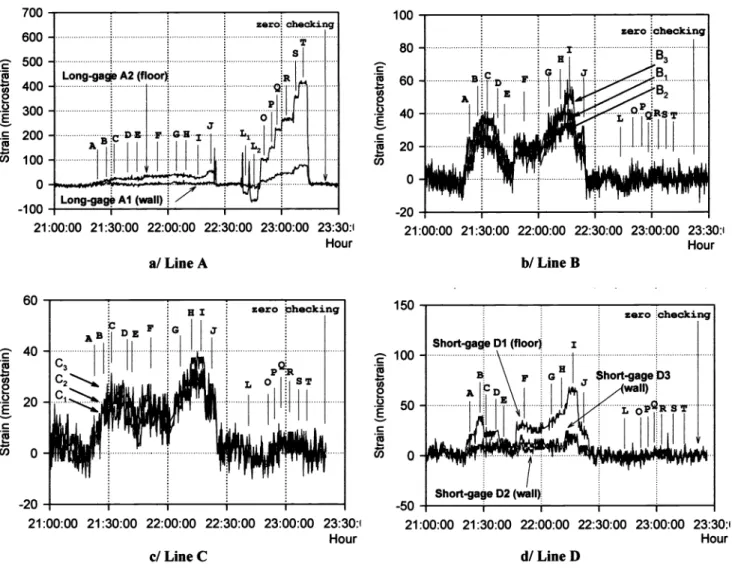
The strain data show the evolution of the thermo-mechanical behavior of the structure (thermal expansion of the concrete material) on which loading-induced strain is superimposed. The thermo-mechanical baseline has been sorted out by first making a second-order polynomial fit of the strain data before and after the loading test (respectively 21 h 00 and 24 h 00). Then, the mechanical-induced strain was obtained by subtracting the original data to its interpolated baseline and fig. 1 1 shows the results for each lines (A to D). Each line measurement takes 2 seconds. Since 4 lines were connected to the acquisition unit and time-switched, the sampling period was 1 measurement/8 sec (i.e. 0.125 Hz). Two rounds of measurement were done. The first round (cases A to J) corresponds to the loading of section 2. The second round (cases 0 to T) corresponds to the loading of section 1. Cases L1 and L2 correspond respectively to the exit of the first and second series of trucks outside section 1. The exit of the trucks acted as a counterbalance to the weight of the first section of the bridge and thus induced compressive strains (L1 and L2). The most important strain level is observed on line A, as expected. A ratio of about 4 to 5 is obtained between the displacement of the floor to that of the wall indicating a bending ofthe box with respect to the top.
The strain measurement accuracy is about 3microstrain after one-minute average. This strain accuracy corresponds to an crack-opening accuracy of about 1rim. This latter parameter may be reduced by averaging over a longer period of
time (hour). As the trucks advanced along the bridge, the strain was first observed on lines B, C and D (round #1). Then, once the trucks have passed the pier and got on section 1 (round #2), no reliable strain information is observed on these lines. The strain observed on line A increased in step as the trucks came closer to the measurement point. A very good correlation is observed between the sensors' responses.
-20 -50
-21:00:00 21:30:00 22:00:00 22:30:00 23:00:00 23:30: 21:00:00 21:30:00 22:00:00 22:30:00 23:00:00 23:3O:
Hour Hour
ci LineC d/ Line D
Fig. 11 : Loading-induced strain during the standardized loading test (corrected from thermo-mechanical influence) observed for each line. a/ line A (FBG-LGE); b/ line B (FBG-LGE), c/ line C (FBG-SGE), d/ line D (FBG-SGE)
5. ONE-YEAR FIELD TEST
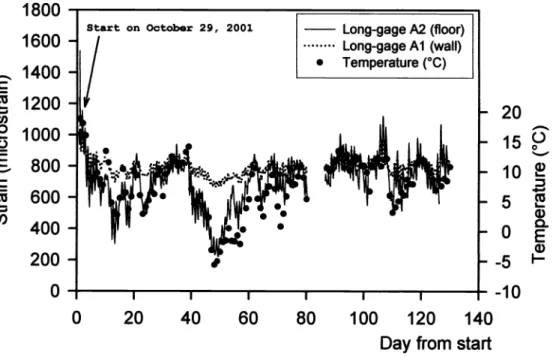
The opto-electronic equipment has been operating for the first four months and then was stopped during the summer 2002. The measurement went on during autumn and winter 2002 but results are still not compiled. Each line measurement takes 15 minutes (averaged over 450datapoints). The sampling period was 1 measurement/hour. The
strain data exhibit amplitude variations in strain due to day-night temperature variations (about 150 microstrain for sensor A2). We observe a very good correlation between the temperature evolution and the thermal-apparent strain of the structure. It is then possible to infer a strain-to-temperature coefficient for each sensor location, which may be incorporated into the calibration procedure to sort out thermal-apparent strains to pure mechanical-induced strains (for instance, this coefficient is about 35microstrain/°Cfor sensor A2, which is equivalent to a crack opening of 14 .tmI°C). The strain data obtained with the optical extensometers were converted into absolute displacements to compare to LVDT data. A very good agreement is obtained between the two series of data.
zero checking 700 600 500 400 300 200
100
0
T S Long-gage A2 (floor) R?'
J
..
BCDEF
GH1.... i.JiLLLLi.LLL
Long-gage Al (wall) . Z!
• C I! (I) 00
E C Co C I! (I) 0 0 E C Cl) 22:00:00 22:30:00 23:00:00 a! Line A 23:30: Hour -100 21:00:00 21:30:00 60 40 20 0 I 00 80 C! 60
C') 2.
40 CI! 20
U) 0 -20 21:00:00 21:30:00 22:00:00 22:30:00 23:00:00 23:30: Hour bI LineB I 50E
100 Cl)20
icw o
0
10
5
a) 0. a)-10
1800 1600 1400C
1200 1000-
800
C
•
600 400 2000
020
40
60 80 100 120 140Day from start
Fig. 12: Strain andtemperaturedata gathered during field test on line A
1050 1000
950
900 850 800 750 70025
20
15
lOg.
5
0-5
-10
Day
from startFig.13: Strain and temperature data gathered during field test on line B (all extensometers are fixed onto the floor)
C Co
I-Cl)2
C.) C C,) C CO Cl,0
I-C, C C')25
,f' C)
152
lu —
CO5w
0.
OE
G)-;
I—-10
0
20
40
60
80
100
120
140
1000900
800
700
600
500
Day from start
Fig.14: Strain and temperature data gathered during field test on line C (all extensometers are fixed onto the floor)
1100
1000
900
0
20
-700
152
IA
Iv —
600
-
w500
-10
0
20
40
60
80
100
120
Day from
Fig.15: Strain and temperature data gathered during field test on line D
140
start
6. CONCLUSION
The CEA-List has achieved a non-exclusive technological transfer of its Fiber Bragg Grating Sensing technology for civil engineering applications to Hydrolog (French SME), supported by the European Community and the French Ministry of industry. This technical transfer has been completed by a field test whose purpose was to check the reliability and user-friendliness of this instrumentation under representative civil engineering conditions, and complete the training/knowledge ofcivil engineers who are still not accustomed to this new technology.
This field test has been setup in the Saint-Jean bridge in Bordeaux, France, under the assistance of the Bordeaux Authority (Communauté Urbaine de Bordeaux). It consisted in a standardized loading ofthe bridge and a one-year real-time acquisition of its thermo-mechanical behavior. Eleven FBG Short-Gage and Long-Gage Extensometers and four temperature sensors had been fixed onto the wall and onto the floor inside the first and second sections of the central tunnel of this bridge. All the opto-electronic instrumentation, assembled in an industrial PC, had been kept protected inside the tunnel for real-time data acquisition over a one-year period of time (only four months are displayed in this paper). The strain information was automatically corrected from temperature influence. A classical instrumentation has been installed for comparison (LVDTs and strain gauges) that exhibited correlated results.
This field test was two-fold. At first, it consisted in a standardized loading of the bridge to analyze its mechanical behavior. Then, the instrumentation was left in the bridge tunnel to complete a one-year real-time acquisition of its thermo-mechanical behavior, taking into account the winter-summer cycle.
The thermo-mechanical behavior of the bridge structure was clearly detailed in the strain data with an improved accuracy due to averaging (accuracy microstrain). We showed a very good correlation between the temperature and the long-term strain averaged over transportation loading. That enabled to calibrate a thermo-mechanical coefficient that rules the thermal expansion of the structure at a given location into the structure and to subtract this long-term effect to the (short-term) traffic loading. Moreover, the rough measurement (not averaged) gave an estimation ofthe traffic. This field-test demonstrated that such Fiber Optic Sensor System is able to provide diagnostics about a structure integrity and would give engineers insight about the thermo-mechanical behavior. In the Health Monitoring concept, the sensors may be left fixed onto the structures of interest while the same instrumentation may be used from site to site. Compared to WIM for instance (that needs a permanent installation) the cost figure of this approach is optimized since the relative cost of the read-out system (industrial PC) is roughly 2/3 of the global instrumentation (the remaining 1/3 corresponding to sensors and optical cables).
Many improvements are now being studied, taking into account the experience feedback acquired during this field-test. As a first remark, the sampling frequency (0.5 Hz) will be increased in future versions as it is actually limited by the performance ofthe industrial PCs used. We have demonstrated sampling frequencies as high as 50 Hz/line (12.5 Hz for 4 lines) which would actually enable to perform WIM or VC/Id applications. As a second remark, we found that connecting aspects were also important as FC-APC connectors were not dealt with so easily by unskilled personnel, and thus 'push-pull' connectors are now preferred.
Many other civil engineering applications are now foreseen, especially large structures which involve a great number of sensors. For instance, this system may be of great help in monitoring historical monuments, dams, large buildings, power plants, tunnels, etc. FBG-based sensing techniques are particularly attractive for remote, long-gage multi-point measurements of a large panel of parameters with the same logging unit and fibers are well-suited for insertion into cables (cable-stayed bridges), concrete reinforcement tendons or composite panels used for repair of weakened structures (CFRP).
ACKNOWLEDGMENTS
This industrial transfer of the optoelectronic data acquisition system together with two extensometer types to Hydrolog has been supported by the European Community, the French Aquitaine Region, and the French Ministry of Industry (ANVAR). The field test on the Saint-Jean bridge in Bordeaux has been organized by the Bordeaux Authority (Communauté Urbaine de Bordeaux) and we would like to thank J. Vilaldach (CUB) as well as Y.H. Rimbaud (DRE Aquitaine) for their technical support and their help.
REFERENCES
1 .P.Ferdinand et a!. ,"Applicationsof Optical Fibre Sensors for the Nuclear Power Industry", Handbook of Optical Fibre
Sensing Technology, 26, J. M. Lopez-Higuera Ed., Wiley & Sons, pp. 543-567, 2002.
2. D. Inaudi, "Photonic Sensing technology in Civil Engineering Applications", Handbook of Optical Fibre Sensing
Technology, 25, J. M. Lopez-Higuera Ed., Wiley & Sons, pp. 517-542.
3. J. EchevarrIa, C. Jáuregui, A. Quintela, M. A. Rodriguez, R. GarcIa, G. Gutiérrez and J. M. López-Higuera, "Concrete Beam Curing Process and Flexural Test With Fiber Bragg Grating based Transducers", Smart Structures and Materials
(SanDiego, CA), SPIE 4694, 2002, pp. 271-276.
4. W. Steiner, "Strengthening of concrete structures with carbon fibre laminates", SAMPE Conference (Basel,
Switzerland), 1998, pp.685-695.
5. J. Seim, E. Udd, W. Schulz, H. M. Laylor, "Health Monitoring of an Oregon historical bridge with Fiber Grating Strain Sensors", Smart Systemsfor Bridges, Structures, and Highways (Newport Beach, CA), SPIE 3671, 1999, pp. 128-134.
6. C. Baldwin, T. Salter, J. Niemczuk, P. Chen and J. Kiddy, "Structural Monitoring of Composite Marine Piles using
Multiplexed Fiber Bragg Grating Sensors : In-field Applications", Smart Systemsfor Bridges, Structures, and Highways, (SanDiego, CA), SPIE 4696, 2002, pp. 82-91.
7.P. L. Fuhr, T. P. Ambrose, D. R. Huston and A. P. McPadden, "Fiber Optic Corrosion Sensing for bridges and Roadway
surfaces", Smart Structures andMaterials (San Diego, CA), SPIE 2446, 1995, pp. 2-8.
8. M. Kunzler, R. Edgar, E. Udd, T. Taylor, W. Schulz, W. Kunzler and S. Soltesz, "Fiber Grating Traffic Monitoring
Systems", Smart Systemsfor Bridges, Structures, andHighways (San Diego, CA), SPIE 4696, 2002, pp. 238-243. 9. C. I. Merzbacher, A. D. Kersey and E.J. Friebele, "Fiber Optic Sensors in Concrete Structures : a Review", Smart Mater.
Sfruct., 5, 1996, pp. 196-208.
10. R. M. Measures, T. Alavie, R. Maaskant, S. Huang and M. LeBlanc, "Bragg Grating Fiber Optic Sensing for Bridges and
Other Structures", 2nd Eur. Conf on Smart Structures andMaterials (Glasgow, Scotland), 1994, pp. 162-167.
1 1 .R.Maaskant, T. Alavie, R.M. Measures, M. Ohn, S. Karr, D. Gleenie, C. Wade, G. Tadros and S. Rizkalla, "Fiber Optic
Bragg Grating Sensor Network installed in a concrete road bridge", Smart Structures and Materials (Orlando, FL), SPIE 2191,1994, pp.457-465.
12. R. Brönnimann, Ph. M. Nellen and U. Sennhauser, "Application and Reliability ofa Fiber Optical Surveillance System for a stay cable bridge", Smart Mater. Struct., 7, 1998, pp. 229-236.
13. R. Brönnimann, Ph. M. Nellen, P. Anderegg and U. Sennhauser, "Applications of Optical Fiber Sensors on the Power
Dam ofLuzzone", International Conference on Applied OpticalMetrology, SPIE 3407, 1998, pp. 386-391.
14. S. T. Vobra, M. D. Todd, G. A. Johnson, C. C. Chang and B. A. Danver, "Fiber Bragg Grating Sensor System for Civil
Structure Monitoring : Applications and Field Tests", J3 International Conference on Optical Fiber Sensor (Kyongju,
Korea), SPIE 3746,1999, pp.32-37.
15. M. Davis, A. Kersey, T. Berkoff, R. T. Jones, R. L. Idriss, M. Kodinduma, "Dynamic strain monitoring of an in-use
Interstate bridge using Fibre Bragg Grating sensors", Smart Structures and Materials, SPIE 3043, 1997, pp. 87-95. 16. J. Meissner, W. Nowak, V. Slowik and T. Klink, "Strain Monitoring at a Prestressed Concrete Bridge", 12" International
Conference on Optical Fiber Sensors (Williamsburg, VA), 16, OSA Technical Digest Series (Optical Society of America, Washington DC, 1997), pp.408-411
17. M. P. Whelan, D. Albrecht and A. Capsoni, "Remote Structural Monitoring of the Cathedral of Como using an Optical Fibre Bragg Sensor System", Smart Structures and Materials (San Diego, CA), SPIE 4694, 2002, pp. 242-252.
18. F. Bossens, A. Preumont, M. Aupérin, C. Dumoulin, G. Magonette, F. Marazzi, "Active Control in Civil Engineering: From Conception To Full Scale Applications", IMAC XJX : A Conference on Structural Dynamics, SPIE 4359, n° 1, 2001, pp. 524-530
19. P. Ferdinand, S. Magne, V. Dewynter-Marty, Ch. Martinez, S. Rougeault and M. Bugaud, "Applications of Fiber Bragg
Grating Sensors in Europe", 12th International Conftrence on Optical Fiber Sensors (Williamsburg, VA), 16, OSA
TechnicalDigest Series (OpticalSociety ofAmerica, Washington DC, 1997), pp. 14-19.
20. P. Ferdinand, S. Rougeault, "Optical Fiber Bragg Grating Inclinometry for Smart Civil Engineering and Public Works", 14thinternationalConference on Optical Fiber Sensors (Venice, Italy), SPIE 4185, 2000,pp.13-16
21. P. Ferdinand, S. Magne, V. Dewynter-Marty, S. Rougeault and L. Maurin, "Applications of Fiber Bragg Grating Sensors