HAL Id: hal-02945280
https://hal.archives-ouvertes.fr/hal-02945280
Submitted on 28 Sep 2020HAL is a multi-disciplinary open access archive for the deposit and dissemination of sci-entific research documents, whether they are pub-lished or not. The documents may come from teaching and research institutions in France or abroad, or from public or private research centers.
L’archive ouverte pluridisciplinaire HAL, est destinée au dépôt et à la diffusion de documents scientifiques de niveau recherche, publiés ou non, émanant des établissements d’enseignement et de recherche français ou étrangers, des laboratoires publics ou privés.
High-Resolution Shortwave Infrared Imaging of Vascular
Disorders Using Gold Nanoclusters
Zhixi Yu, Benjamin Musnier, Maxime Henry, K David Wegner, Benoit
Chovelon, Agnes Desroches-Castan, Arnold Fertin, Ute Resch-Genger, Sabine
Bailly, Jean-Luc Coll, et al.
To cite this version:
Zhixi Yu, Benjamin Musnier, Maxime Henry, K David Wegner, Benoit Chovelon, et al.. High-Resolution Shortwave Infrared Imaging of Vascular Disorders Using Gold Nanoclusters. ACS Nano, American Chemical Society, 2020, �10.1021/acsnano.0c01174�. �hal-02945280�
1
High-resolution of Vascular Disorders by Shortwave Infrared Imaging
using Gold Nanoclusters
Zhixi Yu1, Benjamin Musnier1, Maxime Henry1, K. David Wegner2, Benoit Chovelon3, Agnès Desroches-Castan4, Arnold Fertin5, Ute Resch-Genger2, Sabine Bailly4, Jean-luc Coll1*, Yves Usson5, Véronique Josserand1, Xavier Le Guével1*
1Cancer Targets & Experimental Therapeutics, Institute for Advanced Biosciences (IAB), University of Grenoble Alpes (UGA)/ INSERM-U1209 / CNRS-UMR 5309- Grenoble, France
2BAM Federal Institute for Materials Research and Testing, Richard-Willstaetter-Str. 11, 12489 Berlin, Germany.
3Institut de Biologie et Pathologie, CHU de Grenoble-Alpes, France
4Biology of Cancer and Infection Laboratory, University Grenoble Alpes, Inserm, CEA,38000 Grenoble, France
5TIMC-IMAG, University of Grenoble Alpes, CNRS-UMR 5525, Grenoble, France
ABSTRACT:
We synthesized a generation of water-soluble, atomically precise goldnanoclusters (Au NCs) with anisotropic surface containing short dithiol pegylated chain.
These Au NCs exhibit a high brightness (QY∼6%) in the shortwave infrared (SWIR) spectrum with a detection above 1250nm and showed a slow elimination from blood with a
weak accumulation in organs. We also developed a non-invasive, whole-body vascular
imaging system in the SWIR window with high-resolution, benefiting from a series of Monte
Carlo image processing of the images. The imaging process enabled to improve contrast by
one order of magnitude and enhance by 54% the spatial resolution. After systemic
administration of these nanoprobes in mice, we could quantify vessel complexity in depth
(>4mm). Using Bmp9 deficient mice, we can detect very subtle vascular disorders
non-invasively. The combination of these anisotropic surface charged gold nanoclusters plus an
improved SWIR imaging device allows then a precise mapping at high resolution and in depth
2
KEYWORDS: shortwave infrared fluorescence, gold nanoclusters, vascular disorder, monte
carlo restoration imaging processing.
In vivo infrared imaging has experienced major breakthroughs over the past few years with
potential applications in cancer and cardio-vascular diagnostics1. Hongjie Dai’s team was
among the first who developed emitters for the shortwave infrared region (SWIR, 900-1700
nm), also called NIR II. Due to the weak photon absorption, the low autofluorescence, and
reduced scattering by tissues at these wavelengths compared to NIR I (700-900 nm) and the
visible region, they were able to reach a high spatial and temporal resolution through a few
millimeters of tissue sufficient to image brain blood circulation through the intact skull2 and
in ischemic femoral arteries3. Using SWIR imaging, Bawendi et al. recently evaluated the
metabolic turnover rates of lipoproteins in several organs in real-time as well as the heartbeat
and breathing rates in awake and unrestrained animals4. Based on these data, they generated a
detailed three-dimensional quantitative flow map of the mouse brain vasculature, which
demonstrates the high potential of SWIR-imaging applications.
However, only few SWIR emitting contrast agents are available that possess high
quantum yields (QYs), good biocompatibility and low accumulation in organs. Although in
vivo imaging studies have been performed using SWIR-emitting quantum dots (QDs)4, the downshifting emission of lanthanide-based nanomaterials5, and new organic donor–acceptor–
donor (D-A-D) type organic fluorophores6, these materials still have some drawbacks. This
includes for example, their possible toxicity related to the toxicity of their constituents in the
case of most QDs and low QYs < 1 % for the organic molecules. A relatively new class of
NIR II emitters are ultra-small gold nanoclusters (Au NCs)7. Recent studies with Au NCs
stabilized by zwitterionic sulfobetaine ligands (AuZw) showing a reasonably high QY (3.8%),
enabled to detect blood vessels using photoluminescence (PL) and revealed efficient renal
3
In this work, we developed water-soluble Au NCs stabilized by co-ligands with emission in
the SWIR, which exhibit a high brightness, a high photostability, long blood circulation times,
and a low toxicity. We demonstrate the ability of this promising new contrast agent to image
the vascular network of mice with vascular disorders in the second window of the SWIR
spectrum (1250-1700 nm) with one-order magnitude contrast enhancement and 54% increase
in spatial resolution enabled by the use of Monte Carlo image processing. The non-invasive
imaging processing, segmentation and analyzes were validated in transgenic mice inactivated
for the Growth factor Bmp9 that were previously described with vascular disorders9, 10 based
on the measurement of the fractal dimension of vessels.
RESULTS & DISCUSSION
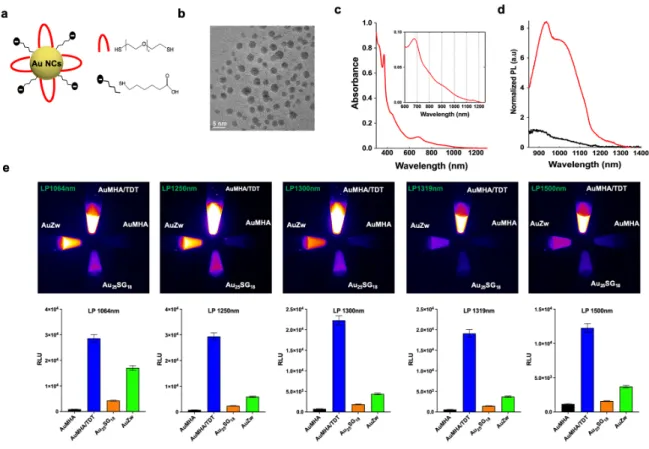
The here developed Au NCs, named AuMHA/TDT, were prepared by a wet chemistry route
using mercaptohexanoic acid (MHA) and tetra(ethyleneglycol) dithiol (TDT) as co-ligands
with the molar ratio Au: ligand =1:4 and MHA: TDT= 1:3 (Figure 1a, see experimental
details). Mass spectrometry revealed a high monodispersity of an 11 kDa species (Figure S1).
The average size of the semi-crystalline metal core was determined by high resolution
transmission electron microscopy (HR-TEM) to 2.1±0.6 nm (Figures 1b, S2) and the hydrodynamic diameter of AuMHA/TDT in water to 1.90±0.02 nm as derived from DOSY-NMR (Figure S3). The water-soluble AuMHA/TDT NCs have a negative surface charge at
pH 7 of around ζ= -20 mV, which renders them very stable over the long period of time. The addition of the short dithiol molecules TDT on the Au NC surface results in a striking
modification of the optical properties, as recently reported by us for another type of
anisotropic Au NCs prepared with hexa(ethylene glycol) dithiol as co-ligand11. Indeed, the
incorporation of TDT leads to the presence of new NIR absorbance features at 800 nm, 910
4
the PL signal in the SWIR region with a 9-fold increase of PL intensity in water accompanied
by PL emission at longer wavelengths (Figure 1d). The spectral position and shape of the
emission is independent of the excitation wavelength (Figure S4) and the average lifetime
derived from the multiexponential decay detected at λem.= 930±20 nm is <τint.>= 449.0 ns (Figure S5). We compared the PL of AuMHA/TDT to the emission of other water-soluble Au
NCs synthesized in our laboratories, i.e., AuMHA11, AuZw12, and Au25SG1813 in different
spectral windows in the SWIR. The images in Figure 1e show an up to 12-fold more intense
signal for AuMHA/TDT using long pass filters above 1250 nm confirming the superior
brightness of our new Au NCs in water as compared to the existing SWIR-emissive ones. We
estimated then a quantum yield at ∼6%, in the same range as Au NCs stabilized by both ligands mercaptohexanoic acid (MHA) and dithiol hexa(ethyleneglycol) that we previously
prepared11. This QY is higher than the others Au NCs already in the literature for Au25SG18
(0.67%)14, AuMHA (0.9%)11, and AuZw (3.8%)8. The PL features of AuMHA/TDT remain
unchanged in water and in the presence of 10% serum (Figure S6). Illumination studies in
water, with NaCl (0.9%), and in the presence of bovine serum albumin (BSA; 50 mg/mL) at
different incubation times demonstrate the high photostability of these emitters (Figure S7).
Surprisingly, in the presence of blood, the PL increases over time. A similar behavior has also
been reported for ICG15 and is tentatively ascribed to specific interactions with
proteins/complement components or uptake by red blood cells.
Cytotoxicity experiments (Figure S8) have been conducted using MTT assays with a human
embryonic cell line (HEK 293) and human (A549) or murine (4T1) cancer cell lines in the
presence of increasing concentrations of AuMHA/TDT up to 45 µM (∼500 µg/mL). The absence of significant cell death suggests the low toxicity of these contrast agents and allowed
5
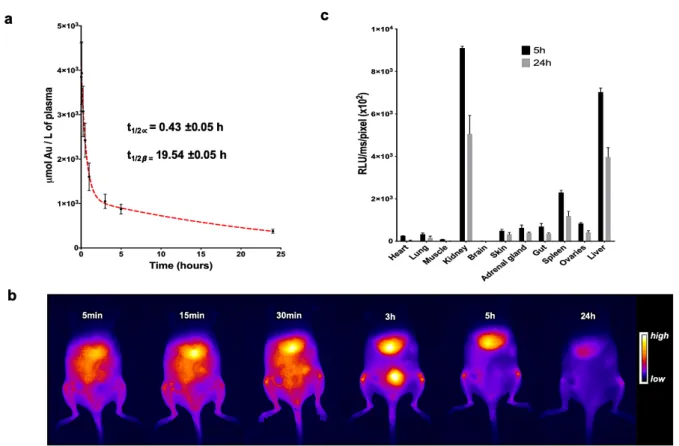
The half-life of Au NCs in mice is highly dependent on the hydrodynamic diameter of the
NCs12, 16 and their density17. For instance, small Au25SG18 NCs show an extremely fast
clearance with a half-life of less than 2 min as compared to 6 min for the larger AuZw 12. By
elemental analysis (ICP-MS) after AuMHA/TDT administration, we measured a half-life of
t1/2α= 0.43±0.05 h and a half-elimination of t1/2β = 19.54 ±0.05 h in nude mice (Figure 2a).
These two values are more than 5 times longer than those obtained with the previous applied
Au NCs. This prolonged blood circulation time enables the detection of SWIR signals from
AuMHA/TDT in the blood vessels in mice up to 30 minutes after injection.
In vivo fluorescence measurements also show the renal clearance of these ultra-small particles
with signal in the bladder at 3h post injection and with an elimination from the liver observed
between 5h to 24h, respectively (Figure 2b).
One of the major advantages of the SWIR spectral window is the low autofluorescence, which
enables to reduce the amount of the contrast agent necessary to achieve a high signal to noise
ratio. In our case, we could detect AuMHA/TDT NCs in in vitro samples at concentrations as
low as 80 nM with a signal-to-noise ratio of 3.4 (Figure S9). This enabled us to follow the
biodistribution of AuMHA/TDT in mice by fluorescence imaging after 5 h or 24 h
post-injection.
Results from ex vivo fluorescence measurements in different organs (Figure 2c), confirmed
by ICP-MS measurements (Figure S10), suggest a renal elimination of the Au NCs and an
accumulation of the Au NCs mainly in the kidney, the liver, and the spleen with PL signal
dropping by 40% between 5 h and 24 h, which suggests an elimination or a metabolization of
AuMHA/TDT over time.
Non-invasive real-time SWIR imaging was performed after intravenous injection of
AuMHA/TDT (200 µL; 360 µM) in vivo in 129/Ola mice using a 830 nm laser as light excitation source (50 mW/cm2) and a long-pass filter LP1250 nm in the emission channel.
6
Under these conditions, the AuMHA/TDT NCs provided a clear and outstanding visualization
of the vascular network as shown in movie 1.
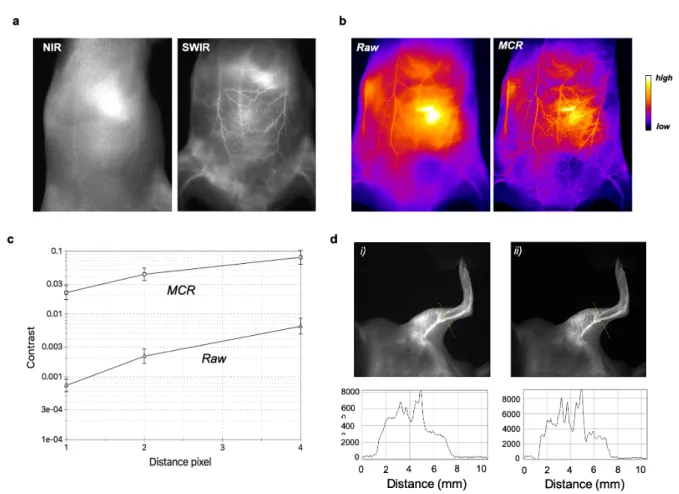
As expected, there is a clear improvement of the spatial resolution in the SWIR is strongly
improved as compared to the NIR I (Figure 3a). We performed post-image processing with
the Monte Carlo Constrained Restoration (MCR) method to further improve the spatial
resolution in depth and to overcome the scattering from the skin and the tissues. Image
processing greatly enhances the spatial resolution as seen in Figure 3b. Comparing the
quality of the images before and after MCR using a quantitative measure of the contrast
(Figure 3c) demonstrates an improvement in contrast by one order of magnitude, highlighting
the potential of this restoration. The determination of the transverse section of blood vessels
from the SWIR images of a mouse leg depicted in Figure 3d highlights the excellent
resolution after MCR processing and the ability to obtain highly detailed in vivo imaging of
the whole-body blood vasculature and of the blood brain vasculature (Figure S11).
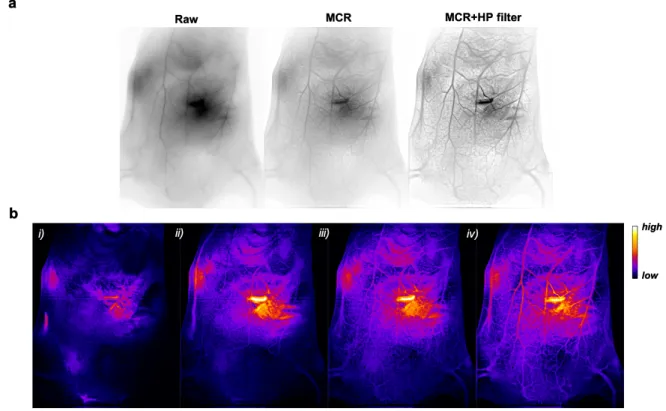
Image processing was then pushed one step further using a high-pass filter to reduce
scattering deeper under the skin. Restorations of the first movie by MCR plus the high pass
filter underline the striking improvement of the resolution (movie 2, Figure S12) allowing the
visualization of the vascular network at more than 4 mm penetration depth (Figure 4a). We
could also easily track the contrast agent (SWIR-emitting AuMHA/TDT) in mice especially
in the first seconds after injection (movie 3, Figure 4b).
To demonstrate the potential of combining SWIR imaging, image restoration, and image
analysis for biomedical applications, non-invasive vascular imaging was performed in mice
previously described with vascular disorders due to the inactivation of the gene encoding
Bmp9 9, 10 and compared to wild-type mice (WT). Bmp9 has been identified as a high affinity ligand for the endothelial specific receptor ALK1 (activin receptor-like kinase 1), that is
7
have recently shown that Bmp9 deletion in the 129/Ola genetic background results in dilated
liver vessels that ultimately lead to liver fibrosis10.
Bmp9-KO mice and WT mice were placed in supine position and were injected intravenously
with AuMHA/TDT for real-time SWIR imaging from t= 0 to t= 15 min. MCR was performed
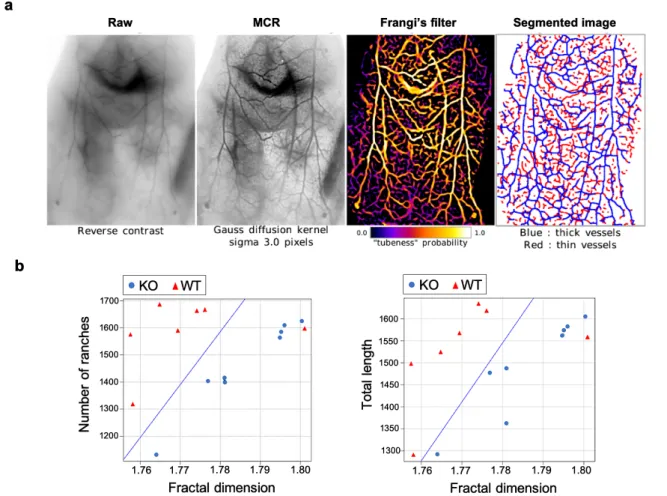
on raw images followed by Frangi’s filtering and segmentation (see methods) as illustrated in
Figure 5a. Then, analyses of the segmentation, which provides blood network mapping were
plotted considering the length of the vessels or the number of vessel “branches” (segments
delimited by forks or crossings) as a function of the fractal dimension (Figure 5b). Fractal
dimensional is referred here as the level of complexity of vessels with a numerical value
between 1 (straight line tube) to 2 (highly swaying vessel in 2-dimensional section). Analyses
show a clear distinction in skin vessels between Bmp9-KO and WT mice considering both
vessel lengths and branches. The significant 4% increase of the fractal dimension for
Bmp9-KO compared to WT mice, which is correlated to the vessel distortion, confirms then the
hypothesis of tortuous vessels due to a defect in vessel maturation10. Thus, this non-invasive
method allowed us for the first time to detect a vascular disorder present in the Bmp9-KO
mice with such a high level of precision.
CONCLUSION
In conclusion, we report here the design of a new bright SWIR-emitting contrast agent with
prolonged circulation and efficient elimination that enables the visualization of the vascular
network with enhanced-spatial resolution in depth using a series of MCR processing steps.
Both image processing and segmentation analyses enabled to distinguish non-invasively
vascular disorders in mice with good confidence. To the best of our knowledge, this is the
first time that such results were obtained non-invasively in depth and in real time using
8
combined research on new contrast agents and on image processing and analyses to improve
the sensitivity of SWIR imaging for advanced biomedical applications.
MATERIALS & METHODS
Matrix Assisted Laser Desorption Ionisation - Time of Flight (MALDI-TOF). Au NCs
sample was diluted in the matrix CHCA (Alpha-Cyano-4-Hydroxy-3-Iodocinnamic Acid)
with 0.1% trifluoroacetic acid (TFA) in a mixture water/acetonitrile 50/50 v/v. Measurements
were performed in positive linear mode on an Autoflex speed instrument from Brucker.
Nuclear magnetic resonance spectroscopy (NMR) experiments were carried out at 298 K
with a Bruker AVANCE III 500 MHz spectrometer equipped with a cryo-probe Prodigy. For
each sample the concentration was ~2 mM in D2O and pH 7. Diffusion ordered NMR
spectroscopy (DOSY) experiments were run using the standard “ledbpg2s” Bruker sequence
with linear gradient stepped between 2% and 98%. 32 scans were recorded for each gradient
step. Data processing were performed using the maximum entropy algorithm from Dynamics
Center, a Bruker’s NMR software to obtain the diffusion coefficient D. An average value of D
was used for the hydrodynamic diameter (HD) calculation according to the Stokes-Einstein
equation which assumes that molecules are spherical:
HD = kBT/ 3Dπη
where kB is the Boltzmann constant, T is the temperature, η is the viscosity of the solvent
(ηD2O = 1.232 10-3 Pa.s at 298K). Standard 1D and 2D (NOESY, COSY, TOCSY and
HSQC) spectra were recorded using standard presaturation on the water signal.
Zeta potential of Au NCs dispersed in water or in PBS buffer with 10% serum were
measured with a Zetasizer from Malvern instruments.
Metal core sizes were determined by high resolution transmission electron microscopy
9
Absorption spectra of diluted AuNC samples were recorded on a UV-vis-NIR
spectrophotometer Cary5000 between 350 and 1700 nm.
Steady-state photoluminescence spectra were measured from 600 – 1750 nm with a
calibrated FSP 920 (Edinburgh Instruments, Edinburgh, United Kingdom) spectrofluorometer
equipped with a nitrogen-cooled PMT R5509P.
Time-resolved measurements were performed in the wavelength region of 930±20 nm using
a FLS 920 (Edinburgh Instruments, Edinburgh, United Kingdom) lifetime spectrofluorometer
equipped with an EPL-510 (Edinburgh Instruments, Edinburgh, United Kingdom) picosecond
pulsed diode laser (excitation wavelength of 510±10 nm; power of 5mW) and a fast PMT
R2658P from Hamamatsu, respectively.
Relative measurements of photoluminescence QYs (Φf,x) were performed using the dye
IR125 dissolved in dimethylsulfoxide (DMSO as reference. The QY of this dye was
previously determined absolutely to Φf,st = 0.23). The relative QY were calculated according to the formula of Demas and Crosby6, see equation below.
Φ!,! = Φ!,!" 𝐹! 𝐹!"∙ 𝑓!"(𝜆!",!") 𝑓!(𝜆!",!) ∙ 𝑛!!(𝜆 !",!) 𝑛!"! (𝜆 !",!")
The subscripts x, st, and ex denote sample, standard, and excitation respectively. f(λexc. ) is the
absorption factor, F the integrated spectral fluorescence photon flux, and n the refractive
index of the solvents used (DMSO for IR125; water for Au NCs).
All spectroscopic measurements were done in a 1 cm quartz cuvettes from Hellma GmbH at
room temperature using air-saturated solutions.
Cytotoxicity experiments. HEK, 4T1, A549 cells were seeded in a 96-well plate (5 000
cells/well in 100 µL of DMEMc) 1 day before the experiment. Au NCs were diluted in
DMEMc to reach the following final concentrations: 25, 100, 250, and 500 µgA/mL and
added to the cells. Cell viability was evaluated 24 h after Au NCs incubations in triplicate. For
10
inducer) were also prepared. In order to verify the absence of artefact due to the absorption of
the Au NCs, wells with only Au NCs in DMEMc were also prepared. Then 20 µL of MTS
reagent (Cell-Titer 96, Promega) was added to each well and further incubated at 37 °C for 2
h. The cell density was then determined by the absorbance at 486 nm using a microplate
spectrophotometer (Fluostar Omega BM6 LABTECH). The percentages of cell viability were
compared using the non-parametric Kruskal-Wallis test. All analyses were performed using
GraphPad Prism software. Statistical significance was defined as p values < 0.001.
NIR I imaging was performed with a NIR 2D-Fluorescence Reflectance Imaging device
(Fluobeam 800®, Fluoptics, France). The excitation is provided by a class 1 expanded laser
source at 780 nm and the irradiance on the imaging field is 10 mW/cm2. The fluorescence
signal is collected by a CCD through a High pass filter with a high transmittance for
wavelength > 830 nm.
SWIR imaging was performed using a Princeton camera 640ST (900-1700 nm) coupled with
a laser excitation source at λ= 830 nm (50 mW/cm2). We use short-pass excitation filter at 1000 nm (Thorlabs) and long-pass filters on the SWIR camera from Semrock (LP1064 nm,
LP1319 nm) and Thorlabs (LP1250 nm, LP1300 nm, LP1500 nm). 25 mm or 50 mm lenses
with 1.4 aperture (Navitar) were used to focus on the samples or mice.
Tubes containing AuNC solution and 10 µL drops of each samples were placed in front of the camera using the 50 mm lens and various long pass filters (LP1064 nm, LP1250 nm, LP 1300
nm, LP1319 nm, LP1500 nm). Analyses were performed using FIJI software.
Mice were imaged after intravenous injection (200 µL of Au NCs at 360 µM) using the 25
mm or 50 mm lenses and LP1250 nm at different exposure times (25ms to 2s). Ex vivo
fluorescence imaging on isolated organs and plasma samples were performed using the 50
11
Inductively coupled plasma-mass spectrometry (ICP-MS) was performed to determine Au
content in organs and in plasma samples at different time point using a Thermo X serie II,
spectrometer (Thermo Electron, Bremen, Germany), which was equipped with an impact bead
spray chamber and a standard nebulizer (1 mL.min-1). For sample preparation, the organs and
plasma samples were weighted before addition of nitric acid (final concentration 1%) and Au
content was determined using an external linear calibration curve (between 10 and 100 µg/L
of Au(III)). Indium was used as the internal standard. Determinations were carried out in
triplicate.
In vivo experiments. For the biodistribution study, six weeks old NMRI female nude mice
(Janvier, France) were anesthetized (air/isoflurane 4% for induction and 1.5% thereafter) and
were injected intravenously via the tail vein with 200 µL of Au NCs at 360 µM. In vivo
SWIR fluorescence imaging was performed before and 5 and 24 hours after injection. Mice
were euthanized at 5 or 24 hours post injection (n = 3 mice per time point) and organs were
harvested for ex vivo fluorescence imaging and ICP measurements.
For the pharmacokinetic study, three other mice were injected and blood samples were
collected before and 1, 5, 15, 30, 60, 180, 300, and 1440 min after injection and were
centrifuged (10 min at 2000 g) to separate plasma. Plasma pharmacokinetic was obtained
from fluorescence imaging and ICP-MS measurements after analyses through a
non-compartment model (GraphPad Prism 7.00, GraphPad Software, La Jolla California USA).
Noninvasive SWIR imaging on mice with vascular disorders. Generation of Bmp9-KO mice in
the 129-P2/Ola-Hsd genetic background (named here for easiness 129/Ola) has been
previously described9, 10. Briefly, Bmp9-KO mice in the C57BL/6 genetic background were
obtained from Dr Se-Jin Lee (Johns Hopkins University, Baltimore, MD) and back-crossed
12
All animals experiments followed the institutional guidelines formulated by the European
Community for the Use of Experimental Animals were approved by ethics committees (CEA
ethic committee for animal breeding and Cometh38 for in vivo imaging) and the French
Ministry of Research and Education. (agreement APAFIS#9436-2017032916298306 and
APAFIS#21916-2019082710189095_v4).
Image restoration of SWIR fluorescent images. SWIR already provides stunning
fluorescent images in vivo, however these images still suffer from light diffusion by the
tissues and the quality of such images can still be improved using image restoration
techniques. We used a Monte Carlo constrained reconstruction (MCR) algorithm based on an
original idea by Frieden et al.19 for restoring binary images then extended to fluorescent
image deconvolution by Colicchio et al.20. This algorithm has the advantage of perfectly
preserving the amount of information of the image (intensity integral) and achieve powerful
contrast and resolution enhancements, while minimizing the ringing artefacts usually
encountered with regular iterative constrained deconvolution. However, Monte Carlo
algorithms are very computer intensive and parallelisation schemes must be used to speed up
calculations.
Assessment of image enhancement. The enhancement of fluorescent images was both
assessed by visual inspection (qualitative assessment) and by using a quantitative
measurement. This was achieved by quantifying the contrast Cd within the image at different
neighbourhoods (distance d = 1, 2 and 4 pixels). The contrast Cd was expressed as the
gradient integral of the image.
𝐶! = 𝛿𝑖 𝛿!𝑥 ! + 𝛿𝑖𝛿 !𝑦 ! !!! ! !!! ! 𝑖 ! with 𝛿𝑖 𝛿!𝑥= 𝑖(𝑥 + 𝑑, 𝑦) − 𝑖(𝑥, 𝑦) ; 𝛿𝑖 𝛿!𝑦= 𝑖(𝑥, 𝑦 + 𝑑) − 𝑖(𝑥, 𝑦); 𝑖 = 𝑖(𝑥, 𝑦) ! ! ! ! 𝑟 ∙ 𝑐
13
where i(x,y) is the intensity at pixel (x,y) ; d is the extent of the partial derivate (in pixels) ;
δi/δdx the partial derivate of intensity along x and δi/δdy the partial derivate of intensity along
y at pixel (x,y); r is the number of rows and c the number of columns in the image.
Vessel detection and analysis. The analysis of the vascularization was performed by image
analysis of the restored images. We used a classical Frangi’s filter that was designed to
enhance tubular structures in a grey level image21. The advantage of Frangi’s filter is a good
immunity to noise that reduces over-detection. Frangi’s filter provides a “tubeness” or
“vesselness” probability image to which a probability threshold can be applied in order to
obtain a binary mask of the vascular network. After, iterative thinning of the binary mask, a
skeleton is obtained and a neighbourhood analysis is applied in order to extract branches,
forks and crossings. The statistical analysis of the various features extracted from the skeleton
such as: the fractal dimension, total length, the number of branches, the number of forks &
crossings; is used to quantify possible differences between mouse strains.
Synthesis of Au NCs. Chemical products were purchased in Sigma-Aldrich (France) and
deionized water was used for all synthesis.
We slightly modified a protocol described by Musnier et al.11 to produce the SWIR-emitted
Au NCs using the initial molar ratio Au:Ligand = 1:4. Briefly 250 µL of HAuCl4.3H20 (20 mM) was added to 4.8 mL water followed by 4 mL of the thiolated ligand mixture
mercaptohexanoic acid (MHA, 5 mM)) / tetra(ethyleneglycol) dithiol (TDT, 5 mM) changing
colour from yellowish to slightly pale cloudy with a volume ratio MHA/TDT= 3mL/1mL.
After 5 min, 250 µL of NaOH (1M) was added dropwise leading to almost colourless sols. After 5 min, 150 µL NaBH4 (20 mM in 0.2 M NaOH) was introduced dropwise under mild stirring and kept under stirring at 350 rpm for 8 hours. Purification of the AuMHA/TDT on 3
14
kDa cut-off filter column (Amicon) were repeated 3 times to stop the reaction and sols were
kept stored in the fridge before characterization.
The Au NCs, Au MHA11, AuZwMe28 and Au25SG1822 were synthesized following the
protocols described in the literature.
ASSOCIATED CONTENTS
Supporting Information contains: physico-chemical and photophysical of Au NCs;
cytotoxicity and additional in vivo experiments in mice are available from American
Chemical Society or from the author.
AUTHOR INFORMATION
Corresponding author
*[email protected] 0000-0002-2453-3552
ACKNOWLEDGEMENTS
XLG would like to thank Ines Häusler for the electron microscopy images (The TEM images
were carried out as part of the DFG core facility project “Berlin Electron Microscopy
Network (Berlin EM Network)”) and Muriel Jourdan for the NMR measurements.
XLG would like to thank Cancéropôle Lyon Auvergne Rhône-Alpes (CLARA), Plan Cancer
(C18038CS) and ARC (R17157CC) for their financial support. KDW acknowledges the
European Union’s Horizon 2020 research and innovation programme under the Marie
Sklodowska-Curie grant agreement No.846764. This research was funded by the Institut
15
l’Energie Atomique et aux Energies Alternatives (CEA, DRF/IRIG), the University Grenoble
Alpes (UGA, BCI), the Fondation pour la Recherche Médicale (FRM).
There is no conflict of interest.
All applicable international, national, and/or institutional guidelines for the care and use of
animals were followed.
Figure 1.a. Scheme of the Au NCs AuMHA/TDT. b. HR-TEM images of AuMHA/TDT. c.
Absorbance spectra of AuMHA/TDT. d. PL spectra of AuMHA (black line) and AuMHA/TDT (red line) (λexc. 830 nm). e. SWIR PL of AuMHA, AuMHA/TDT, Au25SG18, and AuZw (300 µM in water) under NIR excitation (λexc. 830 nm) using LP1064 nm (1 ms), LP1250 nm (5 ms), LP1300 nm (10 ms), LP1319 nm (25 ms), and LP1500 nm (250 ms).
16
Figure 2. Biodistribution and pharmacokinetics of AuMHA/TDT after intravenous injection
in nude mice (360 µM; 200 µL per mouse).
a. In vivo pharmacokinetics determined by ICP-MS measurements on plasma samples taken at
different time points (n=4 mice per time points). b. In vivo pharmacokinetic by fluorescence in mice over 24h (λexc. 830 nm; LP1250 nm). c. Ex vivo 2D fluorescence signal of AuMHA/TDT in isolated organs 5h and 24h post injection (n=3 mice per time points).
17
Figure 3. SWIR imaging of blood vasculature in WT 129/Ola mice after intravenous injection
of AuMHA/TDT a. NIR I (λexc. 780 nm; λem. > 830 nm) and (b) SWIR imaging (LP1250 nm) of mice 15 min after i.v injection of AuMHA/TDT (200 µL at 360 µM in PBS). b. Non-invasive imaging of the mouse ventral area before (Raw) and after MCR processing (false colors). b. Quantification of contrast enhancement per pixel with and without MCR processing on the whole ventral area. c. Images of the left leg of the mouse (i) before and (ii) after MCR processing with their respective intensity profile across a line of interest drawn in the inset images above.
18
Figure 4. a. In vivo SWIR imaging (reverse contrast) of WT 129/Ola mice vasculature before
imaging processing (raw) and after Monte Carlo constrained restoration (MCR) and an additional filtering (MCR+HP filter). b. MCR+HP filter treated SWIR images (false colors) i) 1.5s, ii) 5s, iii) 25s, and iv) 65s after AuMHA/TDT bolus intravenous injection (360 µM; 200 µL).
19
Figure 5.a. SWIR images of a Bmp9-KO mouse after MCR processing, Frangi’s filter, and
segmentation. b. Statistical analyses of blood vessel length and branches as a function of fraction dimension performed on Bmp9-KO mice (n= 4) and WT mice (n= 4). The blue line highlights the discrimination between the two groups.
20
Ultra-small gold particles are used as SWIR contrast agent to detect a vascular disorder with a high level of precision non-invasively in depth and in real time using whole-body optical imaging.
Keyword: shortwave infrared fluorescence, gold nanoclusters, vascular
disorder, monte carlo restoration imaging processing
Zhixi Yu
1, Benjamin Musnier
1, Maxime Henry
1, K. David Wegner
2, Benoit
Chovelon
3, Agnès Desroche-Castan
4, Ute Resch-Genger
2, Sabine Bailly
4,
Jean-luc Coll
1*, Yves Usson
5, Véronique Josserand
1, Xavier Le Guével
1*High-resolution of Vascular Disorders by Shortwave Infrared Imaging
using Gold Nanoclusters
21
REFERENCES
1. Hong, G.; Antaris, A.; Dai, H., Near-infrared fluorophores for biomedical imaging.
Nature biomedical engineering 2017, 1, 0010 (1-22).
2. Hong, G.; Diao, S.; Chang, J.; Antaris, A. L.; Chen, C.; Zhang, B.; Zhao, S.; Atochin, D. N.; Huang, P. L.; Andreasson, K. I.; Kuo, C. J.; Dai, H., Through-skull fluorescence imaging of the brain in a new near-infrared window. Nature Photonics 2014, 8 (9), 723-730. 3. Hong, G.; Lee, J. C.; Robinson, J. T.; Raaz, U.; Xie, L.; Huang, N. F.; Cooke, J. P.; Dai, H., Multifunctional in vivo vascular imaging using near-infrared II fluorescence. Nature
Medicine 2012, 18 (12), 1841-1846.
4. Bruns, O.; Bischof, T.; Harris, D.; Franke, D.; Shi, Y.; Riedemann, L.; Bartelt, A.; Jaworski, F.; Carr, J.; Rowlands, C.; Wilson, M.; Chen, O.; Wei, H.; Hwang, G.; Montana, D.; Coropceanu, I.; Achorn, O.; Kloepper, J.; Heeren, J.; So, P.; Fukumura, D.; Jensen, K.; Jain, R.; Bawendi, M., Next-generation in vivo optical imaging with short-wave infrared quantum dots. Nature biomedical engineering 2017, 1, 0056(1-11).
5. Zhong, Y.; Ma, Z.; Wang, F.; Wang, X.; Yang, Y.; Liu, Y.; Zhao, X.; Li, J.; Du, H.; Zhang, M.; Cui, Q.; Zhu, S.; Sun, Q.; Wan, H.; Tian, Y.; Liu, Q.; Wang, W.; Garcia, K. C.; Dai, H., In vivo molecular imaging for immunotherapy using ultra-bright near-infrared-IIb rare-earth nanoparticles. Nature Biotechnology 2019, 37 (11), 1322-1331.
6. Yang, Q.; Ma, Z.; Wang, H.; Zhou, B.; Zhu, S.; Zhong, Y.; Wang, J.; Wan, H.; Antaris, A.; Ma, R.; Zhang, X.; Yang, J.; Zhang, X.; Sun, H.; Liu, W.; Liang, Y.; Dai, H., Rational Design of Molecular Fluorophores for Biological Imaging in the NIR-II Window. Advanced
Materials 2017, 29 (12).
7. Porret, E.; Le Guével, X.; Coll, J.-L., Gold nanoclusters for biomedical applications: toward in vivo studies. Journal of Materials Chemistry B 2020.
8. Chen, Y.; Montana, D.; Wei, H.; Cordero, J.; Schneider, M.; Le Guevel, X.; Chen, O.; Bruns, O.; Bawendi, M., Shortwave Infrared in Vivo Imaging with Gold Nanoclusters.
Nanoletters 2017, 17 (10), 6330-6334.
9. Desroches-Castan, A.; Tillet, E.; Ricard, N.; Ouarné, M.; Mallet, C.; Feige, J.-J.; Bailly, S., Differential Consequences of Bmp9 Deletion on Sinusoidal Endothelial Cell Differentiation and Liver Fibrosis in 129/Ola and C57BL/6 Mice. Cells 2019, 8 (9). 10. Desroches-Castan, A.; Tillet, E.; Ricard, N.; Ouarné, M.; Mallet, C.; Belmudes, L.; Couté, Y.; Boillot, O.; Scoazec, J.-Y.; Bailly, S.; Feige, J.-J., Bone Morphogenetic Protein 9 Is a Paracrine Factor Controlling Liver Sinusoidal Endothelial Cell Fenestration and
Protecting Against Hepatic Fibrosis. Hepatology 2019, 70 (4), 1392-1408.
11. Musnier, B.; Wegner, K. D.; Comby-Zerbino, C.; Trouillet, V.; Jourdan, M.; Hausler, I.; Antoine, R.; Coll, J. L.; Resch-Genger, U.; Le Guevel, X., High photoluminescence of shortwave infrared-emitting anisotropic surface charged gold nanoclusters. Nanoscale 2019,
11 (25), 12092-12096.
12. Le Guevel, X.; Henry, M.; Motto-Ros, V.; Longo, E.; Montanez, M. I.; Pelascini, F.; de La Rochefoucauld, O.; Zeitoun, P.; Coll, J. L.; Josserand, V.; Sancey, L., Elemental and optical imaging evaluation of zwitterionic gold nanoclusters in glioblastoma mouse models.
Nanoscale 2018, 10 (39), 18657-18664.
13. Shen, D.; Henry, M.; Trouillet, V.; Comby-Zerbino, C.; Bertorelle, F.; Sancey, L.; Antoine, R.; Coll, J. L.; Josserand, V.; Le Guével, X., Zwitterion functionalized gold nanoclusters for multimodal near infrared fluorescence and photoacoustic imaging. APL
Materials 2017, 5 (5).
14. Liu, H.; Hong, G.; Luo, Z.; Chen, J.; Chang, J.; Gong, M.; He, H.; Yang, J.; Yuan, X.; Li, L.; Mu, X.; Wang, J.; Mi, W.; Luo, J.; Xie, J.; Zhang, X.-D., Atomic-Precision Gold Clusters for NIR-II Imaging. Advanced Materials 2019, 31 (46), 1901015.
22
15. Carr, J. A.; Franke, D.; Caram, J. R.; Perkinson, C. F.; Saif, M.; Askoxylakis, V.; Datta, M.; Fukumura, D.; Jain, R. K.; Bawendi, M. G.; Bruns, O. T., Shortwave infrared fluorescence imaging with the clinically approved near-infrared dye indocyanine green.
Proceedings of the National Academy of Sciences of the United States of America 2018, 115
(17), 4465-4470.
16. Du, B.; Jiang, X.; Das, A.; Zhou, Q.; Yu, M.; Jin, R.; Zheng, J., Glomerular barrier behaves as an atomically precise bandpass filter in a sub-nanometre regime. Nature
Nanotechnology 2017, 12 (11), 1096-1102.
17. Tang, S.; Peng, C.; Xu, J.; Du, B.; Wang, Q.; Vinluan Iii, R. D.; Yu, M.; Kim, M. J.; Zheng, J., Tailoring Renal Clearance and Tumor Targeting of Ultrasmall Metal Nanoparticles with Particle Density. Angewandte Chemie International Edition 2016, 55 (52), 16039-16043. 18. Tillet, E.; Bailly, S., Emerging roles of BMP9 and BMP10 in hereditary hemorrhagic telangiectasia. Frontiers in Genetics 2015, 5, 456.
19. Frieden, B. R.; Zoltani, C. K., Monte Carlo restoration of binary objects. J. Opt. Soc.
Am. A 1986, 3 (5), 731-734.
20. Colicchio B.; Xu C.; Haeberlé O.; Dieterlen A.; S. , J., Monte-carlo reconstruction of images from a psf variant system. Focus on Microscopy 2002. Technical Digest of Focus on
Microscopy 2002, 56.
21. Frangi, A. F.; Niessen, W. J.; Vincken, K. L.; Viergever, M. A. In Multiscale vessel
enhancement filtering, Medical Image Computing and Computer-Assisted Intervention —
MICCAI’98, Berlin, Heidelberg, 1998//; Wells, W. M.; Colchester, A.; Delp, S., Eds. Springer Berlin Heidelberg: Berlin, Heidelberg, 1998; pp 130-137.
22. Soleilhac, A.; Bertorelle, F.; Comby-Zerbino, C.; Chirot, F.; Calin, N.; Dugourd, P.; Antoine, R., Size Characterization of Glutathione-Protected Gold Nanoclusters in the Solid, Liquid and Gas Phases. The Journal of Physical Chemistry C 2017, 121 (49), 27733-27740.