Cooling Performance of Storable Propellants for a micro
rocket engine
by
Carole Joppin
Submitted to the Department of Aeronautics and Astronautics in partial fulfillment of the requirements for the degree of
MASTER OF SCIENCE at the
MASSACHUSETTS INSTITUTE OF TECHNOLOGY June 2002
@ Carole Joppin, MMII. All rights reserved.
The author hereby grants to MIT permission to reproduce and distribute publicly paper and electronic copies of this thesis document in whole or in part.
Author ...
Depar en Aeronautics and Astronautics May 24, 2002
K~N
I.
Certified by ... ... ...
Professor Alan H. Epstein R.C. Maclaurin P ifessor of Aeronautics and Astronautics Thesis Supervisor
Al I j I AJ7
Accepted by,... ...
... ...
..
....
...
Professor Wallace E. Vander Velde Professor of Aeronautics and Astronautics Chair, Committee on Graduate Students
MASSACHUJSETTS iN ITUTE OF TECHNOLOGY
Cooling Performance of Storable Propellants for a Micro Rocket Engine
byCarole Joppin
Submitted to the Department of Aeronautics and Astronautics on May 24, 2002, in partial fulfillment of the
requirements for the degree of MASTER OF SCIENCE
Abstract
This thesis studies the selection of propellants for a liquid regeneratively cooled micro rocket engine focusing on the characterization of their cooling performance. Propellants will be at high pressures and under high heat fluxes in the cooling passages and will be supercritical. A summary of the propellant combination selection process and a brief evaluation of po-tential propellants are presented.
A series of heat transfer tests in electrically heated stainless steel micro tubes 95 microns inner diameter has been conducted with two hydrocarbons JP7 and JP10 at subcritical, critical and supercritical conditions and under high heat fluxes. JP7 and JP10 have been evaluated on the basis of their heat transfer capabilities, their stability and the formation of deposits in micro channels. JP7 offers a high heat capacity. An increase in the heat transfer coefficient at the end of the tube, combined with an increase in the Stanton number, seems to indicate that JP7 undergoes an endothermic decomposition which causes a significant enhancement in heat transfer capacity. JP10 offers lower heat transfer coefficients. Both hydrocarbons show a good stability and no evidence of deposits has been seen.
Previous results with supercritical ethanol were compared to the results with JP7 and JP10. JP7 seems to provide the highest heat transfer coefficients at high pressures and seems to be the most promising coolant for the regeneratively cooled rocket engine.
Compatibility issues associated with the use of hydrogen peroxide as oxidizer for the liquid rocket engine have been addressed. Materials used in MEMS devices show good compati-bility with 98 % hydrogen peroxide after passivation in 30 % hydrogen peroxide except for platinum.
Thesis Supervisor: Professor Alan H. Epstein
Title: R.C. Maclaurin Professor of Aeronautics and Astronautics
Acknowledgments
I would like first to thank my thesis advisor Professor Alan Epstein for offering me the
opportunity to be part of such an exciting project as the micro rocket engine program. Working under his supervision has been an invaluable experience. I also wish to extend my gratitude to Professor Kerrebrock for his precious guidance, his constant support and his encouragements. My graduate experience and my understanding of my project would not be what they are without their help and I thank them for their dedication to my research work and to furthering my education.
I had the privilege to work with an exceptional group of people in the Gas Turbine
Labo-ratory and the microengine program. I am grateful to Dr. Gerald Guenette for his help to improve the test rig and the experimental protocol; Dr. Yoav Peles for giving me the right contacts; James Letendre for his invaluable advice and help with my numerous technical problems to improve and fix my test rig; Paul Warren for his patience and advice with all the problems I would come to him with; Jack Costa and Viktor Dubrowski for their contribution to the test rig; Bill Ames, Marie Mc Davitt, Holly Anderson, Susan Parker and Diana Park for dealing with my questions. A special attention to Lori Martinez not only for her support but also for her constant good mood and for establishing such a good social atmosphere in the laboratory.
I am grateful to Chris Protz for his patience with my numerous questions, for his
assis-tance in my project, for introducing me with the micro rocket engine and for letting me steal his mass flow meter so often. Special thanks to Laurent Jamonet for his advice on tech-nical issues and for keeping me company during the late nights of work. I am also grateful to the remainder of the micro rocket engine team Sumita Pennathur, Antoine Deux, Erin Noonan, Shana Diez, Dr. Sun, Nori Miki and Jin-Wook Lee.
I would like to thank all the students in the Gas Turbine Laboratory with whom I had
a great time, especially my office mates, Chris Spadaccini and Chiang-Juay Teo.
My experience at MIT would not have been as unforgettable as it is without the friendship
of so many people and the love and support of my family. I am particularly grateful to Yann for his advice, his constant support and for agreeing to read every single page of my thesis.
This research was sponsored by NASA. This support is gratefully acknowledged.
Contents
1 Introduction
1.1 MEMS fabricated micro rocket engine . . . . 1.1.1 Justification for a micro rocket engine . . . . 1.1.2 Description of the concept of the micro rocket engine . . . .
1.1.3 Different components of the micro rocket engine . . . .
1.1.4 From a gaseous rocket engine to a rocket engine . . . .
liquid regeneratively cooled micro . . . . 34 1.2 1.3 1.4 Background ... .... O bjectives . . . . Thesis organization . . . . 2 Selection process and potential propellants
2.1 Criteria for selection . . . . 2.1.1 Performance [27] . . . . 2.1.2 Capacity as a coolant . . . . 2.1.3 Prediction for rocket design . . . . . 2.1.4 Other criteria . . . . 2.2 Introduction to supercritical fluids behavior
2.3 Candidate propellants . . . .
2.3.1 List of potential candidates . . . . .
2.3.2 Performance as propellants . . . . . 2.3.3 Capacity as a coolant . . . . 2.3.4 Other criteria . . . . 2.3.5 Propellant summary . . . . 7 29 30 30 31 31 36 36 36 39 . . . . 3 9 . . . . 3 9 . . . . 4 0 . . . . 4 1 . . . . 4 2 . . . . 4 2 . . . . 4 7 . . . . 4 7 . . . . 4 9 . . . . 5 0 . . . . 5 2 . . . . 5 2
2.4 C onclusions . . . .
3 Description of the experiment
3.1 Principle of the experiment . . . .
3.2 Justification of heat transfer experiments . . . . 3.2.1 Characterization of the propellant . . . .
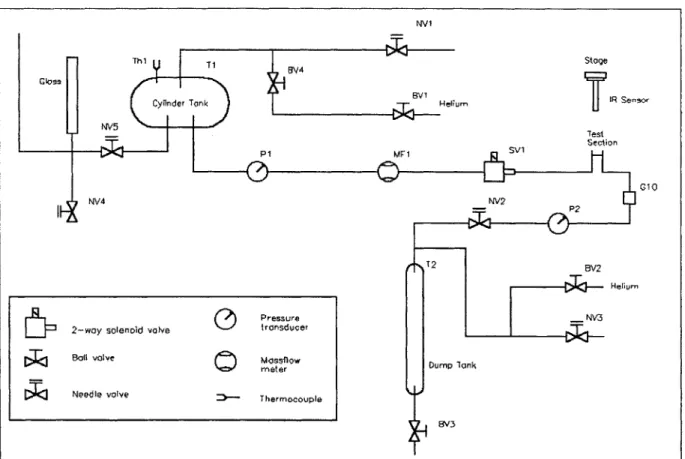
3.2.2 Prediction for the future design of the liquid regeneratively cooled rocket engine . . . . 3.3 Experimental apparatus . . . . 3.3.1 Test section . . . . 3.3.2 Test rig . . . . 3.3.3 Data acquisition . . . . 3.3.4 Experimental procedure . . . 3.4 General data reduction . . . . 3.4.1 Measured parameters . . . .
3.4.2 Power . . . . 3.4.3 Bulk temperature . . . . 3.4.4 Inside wall temperature . . .
3.4.5 Heat transfer coefficient . . .
3.4.6 Non dimensional number: St
3.5 Different experimental procedures .
3.6 Experimental issues and errors . . . 3.6.1 Experimental limitations . . .
3.6.2 Experimental uncertainties .
3.6.3 Validity of model assumptions 4 JP7 study
4.1 Introduction to JP7 jet fuel . . . . 4.2 Motivation for JP7 study . . . .
4.2.1 JP7 stability: carbon deposit formation
4.2.2 Enhancement in heat transfer with JP7 4.3 Heat transfer experimental study . . . .
4.3.1 Description of the experiments . . . . 8 52 55 55 56 56 . . . . 5 7 . . . . 5 7 . . . . 5 7 . . . . 5 8 . . . . 6 5 . . . . 6 7 . . . . 6 9 . . . . 6 9 . . . . 6 9 . . . . 7 0 . . . . 7 0 . . . . 7 2 . . . . 7 3 . . . . 7 3 . . . . 7 4 . . . . 7 4 . . . . 7 5 . . . 76 79 . . . . 7 9 . . . . 8 0 . . . . 8 0 . . . . 8 3 . . . . 9 0 . . . . 9 0
4.3.2 4.3.3 4.3.4
4.3.5 4.3.6
General overview of the results . . . .
Summary of the experiments . . . . Conditions of appearance of the different profiles and comparison of the enhancements offered . . . . Dependence of the heat capacity of JP7 on experimental conditions Analysis of JP7 endothermic reaction . . . .
4.4 Stability . . . . 4.4.1 Oscillations of the temperature 4.4.2 Deposits . . . . 4.4.3 Hot points . . . . 4.5 Reproducibility issue . . . . 4.6 Conclusions . . . .
5 JP10 study
5.1 Introduction to JP10 jet fuel . . . . 5.2 Motivation for JP10 study . . . .
5.2.1 Possible endothermic reaction . . . .
5.2.2 Simple molecule . . . .
5.2.3 Main issue associated with JP10 . .
5.3 Heat transfer experimental study . . . .
5.3.1 Description of the experiments . . .
5.3.2 General features . . . .
5.3.3 Summary of the results . . . . 5.3.4 Dependence of JP10 cooling capacity
5.3.5 Conclusions . . . .
5.4 Stability . . . .
5.4.1 Comparison with JP7 experiments .
139 . . . . 139 . . . . 14 0 . . . . 14 0 . . . . 14 0 . . . . 14 0 . . . . 14 0 . . . . 14 0 on experimental conditions 141 142 149 156 158 159 6 Hydrogen Peroxide 6.1 Presentation of Hydrogen Peroxide . . . . 6.2 Hydrogen peroxide characteristics . . . . . 6.2.1 Density . . . . 6.2.2 Viscosity . . . . 165 . . . . 165 . . . . 166 . . . . 166 . . . . 166 9 91 93 97 105 116 . . . . 131 . . . . 131 . . . . 1 3 3 . . . . 134 . . . . 1 3 5 . . . . 136
6.2.3 Thermal conductivity . . . . 6.2.4 Surface tension . . . .
6.2.5 Critical point . . . . 6.2.6 Thermal properties . . . .
6.2.7 Decomposition reaction . . . .
6.3 Hydrogen peroxide handling . . . . 6.4 Hydrogen peroxide compatibility . . . . 6.4.1 Compatibility issues . . . . 6.4.2 Compatibility tests for MEMS material . . . . 6.4.3 Test rig preparation for tests with highly concentrated hyd ox ide . . . .
6.5 Conclusion . . . . 7 Elements for the design of the liquid micro rocket engine
7.1 Cooling capacity of the fuels tested . . . . 7.2 Heat transfer correlations . . . .
7.2.1 Design of the rocket engine . . . . 7.2.2 Ethanol tests . . . . 7.2.3 Heat transfer correlations tested . . . .
7.2.4 JP 7 data . . . .
7.2.5 JP 10 data . . . . 7.3 Extrapolation of the results of the heat transfer experiments for
rocket engine . . . . 8 Conclusion 8.1 Sum m ary . . . . 8.2 Future work . . . . [rogen per-the micro
A Fluid properties used to reduce JP7 data
B Reduction data C Uncertainty analysis C.1 Introduction . . . . 10 167 167 167 167 168 169 169 169 170 173 177 179 179 180 180 181 181 184 185 . . . . 185 189 189 191 193 197 201 201
C.2 Uncertainty associated with independent measurements C.2.1 Pressure . . . .
C.2.2 Mass flow . . . .
C.2.3 Power delivered to the fluid ...
C.2.4 Outside wall temperature . . . .
C.2.5 Tube dimensions . . . . C.2.6 Position . . . . C.3 Uncertainty associated with derived quantities C.3.1 Inside tube area Ai . . . .
C.3.2 Cross section area Ae . . . . .. C.3.3 Heat flux . . . . C.3.4 Fractional position . . . .
C.3.5 Inside wall temperature . . . .
C.3.6 Bulk enthalpy . . . .
C.3.7 Bulk temperature . . . . C.3.8 Film temperature . . . . C.3.9 Heat transfer coefficient . . . . C.3.10 Inside wall enthalpy . . . . C.3.11 Stanton number . . . . 11
[23]
[25] [2]
201 202 203 203 205 205 205 206 207 207 208 208 208 208 209 209 209 209 . .. . 201List of Figures
1-1 Baseline design of the micro engine. Cross section of the demo engine at two different locations and 3D section of the demo engine device [14]. . . . . 30
1-2 Concept of the turbopump. Cross section of the device [14]. . . . . 32 1-3 Exploded top and bottom views of the turbopump device. The horizontal separation
appearing on each layer is not representative of the design and only comes from the rendering[14]. . . . . 33
1-4 Micro rocket engine developed and tested in the Gas Turbine Laboratory at MIT [14]. 34 2-1 P-T diagram showing the critical point for a typical fluid [22]. . . . . 43 2-2 Density variation for CO2 as a function of temperature near the critical point [11]. 44
2-3 Viscosity variation for C02 as a function of temperature near the critical point [11]. 44 2-4 Thermal conductivity variation for C02 as a function of temperature near the critical
point [11]. . . . . 45
2-5 n-dodecane density as a function of temperature for subcritical, critical and
super-critical pressures [11]. . . . . 46
2-6 n-dodecane viscosity as a function of temperature for subcritical, critical and super-critical pressures [11]. . . . . 46
2-7 Effects of temperature and pressure on the specific heat of C02 near the
criti-cal point [10]. ISOBARS: Cp as a function of temperature for different pressures. ISOTHERMS: Cp as a function of pressure for different temperatures. SURFACE:
Cp as a function of temperature and pressure. . . . . 48
2-8 Vacuum specific impulse (Isp) as a function of chamber temperature for different combinations of propellants assuming flow chemically frozen from the throat to the nozzle exit [27]. . . . . 49
2-9 Vacuum density specific impulse (Id) as a function of chamber temperature for dif-ferent combinations of propellants assuming flow chemically frozen from the throat
to the nozzle exit [27]. . . . . 50
2-10 Summary of the pros and cons of the different selected propellants. The darker color identifies the issues that will be addressed in the current thesis. * identifies issues still not addressed. . . . . 53
3-1 Micro test section used for the heat transfer experiments. . . . . 58
3-2 View of the control room. . . . . 59
3-3 View of the test apparatus in the micro rocket test cell. . . . . 59
3-4 Schematic of the test rig for the heat transfer experiments. . . . . 60
3-5 Electrodes attached to the micro test section. . . . . 62
3-6 Schematic of the test section and the heating system. . . . . 62
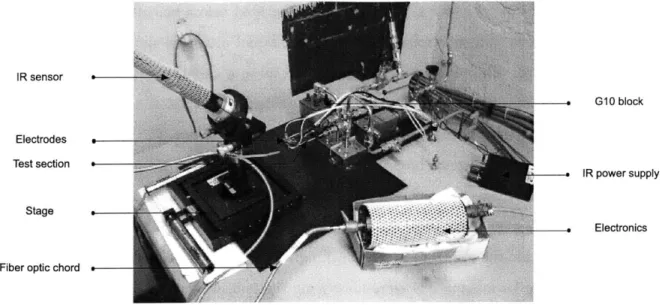
3-7 Experimental set up and temperature measurement using the IR sensor. . . . . . 64
3-8 Screen shot of the Labview interface. . . . . 65
3-9 Summary of the position of the valves for the different steps during the heat transfer experim ents. . . . . 68
3-10 Schematic of the micro test section. . . . . 71
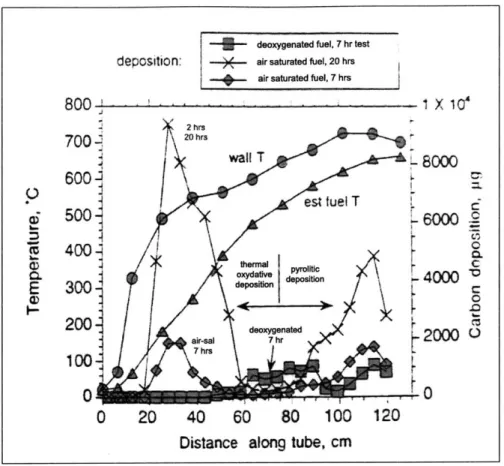
4-1 Typical surface deposition test results for tests at macro scale. Air saturated Jet A 3084, 33 mL.minI , 7 hrs, 69 atm [30] . . . . 81
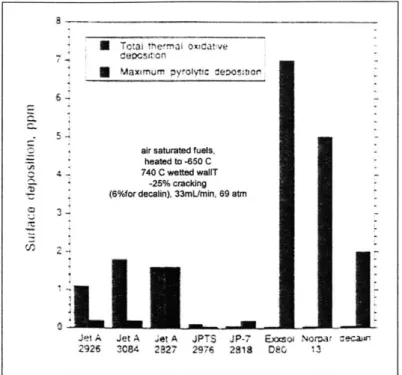
4-2 Cracking from several fuels in a flow reactor with a residence time of 1 to 2 seconds. For each fuel, the bar on the left represents the total thermal-oxidative deposition and the bar on the right the maximum pyrolitic deposition [30]. . . . . 82
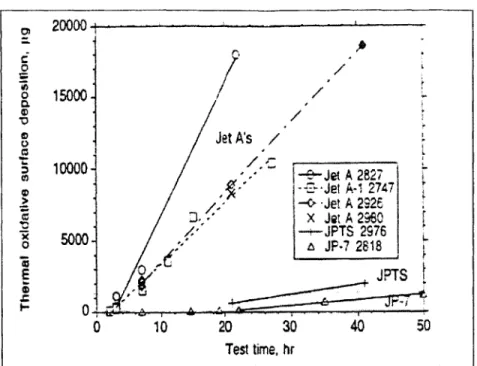
4-3 Surface deposition as a function of test time for 12 mL.min 1 tests [30] . . . . . . 83
4-4 Specific heat profile as a function of temperature at P = 265 psi (18 atm,
Q
PC = 1.01) [16]. . . . . 844-5 Specific heat profile as a function of temperature for two pressures: P = 265 psi (18 atm,
y
= 1.01) and P = 1,000 psi (68 atm,y
= 3.8) [16]. . . . . 854-6 Model of the fluid enthalpy taking into account the endothermic reaction. The reaction is assumed to occur between 550'C and 650*C and to give an endothermy of 1,395,588 J/kg. . . . . 86
4-7 Comparison of the effects of both phenomena. The enthalpy profile of JP7 is shown as a function of temperature. The supercritical effect is calculated from the specific heat of JP7 at P=265 psi (-z=1.01). The effect of the endothermic reaction is estimated from experimental data at macro scale at P=1,000 psi. . . . . 89
4-8 Possible temperature profiles along the test section in JP7 experiments [5]. .... 91
4-9 Outside wall temperature, inside wall temperature, bulk temperature and film tem-perature (Tfilm = (Ti - Tbulk)/2) as a function of the distance from the entrance of the tube. The outside wall temperature shows a peak in the middle of the tube before decreasing significantly. . . . . 94
4-10 Outside wall temperature, inside wall temperature, bulk temperature and film tem-perature (Tfilm = (Ti - Tbulk)/2) as a function of the distance from the entrance of the tube. The outside wall temperature shows a flat profile along the tube. .... 94
4-11 Calculated heat transfer coefficient corresponding to the temperature profile shown
in Figure 4-9. The test conditions are P = 187 psi (- = 0.7), mh = 0.044'g/s and
q = 23 W /m m 2. . . .
96
4-12 Calculated heat transfer coefficient corresponding to the temperature profile shown in Figure 4-10. The test conditions are P = 581 psi (y = 2.23), mh = 0.032 g/s and q = 21.5 W
/m
m2. . . . . 964-13 Stanton number along the tube for a test at 1,523 psi (y = 5), a mass flow of 0.23 g/s and a heat flux of 72 W/mm2 . . . . . . . . . . . . . . . . . . . . . 97
4-14 Inside wall drop temperature vs. the critical pressure ratio. . . . . 99
4-15 Inside wall drop temperature vs. the difference between the inside and the bulk temperatures at the same point for different mass flow ranges. . . . . 100
4-16 Inside wall temperature vs. the difference between the inside and the bulk temper-atures at each point along the tube for mass flows between 0.23 and 0.26 g/s. . . . 101
4-17 Summary of all the characteristics of the tests in which a smooth temperature profile was recorded. The three first plots show the conditions of the tests: pressure, mass flow and heat flux are shown. The five following graphs show the results of the tests: the maximum heat transfer coefficient recorded, the increase in heat transfer coefficient at the end of the tube, the type of profile noticed (either a smooth profile or a profile where the temperature shows a sharp peak value), the minimum heat transfer coefficient recorded along the tube and the ratio of the increase in the heat transfer coefficient and its minimum value. Each case is a test. The 65 tests appear on the graph. The dark cases are the tests which showed a smooth profile. . . . . 102 4-18 Temperature profiles for two tests carried out in similar conditions: P = 400 psi
(-L = 1.55), rh = 0.058 g/s and q = 28 W/mm2. The outside wall and the inside wall temperatures are shown for both tests with experimental error bars. . . . . . 104 4-19 Heat transfer coefficient profiles for two tests carried out in similar conditions:
P = 400 psi
(-
= 1.55), Ah = 0.058 g/s and q = 28 W/mm2 . . . . 1054-20 Summary of the attributes of the 65 tests carried out with JP7. The dark cases correspond to the tests which offer the 20 % highest heat transfer coefficients along the tube. The end point is assumed to be at 1,750 microns from the entrance. . . 106
4-21 Heat transfer coefficient as a function of heat flux for different pressures at high heat fluxes. The series labels correspond to pressure-mass flow for the test. . . . . 107
4-22 Heat transfer coefficient at 1,750 microns from the entrance as a function of heat flux for different pressures and a mass flow of 0.055 g/s. . . . . 107
4-23 Increase in heat transfer coefficient along the tube as a function of heat flux for different pressures and a mass flow of 0.055 g/s. . . . . 109
4-24 Non dimensional increase in the heat transfer coefficient as a function of pressure. 111 4-25 Minimum heat transfer coefficient along the tube as a function of pressure. . . . . 111 4-26 Minimum Stanton number along the tube as a function of pressure. . . . . 112 4-27 Increase in Stanton number as a function of heat flux for different mass flows. . . . 113
4-28 Minimum value of the Stanton number as a function of heat flux for different mass
flows... .. ... 114
4-29 Increase in the Stanton number as a function of the maximum inside wall tempera-ture reached along the tube. . . . . 115
4-30 Increase in the Stanton number as a function of pressure. . . . . 115 16
4-31 Model of JP7 enthalpy profile taking into account the endothermic decomposition. The model uses the assumptions presented in Table 4.1. . . . . 119
4-32 Model of the enthalpy profiles. The enthalpy profiles without decomposition and with decomposition respectively for increasing and decreasing temperatures are shown. The following assumptions were used to model the reaction: a maximum endothermy of 2,895,588 J/kg, an onset temperature of 530'C, an end reaction tem-perature of 641'C and a conversion of 50 %. . . . . 122 4-33 Model of the enthalpy profiles. The enthalpy profiles without decomposition and
with decomposition respectively for increasing and decreasing temperatures are shown. The following assumptions were used to model the reaction: a maximum endothermy of 3,000,000 J/kg, an onset temperature of 550'C, an end reaction tem-perature of 661 C and a conversion of 50 %. . . . . 123
4-34 Stanton number profiles along the tube. The Stanton numbers calculated with-out taking into account the decomposition and from the enthalpy model are repre-sented. For this calculation, a reaction onset temperature of 530 C and a maximum endothermy of 1,395,588 J/kg are assumed. . . . . 124 4-35 Inside wall and bulk enthalpies calculated from experimental data using the enthalpy
model. The test was carried out at a pressure of 400 psi, a mass flow of 0.033 g/s and a heat flux of 30 W/mm2. The calculation was done assuming for the model a reaction onset temperature of 530 C and an endothermy of 1,395,588 J/kg. . . . . 125
4-36 Stanton number profiles along the tube for reaction onset temperatures ranging from 400'C to 600'C. An endothermy of 1,395,588 J/kg is assumed in all the calculations. The Stanton profile obtained without accounting for the decomposition is showed as
a com parison. . . . . 127
4-37 Stanton number profiles along the tube for a maximum reaction endothermy ranging from 0 J/kg to 6,000,000 J/kg. A reaction onset temperature of 530 C is assumed. The Stanton number profile obtained without accounting for the decomposition is
showed as a comparison. . . . . 129
4-38 Stanton number profiles along the tube. The model assumes a reaction onset tem-perature of 365'C and a maximum endothermy of 1,395,588 J/kg. . . . . 131
4-39 Outside wall temperature measured at 900 microns from the tube entrance. The plot shows 5 minutes recorded during a stability test conducted at a pressure of 400 psi, a mass flow of 0.04 g/s and a heat flux of 30 W/mm2. . . . .
132
4-40 Outside wall temperature measured at 350 microns from the tube entrance. The plot shows 10 minutes recorded during a stability test conducted at a pressure of 400 psi, a mass flow of 0.055 g/s and a heat flux of 30 W/mm2. . . .
132
4-41 Mass flow measurement at 1,050 microns from the entrance of the tube during a 10-minute stability test carried out at a pressure of 400 psi, a mass flow of 0.056 g/s and a heat flux of 17 W /mm2. . . . 133
4-42 Outside wall temperature measured at 350 microns from the tube entrance. The plot shows 10 minutes recorded during a stability test conducted at a pressure of 400 psi, a mass flow of 0.055 g/s and a heat flux of 30 W/mm2. . . .
134 4-43 Outside wall temperature measured at 1050 microns from the tube entrance. The
plot shows 10 minutes recorded during a stability test conducted at a pressure of 400 psi, a mass flow of 0.055 g/s and a heat flux of 17 W/mm2. . . . 135
4-44 Outside wall temperature along the tube for different tests carried out approximately in the same conditions: a pressure around 400 psi, a mass flow between 0.055 g/s and 0.006 g/s and a heat flux around 30 W/mm2. . . . 137 5-1 Molecule of JP1O (C10H16 or exo-tetrahydrodicyclopentadiene)[121 . . . . 139 5-2 Temperature along the tube for a test with JP10 at a pressure of 410 psi (Q = 0.74),
a mass flow of 0.06 g/s and a heat flux of 18 W/mm2. . . .
143
5-3 Temperature profiles for a test with JP10 at a pressure P = 405 psi (- = 0.75), a
mass flow rh = 0.08 g/s and a heat flux q = 23 W/mm2 . . . . . . . . . . .
144 5-4 Temperature profiles along the tube for a test with JP1O at a pressure P = 849 psi
(yL = 1.57), a mass flow rh = 0.07 g/s and a heat flux q = 26.6 W/mm2. . . . 145
5-5 Temperature profiles along the tube for a test carried out with JP10 at a pressure
P = 3,173 psi (- = 5.86), a mass flow rh = 0.05 g/s and a heat flux q = 30 W/mm2.145
5-6 Heat transfer coefficient profile along the tube for a test with JP10 at a pressure of 410 psi (- = 0.74), a mass flow of 0.06 g/s and a heat flux of 18 W/mm2 . . . 147
5-7 Heat transfer coefficient profile for a test with JP1O at a pressure P = 405 psi (- = 0.75), a mass flow rh = 0.08 g/s and a heat flux q = 23 W/mm2. . . . . . .
147
5-8 Heat transfer coefficient profile along the tube for a test with JP10 at a pressure P = 849 psi (- = 1.57), a mass flow rh = 0.07 g/s and a heat flux q = 26.6 W/mm2
.148
5-9 Heat transfer coefficient profile along the tube for a test carried out with JP10 at a pressure P = 3,173 psi (- = 5.86), a mass flow
ni
= 0.05 g/s and a heat flux q = 30 W/mm2 . . . . . . . . . . . . . . . . . . . . . . . . . . . . . . . 1495-10 Stanton number profile along the tube for a test with JP10 at a pressure of 410 psi
(- = 0.74), a mass flow of 0.06 g/s and a heat flux of 18 W/mm2. . . . 150 5-11 Stanton number profile for a test with JP10 at a pressure P = 405 psi (P = 0.75),
a mass flow rh = 0.08 g/s and a heat flux q = 23 W/mm2. . . . . 150 5-12 Stanton number profile along the tube for a test with JP10 at a pressure P = 849 psi
(- = 1.57), a mass flow ii = 0.07 g/s and a heat flux q = 26.6 W/mm2. . . . 151 5-13 Stanton number profile along the tube for a test carried out with JP10 at a pressure
P = 3,173 psi (- = 5.86), a mass flow rh = 0.05 g/s and a heat flux q = 30 W/mm2
.151 5-14 Heat transfer coefficient at 1,750 microns from the entrance of the tube as a function
of heat flux. ... ... 152 5-15 Minimum heat transfer coefficient along the tube as a function of heat flux. . . . . 153 5-16 Increase in heat transfer coefficient along the tube as a function of heat flux. The
increase in the heat transfer coefficient is defined as the difference between the maxi-mum and the minimaxi-mum heat transfer coefficients calculated up to 1750 microns from the entrance of the tube. . . . . 153 5-17 Deterioration of the heat transfer coefficient at high heat fluxes with supercritical
fluids [7]. . . . . 154
5-18 Heat transfer coefficient at 1,750 microns from the entrance of the tube as a function
of the critical pressure ratio. . . . . 155 5-19 Increase in the heat transfer coefficient along the tube as a function of the critical
pressure ratio. . . . . 156 5-20 Increase in the Stanton number along the tube as a function of the critical pressure
ratio. . . . . 157 5-21 Increase in the Stanton number along the tube as a function of heat flux. . . . . . 157 5-22 Outside wall temperature measured at 1,400 microns from the entrance during a
sta-bility test carried out at a critical pressure ratio - = 1.55, a mass flow rh = 0.07 g/s
and a heat flux q = 30 W/mm2. . . . 159
5-23 Outside wall temperature measured at 1400 microns from the entrance during a
stability test carried out at a critical pressure ratio P = 1.55, a mass flow rh = 0.07
2
g/s and a heat flux q = 30 W/mm2. . . . . 160
5-24 Outside wall temperature measured at 1,400 microns from the entrance during a sta-bility test carried out at a critical pressure ratio - = 1.55, a mass flow m = 0.07 g/s and a heat flux q = 30 W/mm2. . . . 160 5-25 Heat transfer coefficients at 1,750 microns from the entrance as a function of heat
flux for JP7 and JP10 tests. ... ... .... ... . 162 5-26 Increase in the heat transfer coefficient along the tube as a function of heat flux. . 163 5-27 Comparison of the results obtained with JP7 and JP10 for 3 experimental conditions. 164
6-1 Specific heat and enthalpy of 100 % hydrogen peroxide vapor for different tempera-tures at 1 atm [29]. . . . . 168 6-2 Compatibility of 98 % hydrogen peroxide with MEMS materials. Summary of
com-patibility experiments. . . . . 171 6-3 Stator layer of the electric motor with the different materials used in this layer. . . 173
6-4 Schematic of the H202 rig. . . . . 174
7-1 Heat transfer coefficients for ethanol, JP7 and JP10 for different experimental con-ditions at a critical pressure ratio of 1.6. . . . . 180 7-2 Heat transfer coefficients given by different heat transfer correlations are compared
to the experimental heat transfer coefficients obtained during tests with JP7 at a m ass flow of 0.07 g/s . . . . 183 7-3 Heat transfer coefficients given by different heat transfer correlations are compared
to the experimental heat transfer coefficients obtained during tests with JP7 at a m ass flow of 0.24 g/s . . . . . 183
7-4 Heat transfer coefficients given by different heat transfer correlations are compared to the experimental heat transfer coefficients obtained during tests with JP7 at a m ass flow of 0.36 g/s . . . . 184
7-5 The heat transfer coefficients given by the Nominal and the Nominal corrected cor-relations are compared to the experimental heat transfer coefficients obtained during
a test with JP7. . . . . 185
7-6 Heat transfer coefficients given by different heat transfer correlations are compared to the experimental heat transfer coefficients obtained during tests with JP10 at a m ass flow of 0.07 g/s . . . . . 186 7-7 Heat transfer coefficients given by different heat transfer correlations are compared
to the experimental heat transfer coefficients obtained during tests with JP1O at a m ass flow of 0.24 g/s . . . . . 186 7-8 Heat transfer coefficients given by different heat transfer correlations are compared
to the experimental heat transfer coefficients obtained during tests with JP10 at a m ass flow of 0.36 g/s . . . . 187 7-9 Heat transfer coefficients given by different heat transfer correlations are compared
to the experimental heat transfer coefficients obtained during tests with JP10 at a m ass flow of 0.8 g/s. . . . . 187 A-1 Density profiles used in the reduction of JP7 data. Density is shown as a function of
temperature for 4 different pressures. 220 psi, 294 psi are n-dodecane data. 514 psi and 1,000 psi are JP7 data. . . . . 193 A-2 Viscosity profiles used in the reduction of JP7 data. Viscosity is shown as a function
of temperature for 4 different pressures. 220 psi, 294 psi are n-dodecane data. 514 psi and 1,000 psi are JP7 data. . . . . 194
A-3 Conductivity profiles used in the reduction of JP7 data. Conductivity is shown as
a function of temperature for 4 different pressures. 220 psi, 294 psi are n-dodecane data. 514 psi and 1,000 psi are JP7 data. . . . . 194 A-4 Specific heat profiles used in the reduction of JP7 data. Cp is shown as a function of
temperature for 4 different pressures. 220 psi, 294 psi are n-dodecane data. 514 psi and 1,000 psi are JP7 data. . . . . 195
B-i Data reduction process for JP7 tests . . . . . 198
B-2 Data reduction process for JP10 tests. . . . . 199 C-1 Outside wall temperature vs. time during a stability test carried out with JP10.
The IR sensor slowly gets misaligned with the tube. . . . . 204
List of Tables
1.1 Summary of the main characteristics of the micro rocket engine [23]. . . . . 35
1.2 Heat fluxes at different points in the rocket engine [23, p. 97]. . . . . 35
2.1 Critical point for different fluids [18] [15] [29]. . . . . 43 4.1 Assumptions for the enthalpy model . . . . 120 4.2 Inside wall temperature along the tube for a test at a pressure of 400 psi, a mass
flow of 0.033 g/s and a heat flux of 30 W/mm2. . . . 128 5.1 Correspondence between JP7 and JP10 pressures for the same critical pressure
ra-tios. Summary of the properties used for the reduction of JP10 data . . . . 142
6.1 Density of 98 % hydrogen peroxide at different temperatures [29]. . . . . 166 6.2 Viscosity of 98 % hydrogen peroxide at different temperatures [29]. . . . . 167 6.3 Thermal conductivity of 98 % hydrogen peroxide at 00C and 25'C and ambient
pressure [29]. . . . . 167 C.1 Some uncertainties on the pressure transducers. . . . . 202
C.2 Tests conditions of the three tests chosen as examples for the uncertainty analysis. 206
Nomenclature
Roman
Ae Cross-section area Ai Inside wall surface
BV Ball valve C Influence coefficient Cp Specific heat D Passage size DC Direct current E Electrical field G Mass velocity H Enthalpy I Current
Id Density specific impulse IR Infra-red
Isp Specific impulse
JP7 Jet Fuel 7
JP10 Jet Fuel 10
JPTS Jet Fuel Thermally Stable
MF Mass flowmeter Nu Nusselt number NV Needle valve
P Pressure (also pressure transducer) Pi Pressure before the test section
P2 Pressure after the test section Pc Critical pressure Pr Prandtl number
Q
Power R Resistance S Fractional uncertainty SR Relieve valve St Stanton number SV Solenoid valveT Temperature (also tank) Th Thermocouple
V Voltage (also valve)
X Position (also fluid component in the enthalpy model)
f
Friction factorh Heat transfer coefficient
I Micro tube length rh Mass flow
q Heat flux
r Radial distance from the center radius ri Inner radius ro Outer radius t Time u Fluid velocity X Fractional distance 26
Greek
a Oxidizer to fuel mass ratio
/# Scale factor on the pressure measurements AP Pressure drop across the pump
K Conductivity y Viscosity
p Density
o- Dielectric constant of the 304 stainless steel
Subscripts
av Averageb Bulk
bulk Bulk
c Critical (also calibration)
C, Constant temperature properties
f
Filmfluid Fluid
fuel Fuel
i Inside wall conditions o Outside wall conditions ox Oxidizer pc pseudo critical ss Stainless steel w Wall
Acronyms
3D Three-dimensionalCEA Computer Program Calculation of Complex Chemical Equilibrium Compositions and Applications
MEMS Micro electro mechanical systems
rpm Rotations per minute
Chapter 1
Introduction
Micro-electromechanical systems (MEMS) refer to small systems produced using the same methods as for computer chips. They can be made by bonding together several planar silicon wafers to create a 3D device. First appearing two decades ago in the high-tech com-munity, they are considered to offer great promise for applications in various fields from automobile airbags to aircraft engines. MEMS devices offer high performance to mass ra-tios and potentially a substantial cost advantage due to their manufacturing techniques of production, which allow large scale production.
At MIT, a large effort is dedicated to the study of power-MEMS, especially for propul-sion and electric applications. In 1994, Epstein et al. [19] proposed the concept of micro engines using the MEMS technology. Two programs are on-going at MIT: a micro-gas en-gine and a micro rocket enen-gine [17].
Micro engine program The micro-gas engine device is a gas turbine engine
regroup-ing in a cm-scale device turbine, compressor and combustor. Many potential applications are considered from the propulsion of micro air vehicles to power generation. A demonstra-tion engine has been designed by Protz [28] for a 10 g thrust level. The baseline design of the current device is shown in Figure 1-1.
Micro rocket program The concept of a micro rocket engine has been first
intro-duced by Adam London [23]. Designed to produce 15 N of thrust, this bipropellant engine 29
Starting P3 FueIn Air In Compressor Inlet
Turbine Combustor
Figure 1-1: Baseline design of the micro engine. Cross section of the demo engine at two different locations and 3D section of the demo engine device [14].
uses gaseous propellants and a liquid coolant. On-going tests have demonstrated a maxi-mum thrust of 2 N and a maximaxi-mum chamber pressure of 90 atm.
As part of the micro rocket engine program, this work is a study of the cooling proper-ties of potential storable propellants for a liquid regeneratively cooled micro rocket engine. This chapter gives an overview of the micro rocket project and the objectives of the present propellant study within the general framework of the micro rocket engine application.
1.1
MEMS fabricated micro rocket engine
1.1.1 Justification for a micro rocket engine
The thrust of an engine scales with the area of the nozzle whereas the weight of the engine scales with the volume. As the size of the engine decreases, the mass decreases faster than the thrust. Therefore, micro engines offer good thrust to weight ratios. The micro rocket engine can produce thrust to weight ratios higher by an order of magnitude than macro scale rocket engines. The thrust to weight ratio is directly related to the mass of payload that can be delivered to orbit.
Moreover, the silicon fabrication technique allows large scale production, therefore poten-tially decreasing production costs. This can lead to significant cost reductions in satellite systems or launch vehicles.
Many applications have been envisioned for such micro rocket engines giving a thrust in the
15 N range. A first potential use would be for attitude control or as propulsion system for
manoeuvering satellite systems. Their light weight would give them a great advantage over current macro scale propulsion systems in small thrust applications. The option of using them as main propulsion devices was also investigated. Associated in parallel, a group of micro rocket engines would be able to power a 2 m high launch vehicle that could be used to deliver a micro satellite in low Earth orbit.
1.1.2 Description of the concept of the micro rocket engine
The objective of the micro rocket engine program is to design a liquid motor regeneratively cooled, in which the propellants are pressurized using micro turbopumps in an expander cycle. The use of turbopumps to pressurize the propellants eliminates the need for pres-surized tanks, which are a main contribution to weight in current satellite systems. The overall propulsion system will therefore be lighter allowing more payload to be carried.
Propellants are fed to the rocket through valves at low pressures before being pressur-ized up to the required inlet pressure of the cooling passages. The propellants are heated while cooling the rocket chamber and reach supercritical conditions. Part of the propellants enter the turbine to drive the turbopumps. Propellants are then injected in the chamber
for combustion. The products of the reaction expand in the nozzle and produce thrust.
1.1.3 Different components of the micro rocket engine
1.1.3.1 Turbopump
The micro rocket engine design requires the propellants to be pressurized up to 300 atm at the inlet of the cooling passages. The turbopump must provide a 300 atm pressure rise. Moreover, the propellants entering the turbine are under supercritical conditions. There-fore, the turbine is driven by gaseous like propellants whereas the propellants in the pump are in a liquid like state.
It was decided to first design a demonstration turbopump device that would provide a 31
30 atm pressure rise using water as the pumped liquid and gas as the driving fluid for the
turbine. This smaller pressure rise was chosen as a demonstration of the feasibility of the concept but also because it corresponds to the pressure rise that would be required for a boost pump to prevent cavitation from occurring in the main pump. The demo pump, designed by Deux [14], proposes a new concept in which turbine and pump blades are on the same side of a single wafer rotor. The turbopump concept is presented in Figure 1-2.
A hydrostatic thrust bearing provides a seal between the two. This design simplifies the
fabrication process but adds issues mainly about the behavior of the seal between the liquid circuit in the pump and the gas circuit in the turbine. Tests to date have demonstrated a rotation speed of 100,000 rpm with air in the pump and rotation speeds between 25,000 rpm and 65,000 rpm with water [21]. Figure 1-3 presents a layout of the turbopump device. Separate experimental studies on cavitation [26] have shown that cavitation at micro scale
Layer Pump OD 2 mm
#0
pumrp turbine turbine pump
out in Joumnal } Thrust bearn9 out in
pressurization Back plenum
plenum plenum
Figure 1-2: Concept of the turbopump. Cross section of the device [14].
can occur and must be taken into account in the design of the micro turbopump. Micro scale cavitation follows the same theory as at macro scale. However, the performance loss (decrease in AP across the pump) appears to be lower and the erosion less damaging than for macro scale cavitation.
Figure 1-3: Exploded top and bottom views of the turbopump device. The horizontal separation appearing on each layer is not representative of the design and only comes from the rendering14).
Figure 1-4: Micro rocket engine developed and tested in the Gas Turbine Laboratory at MIT [14].
1.1.3.2 Micro rocket chamber
The first micro rocket engine, designed and tested by London
[231,
includes injectors, rocket chamber, nozzle and cooling passages in a 6-wafer - 18 mm long - 13.5 mm wide - 3 mmhigh device. The engine is designed to produce 15 N of thrust at a chamber pressure of
125 atm and a total mass flow of 5 g/s. The specific impulse, which is a characteristic of
the performance of the engine, is estimated around 290 s.
Gaseous oxygen and gaseous methane were chosen as oxidizer and fuel respectively. To demonstrate the feasibility of the concept of a micro rocket engine, the micro rocket engine uses separate propellant and coolant circuits. Propellants are directly injected in the cham-ber and do not participate in the cooling of the device. Cooling is performed by a separate fluid, liquid ethanol. The different design parameters of London's micro rocket engine are summarized in Table 1.1.
The integrity of the chamber and packaging at high pressures and temperatures are the current major issues.
1.1.4 From a gaseous rocket engine to a liquid regeneratively cooled micro rocket engine
Going from the current design to a liquid regeneratively cooled rocket engine requires several modifications. First, the injectors must be modified for liquid rather than gaseous propel-lants. However, the main modification comes from the fact that the liquid propellants are also used as coolants, circulating in the cooling passages before entering the combustion
Characteristics of the micro rocket engine summary
Thrust 15 N
Thrust to weight ratio 1320:1
Isp 307 s
Total mass flow 5 g/s
Fuel Gaseous methane
Oxidizer Gaseous oxygen
Coolant Liquid ethanol
Total coolant flow rate 5 g/s
Chamber pressure 125 atm
Number of wafers 6
Number of injectors per fluid 242
Table 1.1: Summary of the main characteristics of the micro rocket
Heat fluxes in the rocket [W/mm 2
]
Chamber 20
Throat 200
Expansion nozzle 10
engine [23].
Table 1.2: Heat fluxes at different points in the rocket engine [23, p. 97].
chamber. This implies that there is now a link between performance in the combustion chamber and cooling of the device: a trade must be done between high performance and suitability of the propellants as coolants.
Heat loads are critical in the rocket engine design. They have been estimated between 4 kW and 6.5 kW. Table 1.2 summarizes some estimations of the heat fluxes at different points in the rocket engine. In the regeneratively cooled micro rocket engine, the propellants will be under very high heat fluxes and at very high pressures. They will reach supercritical conditions. Their behavior can be quite different under such extreme conditions. Since there is little knowledge of the characteristics of fuels and oxidizers at micro scale under such conditions, experiments must be conducted to characterize their properties under an environment close to what they would experience in the micro rocket engine.
Selection of the propellants for the liquid regeneratively cooled rocket engine requires:
" study of the performance of different combinations of propellants " study of the cooling capacity of the propellants
* estimation of the characteristics of the propellants (density, viscosity, specific heat, heat transfer coefficient, etc) at conditions near to those experienced in the rocket engine
1.2
Background
A study of the performance of different combinations of currently used propellants was done by Protz [27]. The Computer Program for Calculation of Complex Chemical Equilibrium
Compositions and Applications (CEA) was used to compare the specific impulse (Isp), the density specific impulse (Id), which is the Isp weighted by the average density of the pro-pellants, and the temperature reached in the chamber for the different pairs of propellants. Heat transfer experiments were carried out by Lopata [24] on ethanol and by Faust [18] on water and ethanol at supercritical conditions. Dang [131 and Chen [5] have conducted a preliminary study of the behavior of JP7 under high heat fluxes and pressures.
1.3
Objectives
The work presented in this thesis aims at the characterization of the behavior of two hydro-carbons, JP7 and JP10, as potential fuels for the micro rocket engine. Compatibility issues associated with the use of hydrogen peroxide as oxidizer are also addressed.
1.4
Thesis organization
The first chapter has presented the micro rocket engine program and motivated a study of propellants in supercritical conditions for a future selection of the best combination of propellants for the liquid regeneratively cooled micro rocket engine.
Chapter 2 introduces the issues of the selection of a best combination of propellants for the liquid regeneratively cooled micro rocket engine.
Chapter 3 presents the principles of the heat transfer experiments carried out with JP7 and 36
JP1O and gives an overview of the experimental apparatus.
Chapter 4 is dedicated to the study of the behavior of JP7 under high heat fluxes and at high pressures.
Chapter 5 presents the results of the experiments carried out with JP1O and a comparison with JP7 is given.
Chapter 6 presents the study of the compatibility issues associated with hydrogen peroxide. Chapter 7 analyzes the results for future application in the micro rocket engine and gives recommendations for the selection of the final set of propellants.
Chapter 8 summarizes the work presented in this thesis and gives some recommendations for future work.
Chapter 2
Selection process and potential
propellants
2.1
Criteria for selection
Different criteria have to be taken into account for the selection of the best candidate propellants to be used in the liquid regeneratively cooled micro rocket engine.
2.1.1 Performance [27]
The combination of propellants impacts the performance of the rocket. Three parameters are important to study:
" The vacuum specific impulse (Isp) is a common performance measure, a measure of
the fuel efficiency.
" The density specific impulse (Id) is defined as the ratio of the specific impulse to the
average density of the propellants, defined as:
Id = PavISP (2.1)
Pa- Pox Pfuel (1 + a) (2.2)
a Pfuel + Pox
where Isp is the specific impulse, Id the density specific impulse, Pay the average density of the propellants, pox the oxidizer density, pfuel the fuel density, a the oxidizer
to fuel mass ratio. Id takes into account the density of the propellants, the higher the propellant density, the lower the tank volume required and therefore the lighter the tank mass.
e The chamber temperature is also an important factor as it influences the heat load
on the rocket and therefore the cooling of the device.
It must be noted in the evaluation of the performance of the propellants that they will enter the chamber in a supercritical state after having circulated in the cooling passages. The characteristics of the fluid may not be perfectly known in such conditions and the fluid may have experienced decomposition or chemical modifications which may alter the performance.
2.1.2 Capacity as a coolant
Since the engine is regeneratively cooled, the capacity of the propellants to cool the device is a major issue, as important as their performance.
Several parameters are important to characterize the suitability of a propellant as coolant for the micro rocket engine.
" Heat capacity of the fluid: Silicon starts softening around 950 K and a maximum
wall temperature of 900 K has been chosen for the design of the engine. Therefore, depending on the heat capacity of the coolant, cooling passages are designed and sized to keep the wall temperature below 900 K. The design of the cooling passages deals mainly with tailoring the local mass flux (pu) and the cooling surface to maintain an allowable wall temperature. The liquid propellants must have enough cooling capacity to manage to keep the wall temperature below 900 K with the allowable sizes of the passages.
" Stability of the fluid: There are two different types of stability that need to be
considered.
Oscillations in the fluid
Mass flow, temperature and pressure can oscillate in the cooling passages with super-critical fluids. Oscillations are reported to appear at pressures below twice the super-critical
pressure, for a wall temperature above the critical temperature and a bulk temper-ature below the critical tempertemper-ature [9]. The oscillations result from the mixing of the gas-like layer at the wall and the liquid-like bulk fluid in the viscous layer at the wall. Two types of oscillations have been observed in heat transfer experiments with supercritical fuels in macro tubes [9] [8]:
* low frequency Helmholtz oscillations in the range of 1 Hz to 2 Hz; this movement of the fluid is similar to a classical mass-spring-damper model
* high frequency acoustic oscillations in the range of 75 Hz to 450 Hz
The oscillations had higher amplitudes near the critical point and were almost not apparent at critical pressure ratios above 2. Amplitudes of 50 psi and 100 C have been obtained. The onset of the oscillations seems to correspond to an increase in the heat transfer coefficient. Even if they provide a small increase in cooling performance, oscillations are undesirable in a rocket engine. They introduce variations in temper-ature and may imply hot spots and therefore thermal stress concentrations that may form single points of failure. Moreover, oscillations may lead to unstable operation of the engine and therefore a loss of performance. At the pressures experienced in the micro rocket engine, oscillations should not be an issue.
Deposits and decomposition
At high heat fluxes and pressures, the propellants may decompose and form solid deposits. This is a concern especially for hydrocarbons that have a tendency to crack and form non negligible amounts of carbon deposits. First, deposits may clog the cooling passages or injectors. Second, deposits on the walls decrease the heat transfer causing the wall temperature to increase.
2.1.3 Prediction for rocket design
Sufficient knowledge of the characteristics of the propellants is required for the future design of the micro rocket engine. The main characteristics required for the design are the physi-cal properties of the fluid (density, viscosity, and the heat capacity), which characterize the heat transfer performance of the fluid. The level of uncertainty in the estimation of those parameters is an important parameter in the design of the engine.
2.1.4 Other criteria
Other criteria which must be taken into account include:
" Material compatibility with the materials used in the engine system: Com-patibility between rocket propellants and MEMS materials has never been an issue
before. Propellants must be compatible with silicon and all the materials that will be used in the components of the final liquid regeneratively cooled turbopump-fed engine.
" Toxicity: Toxic propellants require special facilities for handling and storage and
therefore increase operational costs and the complexity of the system.
" Storable vs. cryogenic propellants: Storable propellants are preferred to
cryo-genic propellants. Cryocryo-genic propellants require specific facilities increasing engine operation costs.
" Availability: Availability must be sufficient so that the engines can be readily used.
2.2
Introduction to supercritical fluids behavior
Under the very high heat fluxes and pressures experienced in the micro rocket engine, most propellants will be supercritical.
The critical point is defined by a critical pressure and temperature, which depend on the fluid. Critical conditions for some typical fluids are shown in Table 2.1. The critical pressure is the pressure that is needed to condense the fluid to a liquid at the critical temperature. Above the critical temperature the gas cannot be condensed into a liquid regardless of the pressure applied to the substance. Below this temperature, the gas is a condensable vapor. The critical point is illustrated in a (P,T) diagram in Figure 2-1.
A supercritical fluid is a fluid above its critical point, meaning above its critical pressure
and temperature. In a supercritical state, there is no more phase transition between liquid and vapor. The supercritical fluid has physicochemical properties intermediate between those of liquids and gases. Its density, diffusivity and viscosity are closer to those of gases
Fluid Pc [atm] Tc [*C] Water 220.9 374.14 Ethanol 62.55 242.85 JP7 17.7 400 JP10 36.8 H202 214 457
Table 2.1: Critical point for different fluids [18] [15] [29].
Figure 2-1: P-T diagram showing the critical point for a typical fluid [22].
critical
quid
point
gas
0
whereas its solubility is closer to that of a liquid.
Supercritical fluids are characterized by rapid changes in fluid properties in the region of the critical point. Small variations in temperature can correspond to large changes in fluid properties. Density, viscosity and conductivity sharply decrease when reaching critical con-ditions as shown in Figures 2-2, 2-3 and 2-4. The specific heat peaks near the critical point. The temperature at which the maximum Cp is found is called the pseudo critical tempera-ture and is usually slightly above the critical temperatempera-ture.
or E 1200 1000 800 600 400 200 0n
CO2 Properties (T,=304.1K, P,=7.28MPa) at 8 MPa
CFD-ACE(SUPERTRAPP) --- CFD-ACE(Lee-Kesier,1975) -0ASHRAE,1985 Polyakov,1991 - - ----.... ... .- . - . -. -- ---- - ... - ... - ... - ... -... -... - ... - - -- - -...- -. -.. -- .. .... -... --- ... --... --... .. .--- ---- -- - -.-.-- --.-. ... .... .. -... ... ... ... ... ... ... ...-80 100 120 0 20 40 60 Temperature (*C) -40 -20
Figure 2-2: Density variation for C02 as a function of temperature near the critical point [11].
Figure 2-3: Viscosity variation for C02 as a function of temperature near the critical point [11].
44
Figure 2-4: Thermal conductivity variation for C02 as a function of temperature near the critical point [11].
Fluids near the critical point offer an increased cooling capacity. At the pseudo temperature,
Cp increases and reaches a maximum resulting in an increased fluid enthalpy and therefore
an increased heat capacity. Moreover, as viscosity is decreased at supercritical conditions, turbulence is increased, which results in an increase of the heat transfer coefficient of the
fluid.
All these variations in fluid properties are temperature and pressure dependent. Variations
in fluid properties are less drastic as pressure increases above the critical pressure as shown in Figure 2-5 and Figure 2-6 for respectively the density and the viscosity. As pressure increases above the critical pressure, the amplitude of the peak of Cp decreases while the pseudo temperature increases and the peak widens. Figure 2-7 shows a 3D representation of the specific heat as a function of pressure and temperature. The evolution of the Cp profile as pressure and temperature are increased is illustrated in the two graphics on the upper part of Figure 2-7. As pressure increases above the critical pressure, the supercritical enhancement of heat transfer is less apparent and appears at a higher temperature.
A deterioration of the heat capacity has been seen in supercritical fluids at high heat fluxes.
The heat transfer coefficient enhancement due to the supercritical phenomenon is less and less apparent as the heat flux increases above a critical heat flux. Eventually at very high
![Figure 1-4: Micro rocket engine developed and tested in the Gas Turbine Laboratory at MIT [14].](https://thumb-eu.123doks.com/thumbv2/123doknet/14488468.525477/34.918.238.750.106.377/figure-micro-rocket-engine-developed-tested-turbine-laboratory.webp)
![Figure 2-3: Viscosity variation for C02 as a function of temperature near the critical point [11].](https://thumb-eu.123doks.com/thumbv2/123doknet/14488468.525477/44.918.236.700.712.1014/figure-viscosity-variation-function-temperature-near-critical-point.webp)
![Figure 2-4: Thermal conductivity variation for C02 as a function of temperature near the critical point [11].](https://thumb-eu.123doks.com/thumbv2/123doknet/14488468.525477/45.918.220.674.102.409/figure-thermal-conductivity-variation-function-temperature-critical-point.webp)
![Figure 2-6: n-dodecane viscosity as a function of temperature for subcritical, critical and super- super-critical pressures [11]](https://thumb-eu.123doks.com/thumbv2/123doknet/14488468.525477/46.918.218.717.134.483/dodecane-viscosity-function-temperature-subcritical-critical-critical-pressures.webp)
![Figure 2-7: Effects of temperature and pressure on the specific heat of C02 near the critical point (10]](https://thumb-eu.123doks.com/thumbv2/123doknet/14488468.525477/48.918.228.758.249.832/figure-effects-temperature-pressure-specific-heat-critical-point.webp)