1 2
Development of Stereo Vision in Young Infants 3
Martina Röthlisberger & Andrea Frick 4
University of Fribourg 5
6 7
NOTICE: this is the author's version of a work that was accepted for publication in Infancy. 8
Changes resulting from the publishing process, such as editing, corrections, structural formatting, and 9
other quality control mechanisms may not be reflected in this document. This article may be used for 10
non-commercial purposes in accordance with Wiley Terms and Conditions for Use of Self-Archived 11
Versions. 12
A definitive version is published as: 13
14
Röthlisberger, M., & Frick, A. (in press). Development of stereo vision in young infants. Infancy. 15 DOI: 10.1111/infa.12359 16 17 18 Autor Note 19
This research was supported by a grant from the Swiss National Science Foundation 20
#PP00P1_150486. Substantial support came from Dr. med. Thomas Lang and the LANG-21
STEREOTEST AG, who kindly provided us with the stereo test stimuli. We also wish to thank 22
Kate Staehlin for her help with the data collection and coding. 23
The authors declare no conflicts of interest with regard to the funding source for this study. 24
25
Correspondence concerning this article should be addressed to Martina Röthlisberger, 26
Department of Psychology, University of Fribourg, 1701 Fribourg, Switzerland. 27
E-mail: martinaroe@gmail 28
Abstract 29
In this study, infants’ visual processing of depth-inducing stimuli was tested using a new 30
method suitable for experimental settings. Stereograms of the Lang-Stereopad® were 31
presented in a timed preferential-looking paradigm to determine infants’ preference for a 32
stereogram as compared to a stimulus not inducing an impression of depth. A total of 80 33
infants were tested at 7 months of age; of these, a sub-sample of 41 infants were tested 34
longitudinally at 4 and 7 months to characterize the developmental trajectory of their 35
preference. Infants were simultaneously presented with a card showing a random-dot 36
stereogram (800” disparity) and a similar looking dummy card without stereogram. In the 37
total sample, 7-month-olds showed a clear preference for the stereogram regardless of sex. In 38
the longitudinal sample, 7-month-olds but not 4-month-olds looked significantly longer to the 39
stereogram as compared to the dummy card. On individual level, 56% of the 4-month-olds, 40
and 85% of the 7-month-olds predominantly looked at the stereogram. The findings yield 41
evidence for a clear developmental progression, and show that the test cards of the Lang-42
Stereopad® prototype provide a viable instrument to determine the preference for depth-43
inducing stimuli in young infants when used in a controlled experimental setting. 44
Development of Stereo Vision in Young Infants 45
Depth perception and accurate distance estimation is fundamental in human daily life 46
and relevant for basic activities such as locomotion in a three-dimensional environment, eye-47
hand coordination, and tool use. Monocular (pictorial) depth cues such as relative size, 48
interposition, or linear perspective can provide some information about the three-dimensional 49
environment. However, binocular depth perception, also known as stereopsis, yields largely 50
superior information and is necessary for calculating exact size and distance information. 51
In spite of its important role in processing three-dimensional (3D) sensory input, 52
binocular depth perception is rarely considered in developmental studies that present stimuli 53
and events in a 3D context. However, the lack of binocular depth perception may affect 54
infants’ and young children’s performance in such studies. Lacking binocular depth 55
perception may also reduce infants’ interest in 3D stimuli, and hence bias the results of 56
studies that measure looking times. It is therefore crucial for developmental research to 57
identify infants with impaired binocular depth perception. However, measuring binocular 58
depth perception in young children poses a considerable challenge for clinicians and 59
researchers, as tests are mainly designed for adults and older children (Fricke & Siderov, 60
1997). 61
In the present study, we presented test cards of the Lang-Stereopad® prototype to 62
young infants in a timed preferential-looking paradigm and assessed their preference for a test 63
card that evokes an impression of depth in an observer with functional stereopsis. By testing a 64
large group of 7-month-olds, who had not been diagnosed with visual deficiencies, we first 65
aimed to establish whether this method is suitable for testing infants in an experimental 66
setting, and whether the results are comparable with findings of previous studies using 67
different paradigms. By additionally testing a subgroup of infants longitudinally at 4 and 68
again at 7 months of age, we investigated the development of this preference across an age 69
range that is of major interest with respect to the development of visual perception, object 70
recognition, and mental rotation. Major progression in the development of stereopsis could be 71
expected in this age range based on previous research, as described in the following. 72
Development of Binocular Depth Perception 73
Binocular depth perception results from processing information from both eyes, 74
comparing the slightly different retinal images that arise when a distal stimulus is projected 75
onto each retina. This disparity between the two images is due to the horizontal distance of 50 76
to 75mm between the eyes in humans. If this disparity is small, the images are typically fused; 77
if it is large, no fusion of the two images is possible and double “diplopic” images are seen. 78
Nevertheless, diplopic images may still provide the observer with depth information (Wilcox 79
& Allison, 2009). Disparities are measured in minutes (’) and seconds (”) of arc. The upper 80
threshold for image fusion in adults is at about 3600” (Ogle, 1952a, 1952b). The term 81
stereopsis refers to the ability to process depth information from both fused and non-fused 82
images. 83
Stereopsis is not present at birth and typically emerges during the first year of life 84
(Birch, Gwiazda, & Held, 1982; Birch & Petrig, 1996; Birch, Shimojo, & Held, 1985; Held, 85
Birch, & Gwiazda, 1980; Norcia & Gerhard, 2015). Research using binocular visual evoked 86
potentials has suggested that brain cells that are sensitive to differences in disparity may be 87
present in different visual areas of the cortex as early as 2 months of age (Amigo, Fiorentini, 88
Pirchio, & Spinelli, 1978). It has been hypothesized that younger infants have superimposed 89
percepts from each eye (Shimojo, Bauer, O'Connell, & Held, 1986). However, Brown and 90
Miracle (2003) found that infants as young as 6 weeks old preferred a fusible stimulus over a 91
non-fusible one. In the same vein, at 8 weeks of age, infants have been found to prefer a 92
fusible stereogram with horizontal disparity over a non-fusible stereogram with vertical 93
disparity (Kavšek, 2013), and 9-week-olds have been shown to look longer to a stereogram 94
compared to a stimulus evoking a blurred impression of depth (Wattam-Bell, 2003). This 95
suggests that infants have some sensitivity to binocular depth information before 4 months of 96
age. Binocular fusion still improves gradually up to 21 weeks of age with maturation of 97
oculomotor control (Thorn, Gwiazda, Cruz, Bauer & Held, 1994) and with growing contrast 98
sensitivity (Brown, Lindsey, Satgunam, & Miracle, 2007). 99
In a seminal study, Held et al. (1980) found evidence for coarse stereopsis from an 100
average of 4 months on, which was confirmed in subsequent studies. For example, Birch et al. 101
(1982) tested whether 2- to 12-month-olds looked longer at a pattern that provoked an illusion 102
of depth – which can only be seen with functional stereo vision – as compared to a similar 103
pattern that did not induce an impression of depth. At 4 months, 62% of the infants looked 104
longer at a depth-inducing pattern at a very large disparity (58’). At 6 months, 100% of the 105
infants looked longer at a depth-inducing pattern at disparities from 58’ to 6’. Birch and Petrig 106
(1996) used a similar preferential-looking paradigm and also found that 60% of the 4- to 5-107
month-olds looked longer at depth-inducing patterns of varying disparities. This percentage 108
increased to 80% at 6 months, and reached 100% by 7 months of age. In a similar vein, Braun 109
and Kavšek (2018) showed that the percentage of infants looking longer at a depth-inducing 110
pattern showing a novel shape increased from 56% to 72% between 4 and 5 months. 111
Yonas, Arterberry, and Granrud (1987) tested 4-month-old infants for their recognition 112
of objects, as well as their sensitivity to disparity. Infants were first habituated to moving, 113
solid objects and tested for sensitivity to disparity with the same method as used by Held et al. 114
(1980). Results indicated that, in the group of infants who showed a sensitivity to disparity, 115
looked significantly more at the novel object, whereas infants without disparity sensitivity 116
looked equally at the two objects. These findings suggested that 4-month-old infants who 117
were sensitive to disparity in the displays were also able to extract object information from 118
binocular cues and not only responded to disparity per se. 119
In a large-scale behavioral study, Birch and Salomao (1998) identified 80% of 95 120
tested 4-month-olds as showing stereopsis at a disparity of 1735” or less (with a mean of 2.75 121
log sec, which corresponds to 562”). From 6 months on, virtually all infants showed 122
stereopsis at a disparity of 1584” or less. Moreover, Birch et al. (2005) found evidence for 123
stereopsis in 4-month-old infants at a disparity of 600”, and in 6-month-old infants at a 124
disparity of 200” when measured with random dot stereograms (see below). Thus, at 4 months 125
of age, infants can typically process stereograms with a disparity of 600” or more. 126
Taken together, the above studies suggest, that stereo vision is typically acquired 127
between 4 and 7 months of age. However, fine stereopsis or stereoacuity, i.e., the depth 128
perception arising from very small disparities, develops continuously throughout the entire 129
childhood (Ciner, Schanel-Klitsch, & Scheiman, 1991), and an adult level of stereoacuity is 130
not achieved before adolescence (Giaschi, Narasimhan, Solski, Harrison, & Wilcox, 2013; for 131
an overview see Norcia & Gerhard, 2015). 132
Yet, the development of stereopsis is disrupted in some children, which – if untreated 133
– may result in visual deficits and restricted processing of spatial information in a three-134
dimensional context (Fawcett, Wang, & Birch, 2005; Simonsz, Kolling, & Unnebrink, 2005). 135
Incomplete or lacking stereopsis may also have a negative influence on the development of 136
eye-hand coordination (Fielder & Moseley, 1996). Critically, children with reduced stereopsis 137
– particularly in connection with decreased near visual acuity – score significantly worse in 138
visual-motor integration assessments and visual attention tasks (Kulp et al., 2017). Identifying 139
infants with impaired binocular depth perception is therefore of central importance, as it may 140
also affect developmental progression in other domains. 141
Measuring Depth Perception 142
Stereopsis is typically measured using stereograms (Fricke & Siderov, 1997; 143
Westheimer, 2013). A stereogram is a two-dimensional image giving rise to an impression of 144
depth in the observer. This is achieved by presenting two disparate images to the left and the 145
right eye. For example, in random-dot stereograms, which were introduced by Julesz and 146
Miller (1962), two almost identical images filled with randomly arranged dots are used. The 147
difference of the images consists in a predefined region that has been displaced slightly 148
against the background. Whereas the contour or shape of the displaced region is not 149
discernable monocularly, the separate presentation of the two images to each eye results in 150
perception of the displaced region as either closer to or further away from the observer with 151
respect to the random-dot image. This evokes the simultaneous perception of depth and shape. 152
The separation of the two images is usually achieved by either viewing black and white dots 153
on a polarized surface through polarizing glasses, or by viewing red and green dots through 154
red-green glasses. 155
Even though a multitude of random-dot stereo tests exist, few are suitable for young 156
infants. In practice, two main types of random-dot stereograms are used for children and 157
infants: contour stereo displays and plain random-dot stereograms. Contour stereo displays, 158
such as the classical Titmus Fly Stereotest (Stereo Optical Co.), contain monocular contour 159
cues – a feature that may bias the results in the sense that individuals without stereopsis may 160
be able to distinguish the target from the distractor stimulus. Plain random-dot stereograms, 161
such as the Randot Stereo Smile Test “Happy Face” (Ciner, Schanel-Klitsch, & Herzberg, 162
1996), the Random-Dot E (Stereo Optical Co.), the Lang Stereotest® (Lang & Lang, 2018), 163
or the TNO Stereotest (Lameris Ootech) do not contain such monocular cues and require 164
adequate binocular fusion. Therefore, these stereo tests are better suited for experimental and 165
clinical use (Ciner et al., 1996; Fricke & Siderov, 1997). 166
Yet, most of the above random-dot stereo tests require the use of viewing devices such 167
as polarizing or red-green glasses, which may be problematic when used with young infants. 168
Calloway, Lloyd, and Henson (2001) for example, reported moderate goggle tolerance in the 169
age groups from 2 to 4 months (66%) and from 8.5 months to 13 months (69%). Birch and 170
Salomao (1998) reduced the problem by using polarized filters mounted in soft foam frames; 171
yet, panographic stereograms, such as the versions I and II of the Lang-Stereotest® (Lang 172
Stereotest AG, Küsnacht, Switzerland), completely avoid it. 173
The Lang-Stereotest consists of a set of random-dot stereograms (Lang & Lang, 2018). 174
The two images of each stereogram have been sliced and intertwined into one image, which is 175
covered by a transparent layer (known as lenticular sheet) with a three-dimensional surface 176
structure in the form of parallel half-cylinders acting as prims. Under each half-cylinder lies a 177
pair of image slices, of which one slice is projected to the left eye and one to the right eye, 178
due to the prism effect of the cylinders. Observation of the test card from reading distance (35 179
to 40cm) evokes the impression of depth and the perception of a shape (e.g., a star) popping 180
out from the image. Although the lenticular sheet may reduce the contrast of the black-and 181
white random dot images, it has the advantage that the participants’ eyes are clearly visible. 182
Therefore, infants’ looking direction can be observed more precisely than with viewing 183
devices. 184
The Lang Stereotest has previously been applied successfully in infants and children 185
from 6 to 72 months (Pai et al., 2012). Within the age group of 6- to 12-month-olds, 92% 186
could be tested with the Lang Stereotest, but only 50% completed the Stereo Smile Test. In a 187
study that compared different tests in 28 children under 2 years (Broadbent & Westall, 1990), 188
only 2 children under the age of 12 months were willing to wear glasses, whereas 50% 189
completed the Lang Stereotest. In the present study, we thus used one card of the Lang-190
Stereopad®, a newly developed prototype version using the same technology as the Lang-191
Stereotests I and II. Whereas the Lang Stereotests I and II show four stereograms of different 192
disparities on the same card, the Lang Stereopad contains square cards, each presenting only 193
one stereogram. It is thus particularly suitable for use in a preferential-looking paradigm. The 194
Lang Stereopad has recently been tested on 217 children with suspected minimal esotropy 195
between the ages of 3 and 10 years. It showed a high specificity and sensitivity, and higher 196
predictive value as compared to the Lang Stereotest I (Piantanida, 2019). 197
Preferential-Looking Paradigm 198
In many of the stereopsis studies with infants, a two-alternative preferential-looking 199
paradigm was applied. In the classic preferential-looking paradigm, infants are presented with 200
pairs of stimuli that differ in one specific aspect such as shape or pattern (Fantz, 1961). 201
Typically, a few trials of fixed duration are administered, and a naive observer measures the 202
infant’s looking time to both stimuli (Kavšek, 2013). The proportion of the looking time 203
directed to the target in relation to the total looking time is calculated. This proportion is then 204
averaged across a number of trials with counterbalanced target location, in order to obtain a 205
preference score. Another widely used paradigm in infant vision research is the forced-choice 206
preferential-looking paradigm or “FPL” (Birch et al., 1982; Birch et al., 1985; Birch & Petrig, 207
1996; Dobson, Teller, Lee, & Wade, 1978; Held et al., 1980; Teller, 1979). In FPL, multiple 208
short trials are conducted, and trial durations are not fixed. The trials last until the observer 209
judges which stimulus has been preferred by the infant. The preference score in this case is an 210
average of the observer’s binary judgements across the trials. Classic and FPL paradigms are 211
widely used in infant research and in assessments of visual acuity. According to Kavšek 212
(2013), both yield comparable results.
213
In the present study, we used a commercially available stereotest and presented it in a 214
timed preferential-looking paradigm, which was based on looking-time measurement. A 215
random-dot stereogram card from the prototype of the Lang-Stereopad® was presented along 216
with a similarly looking dummy card without a stereogram. Infants’ looking times were 217
measured online during the experiment and also coded offline from video recordings by a 218
second naïve rater in order to determine inter-rater reliability. We expected infants who are 219
sensitive to binocular depth information to look longer at the stereogram, as this would be 220
more informative than the dummy card and thus attract their attention. Based on previous 221
literature, this could be expected for the majority of infants at the age of 7 months. By testing 222
some of the infants longitudinally at 4 and 7 months of age, we aimed to characterize the 223
developmental trajectory of infants’ processing of binocular depth cues. Furthermore, by 224
comparing the results with findings of previous studies using different paradigms should yield 225
valuable information on the usefulness of this method for testing infants in an experimental 226 setting. 227 Methods 228 Participants 229
A total of 80 full-term healthy infants (38 girls, 42 boys) were tested. Two additional 230
infants (2.4%) had to be excluded for fussiness. All infants were tested at 7 months of age 231
(mean age = 7 months, 19 days, SD = 8 days, range: 7 months, 1 days – 8 months, 7 days). A 232
sub-sample consisting of 41 infants (19 girls, 22 boys) were tested longitudinally, at 4 months 233
(T1, mean age = 4 months, 19 days, SD = 7 days, range: 4 months, 5 days – 4 months, 30 234
days) and at 7 months of age (T2, mean age = 7 months, 20 days, SD = 8 days, range: 7 235
months, 7 days – 8 months, 7 days). The two samples did not differ significantly with regards 236
to sex, χ2(1, N = 121) = 0.02 p = .904, nor mean age at T2, t(119) = 1.16, p = .25. Four 237
additional infants were tested at T1 but were not available at T2. 238
The infants were recruited via maternities of local hospitals, nurseries, baby 239
workshops, and an office for family planning. The families were predominantly from middle-240
class background and lived near or in a small city in Switzerland. All infants were 241
accompanied by their mother or father. Infants were rewarded with a small toy and a diploma. 242
The present study was conducted according to guidelines laid down in the Declaration of 243
Helsinki, with written informed consent obtained from a parent or guardian for each child 244
before any assessment or data collection. All procedures in this study were approved by the 245
Internal Review Board of the University of Fribourg (reference # 154). 246
Stimuli and Apparatus 247
Test cards of the prototype of the new Lang Stereopad® (Lang Stereotest AG, 248
Küsnacht, Switzerland) were used as stimuli. One of the cards displayed a random-dot 249
stereogram of a 5-pointed star with an outer diameter of 2 cm. This stereogram was presented 250
at a disparity of 800”. This disparity was chosen based on reports of Birch et al. (2005), 251
showing a mean stereoacuity of 600”as measured by randot stereograms in a large sample of 252
4-month-olds. The stereogram (target) card was always presented together with a dummy 253
(distractor) card. This dummy card was created by the manufacturer of the Lang Stereopad, 254
had the same physical characteristics and showed a dot pattern similar to the stereo card, 255
except that it did not contain a stereogram. (The dummy card can now be purchased for a 256
small production fee.) Both the stereo and the dummy card measured 6.4cm x 6.4cm, were 257
printed with 600 points per inch, and were covered by a lenticular sheet with 60 half-cylinders 258
per inch. These half-cylinders acted as lenses, each of which was 0.432 mm wide, resulting in 259
a dot size of 0.432 mm. Viewing distance was about 30 cm, resulting in a visual angle of 297” 260
per dot. The illuminance on the stimuli was 60 lux on average, which corresponds to a 261
luminous intensity of about 587 candelas at a distance of 30 cm. The cards were presented 262
with lenticular half cylinders running in the vertical direction, which is necessary for 3D 263
perception. To ensure that the cards are viewed from the same horizontal angle (which should 264
not exceed 27°), the cards were arranged one above the other, on a vertical panel (40.5 x 40.5 265
cm). The top card was located at 7 cm from the top of the panel, the bottom card at 7.5 cm 266
from the bottom of the panel. The distance between the lower edge of the top card and the 267
upper edge of the bottom card was 11.5 cm. A hole of 4 cm diameter for the camera was 268
situated exactly in the center between the cards. There were vertical slits of 2 cm height and 1 269
cm width in the panel, 2 cm to the left and right of the cards. These openings were covered 270
with a black, semi-transparent fabric, through which a blinking colored LED could be seen 271
during attention getting. These LED lights were mounted on a background panel, which was 272
placed behind the panel with the cards. Panels were coated with black self-adhesive felt. For 273
an illustration, see Figure 1. 274
The panels were mounted inside a puppet stage of 41 cm height, 59 cm width, and 41 275
cm depth. All visible parts of the puppet stage were covered with black felt. The front opening 276
of 28 x 32 cm could be closed by a sideways sliding screen, in order to exchange the panels 277
out of the infant’s view. A black curtain hung from the ceiling and fully enclosed the front of 278
the puppet stage and the seat with the caregiver and the infant, thus hiding the experimenter 279
who exchanged the panels through the ceiling of the puppet stage. 280
Infants were seated on their parents’ lap at about 30 cm distance from the 281
stereograms in front of the puppet stage. A white high-density LED chain illuminated the 282
inside of the puppet stage. It was placed behind and around the front opening, so that it would 283
not blind the infant but evenly illuminate the stimuli. A standard lamp was directed towards 284
the ceiling of the experimental room. 285
Video recording was done with a Sony DCR-AX33 camcorder capturing the infant’s 286
face through the 4-cm hole in the center of the panels. The night-shot function of the camera 287
was turned on allowing for clearer observation of the infant’s looking direction. The 288
experiment was controlled by a MATLAB® script (MATLAB and Statistics Toolbox Release 289
2014b, The MathWorks, Inc., Natick, Massachusetts, United States). Puppet stage light onset 290
and offset was controlled by an Arduino UNO R3® board with the Arduino IDE 1.8.5 291
Software (https://www.arduino.cc/en/Main/Software) by way of MATLAB® Support 292
Package for Arduino® Hardware. The colored LEDs on the background panel were activated 293
manually. 294
295
Figure 1. Schematic depiction of the experiment flow (showing one out of 296
two possible orders). The white arrows were not visible for the infants. 297
298
Design 299
Infants saw two trials: In one trial, the stereogram was at the top and the dummy card 300
at the bottom; in the other trial, the stereogram was at the bottom and the dummy card at the 301
top. The order of these two trials was counterbalanced between participants, so that about half 302
of the infants in each sample saw the stereogram at the top in the first trial and at the bottom 303
in the second trial, and half of the them saw the inverse order. 304
Procedure 305
Throughout the experiment, two experimenters were present: a desktop operator 306
coding the infants’ looking times online, and a stage operator presenting the stimuli. While 307
the participants were being seated, only the background panel with the blinking colored LEDs 308
was visible and a cheerful music was playing. The desktop operator ensured that the infant 309
was ready, dimmed the ceiling light and closed the curtain. Then, the stage operator closed the 310
screen, slid in the first panel, and opened the screen again. The desktop operator observed the 311
live camera feed of the infant’s face on a monitor and started the trial as soon as the infant 312
looked steadily at the panel. At the trial start, the music stopped, and the stage operator turned 313
off the blinking LEDs. The stage light turned on, rendering the two stimulus cards visible. 314
While being unaware of the stereogram position, the desktop operator registered the infant’s 315
looking to the top card, to the bottom card, and away. Maximal trial duration was 30 seconds, 316
in order to allow infants plenty of time to recognize the stereogram. However, trials were 317
terminated if infants lost interest in both of the cards and looked away for 2 consecutive 318
seconds after the first 6 seconds of a trial had elapsed. After the first trial, the stage operator 319
closed the screen and replaced the panel with the one presenting the cards in the opposite 320
locations, which took an average of 8.25 s (SD = 1.85 s). Then, the second trial was presented 321
analogously. Trials were not repeated. 322
Results 323
Reliability 324
Trained but naïve second coders analyzed 95% of the videos of infants’ looking 325
behavior offline using Datavyu (Datavyu Team, 2014). They coded the times infants looked 326
(a) toward the stereogram, (b) toward the dummy card, or (c) anywhere else. One-way 327
random intraclass correlation (ICC) analyses were used to assess inter-rater agreement, 328
because several second coders were involved (Landers, 2015). The average ICC of (a) and (b) 329
was excellent both at T1, ICC(36, 35) = .96, p < .001, and at T2, ICC(73, 74) = .96, p < .001 330
(Cronbach’s alpha = .96 at both timepoints). 331
Total Sample 332
The infants in the total sample on average looked at the stimuli for 6.58 s (SE = 0.41) 333
in the first test trial, and 5.62 s (SE = 0.39) in the second test trial, which did not differ 334
significantly, t(79) = 1.76 p = .082, Cohen’s d = 0.27. To assess the 7-month-olds’ individual 335
looking preferences, their looking times toward the stereogram and the dummy card was 336
analyzed. Infants’ looking times were averaged across the two test trials, in order to account 337
for a possible bias to preferentially look at the top or bottom card. In addition, a relative 338
preference score was calculated as the percentage of looking towards the stereogram in 339
relation to the total looking time (i.e., the sum of the looking time to the stereogram and the 340
dummy cards). 341
Out of 80 infants, 58 (28 girls, 30 boys) looked longer to the stereogram than to the 342
dummy card (i.e., had a relative preference score > 50%), which is significantly different from 343
an equal distribution (binomial test, p < .001; Figure 2). Boys and girls did not differ 344
significantly in their preference for the stereogram or the dummy card, χ2 (1, N = 80) = 0.051, 345
p = .821. 346
347
348
Figure 2. Looking times to the stereogram as a function of total looking times in 7-349
month-olds (N = 80). The dotted line indicates equal looking times to both cards. 350
351
Next, we analyzed whether the infants as a group looked significantly longer at the 352
stereogram compared to the dummy card. Using IBM® SPSS® Statistics 25.0, a repeated-353
measures ANOVA was performed, with mean looking times as the dependent variable. The 354
position of the stereogram (top vs. bottom) and card (stereogram vs. dummy) were entered as 355
within-participant variables, sex and order (card with stereogram at top first vs. card with 356
stereogram at bottom first) as between-participant variables. In addition, permutation tests 357
were performed using R (R Core Team, 2014) as looking time data deviated from a normal 358
distribution. The p values resulting from permutation tests are reported in square brackets. 359
The ANOVA revealed a significant main effect of card, F(1, 76) = 36.75, p < .001 [permuted 360
p <.001], η2 = 0.33, indicating that infants looked significantly longer at the stereogram (M = 361
3.70 s, SE = 0.2) than at the dummy card (M = 2.42 s, SE = 0.2). A significant effect of the 362
position of the stereogram, F(1, 76) = 6.02, p = .016 [permuted p = .025], η2 = 0.07, indicated 363
that looking times were longer when the stereogram was at the bottom position (M = 3.47 s, 364
SE = 0.3) as compared to the top position (M = 2.65 s, SE = 0.2). Furthermore, the analysis 365
yielded an interaction of card and order, F(1, 76) = 5.99, p = .017 [permuted p = .015], η2 = 366
0.07. Post hoc comparisons with Sidak corrections showed that infants in the condition that 367
presented the stereogram at the top position first and at the bottom position second looked 368
significantly longer to the stereogram (M = 4.07 s, SE = 0.3) compared to the dummy card (M 369
= 2.26 s, SE = 0.2, p < .001). Likewise, infants who saw the stereogram at the bottom position 370
first also looked longer to the stereogram (M = 3.34 s, SE = 0.3) than to the dummy card (M = 371
2.57 s, SE = 0.2, p = .01), but the looking time difference was not as large. No other main 372
effect or interaction was found (all Fs < 2.95, all ps > .08 [all permuted ps > .08], all η2 < 373
0.04).1 374
Similar analyses were conducted with preference scores as dependent variables. 375
First, it was analyzed whether the overall preference score was significantly different from 376
50%, which would indicate an unequal distribution of looking times across the two cards. A t 377
1 An analogous ANOVA that excluded infants whose looking time per trial did not exceed 2s (remaining n = 75)
yielded the same significant effects. Most crucially, the main effect of card was still significant, F(1, 71) = 31.47,
test indicated that the average preference score of 61% (SD = 16%) was significantly different 378
from 50%, t(79) = 5.99, p < .001, Cohen’s d = 0.67. Then preference scores were analyzed by 379
means of an ANOVA with the same independent variables as above, except for the variable 380
card which was now obsolete due to the use of the preference scores. The ANOVA yielded a 381
significant interaction of stereogram position and order, F(1, 76) = 4.41, p = .04 [permuted p 382
= .04], η2 = 0.06, which was due to a higher preference for the stereogram in the top position 383
for infants who saw the stereogram at the top first (M = 0.68, SE = 0.05) compared to those 384
who saw the stereogram at the bottom first (M = 0.5, SE = 0.05, p = .011); yet, preference 385
scores did not differ for the stereograms in the bottom position (p = .848). No other main 386
effect or interaction was found, all Fs < 3.46, all ps > .07 [all permuted ps > .07], all η2 < 0.04. 387
388
Longitudinal sub-Sample 389
The longitudinal sub-sample included 41 infants from the total sample, who 390
were tested twice, a first time at 4 months (T1) and a second time at 7 months (T2) of 391
age. This sub-sample did not differ in their preference for the stereogram at T2 from 392
the sub-sample of 39 infants who were only tested cross-sectionally, t(58.46) = 1.64, 393
p = .106, Cohen’s d = 0.37. Again, there was no significant difference between the 394
looking times in the first trial (M = 5.66 s, SE = 0.67), and the second trial (M = 4.59 395
s, SE = 0.44) at T1, t(40) = 1.52, p = .137, Cohen’s d = 0.29, nor at T2 (first trial: M 396
= 6.81 s, SE = 0.66; second trial: M = 6.17, SE = 0.57), t(40) = 0.72, p = .479, 397
Cohen’s d = 0.16. 398
Table 1 and Figure 3 show the number of infants who predominantly (> 50% 399
of the total time) looked to the stereogram or the dummy card at T1 and T2. The 400
looking preference of boys and girls did not differ at T1, χ2 (1, N = 41) = 0.17, p = 401
.678, nor at T2, χ2 (1, N = 41) = 0.04, p = .846. A significantly larger number of 402
infants showed a preference for the stereogram at T2 than at T1 (McNemar test: p = 403
.004). Table 1 also shows the changes in the preference for the stereogram from T1 404
to T2. Whereas 51% of the infants showed a preference for the stereogram both at 4 405
and 7 months (column labeled s/s), 34% apparently developed a preference for the 406
stereogram between 4 and 7 months (column d/s). However, 10% of the infants 407
looked longer at the dummy card at both time points (d/d), and 5% showed a 408
preference for the stereogram at 4 but not at 7 months of age (s/d). 409
410
Table 1 411
Number (and percentage) of infants looking longer to the stereogram (s) or the 412
dummy card (d) and changes from 4 months (T1) to 7 months of age (T2) in the 413 longitudinal sub-sample. 414 T1 T2 Changes from T1 to T2 Sex d s d s d/d d/s s/s s/d Total female 9 (22) 10 (24) 3 (7.5) 16 (39) 2 (5) 7 (18) 9 (22) 1 (2.5) 19 (46) male 9 (22) 13 (32) 3 (7.5) 19 (46) 2 (5) 7 (18) 12 (29) 1 (2.5) 22 (54) Total 18 (44) 23 (56) 6 (15) 35 (85) 4 (10) 14 (34) 21 (51) 2 (5) 41 (100) Note: n = 41 415 416 417
Figure 3. Average looking times to the stereogram as a function of total looking 418
times in the longitudinal sub-sample (n = 41) at 4 months (A) and at 7 months (B) of 419
age. The dotted line indicates equal looking times to both cards. 420
421
To investigate the developmental progression of infant’s stereogram 422
preference at group level, a repeated-measures ANOVA was performed, with 423
timepoint (T1 vs. T2), stereogram position (top vs. bottom), and card (stereogram vs. 424
dummy) as within-subject variables, and sex and order (card with stereogram at top 425
first vs. card with stereogram at bottom first) as between-subject variables. Again, 426
permutation tests were performed, and the resulting p-values are reported in squared 427
brackets. A first analysis showed no effects or interactions with sex or order (all Fs < 428
2.19, all ps > .14 [all permuted ps > .18], all η2 < 0.06), nor with stereogram position 429
(all Fs < 3.42, all ps > .07 [all permuted ps > .06], all η2 < 0.09); therefore, these 430
variables were not considered in the following analysis. 431
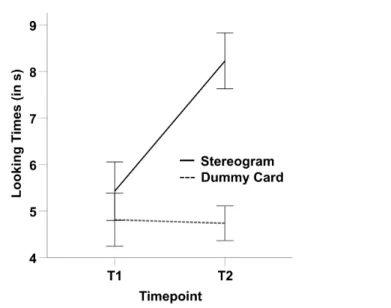
An ANOVA with timepoint (T1 vs. T2) and card (stereogram vs. dummy) as 432
within-subject variables yielded significant main effects of card, F(1, 40) = 13.42, p 433
= .001 [permuted p < .001], η2 = 0.25, and timepoint, F(1, 40) = 5.63, p = .023 434
[permuted p = .024], η2 = 0.12, as well as an interaction of card and timepoint, F(1, 435
40) = 13.73, p = .001 [permuted p = .001], η2 = 0.26 (Figure 4). Post hoc 436
comparisons with Sidak correction showed that at T1, infants looked equally long to 437
the stereogram (M = 5.43 s, SE = 0.6) and the dummy card (M = 4.81 s, SE = 0.6, p = 438
.450). In contrast, at T2 infants looked significantly longer to the stereogram (M = 439
8.23 s, SE = 0.6) than to the dummy card (M = 4.74 s, SE = 0.4, p < .001). Moreover, 440
post hoc tests showed that looking times to the stereogram increased significantly 441
between T1 and T2 (p = .001), whereas looking times to the dummy card did not (p = 442 .902)2. 443 444 445
Figure 4. Means of cumulated looking times across the two trials at T1 and T2. Error 446
bars indicate +/- 1 standard error. 447
Again, a preference scores was calculated for both timepoints. At T1, infants 448
on average looked to the stereogram 54% (SD = 26) of the time, which was not 449
significantly different from an equal distribution, t(40) = 1.08, p = .287, Cohen’s d = 450
0.17. In contrast at T2, infants looked at the stereogram 64% (SD = 11) of the time, 451
which differed significantly from 50%, t(40) = 8.00, p < .001, Cohen’s d = 1.25. An 452
ANOVA was carried out with preference scores as a dependent variable and 453
timepoint and stereogram position as within-participant variables (sex and order 454
again showed no significant effects or interactions and were therefore omitted). The 455
2An analogous ANOVA that excluded infants whose looking time in each trial did not exceed 2s (remaining n =
29) yielded similar results, except that the main effect of timepoint was no longer significant (F < 1). Crucially, the interaction of timepoint and card was still significant, F(1,28) = 9.34, p = .005, η2 = 0.25. Thus, it is unlikely
that the developmental increase in looking longer to the stereogram between T1 and T2 was merely caused by a few infants with very short looking times or due to an age difference in attention span.
analysis resulted in a significant main effect of timepoint, F(1, 40) = 4.85, p = .034 456
[permuted p = .037], η2 = 0.11 , and an interaction between timepoint and stereogram 457
position, F(1, 40) = 5.9, p = .020 [permuted p = .018], η2 = 0.13. Yet, the main effect 458
for the stereogram position was not significant, F(1, 40) = 0.004, p = .949 [permuted 459
p = .953], η2 < 0.001. Pairwise comparisons (Sidak corrected) showed that especially 460
when the stereogram was at the top position, the preference scores at T1 (M = 0.45, 461
SE = 0.05) were significantly lower than at T2 (M = 0.65, SE = 0.04, p = .002). When 462
the stereogram was at the bottom position, preference scores were also lower at T1 463
(M = 0.55, SE = 0.04) than at T2 (M = 0.56, SE = 0.04), but this was not statistically 464 significant (p = .872). 465 466 Discussion 467
The development of infants’ visual processing of depth-inducing stimuli was 468
investigated by presenting infants with stereograms of the Lang Stereopad® prototype, in a 469
timed preferential-looking paradigm. Of the 80 infants tested at 7 months of age, 58 (72.5%) 470
looked longer to the stereogram as compared to a dummy card devoid of depth cues. Our 471
findings thus indicate that at the age of 7 months, a majority of infants prefer to look at a 472
stimulus giving an impression of depth. 473
Previous studies found that 100% of 7- to 8-month-olds could be classified as having 474
stereopsis at various disparities from 58’ to 1’ (Birch et al., 1982; Birch et al., 1985; Held et 475
al., 1980). Compared to these studies, the percentage of infants in our total sample who 476
looked predominantly at the stereogram was considerably lower, which may have several 477
reasons. First, we did not test the infants for oculomotor status or refractive errors beforehand, 478
whereas these former studies only included infants within the normal range regarding 479
refractive errors such as myopia (nearsightedness), hyperopia (farsightedness), or astigmatism 480
(irregularity of the cornea or the lens). Large scale vision screenings show that in a healthy 481
population, about 5-6% of infants between 7 and 9 months have refractive errors, which may 482
impair the development of stereopsis (Atkinson et al., 1996). It is therefore possible that our 483
sample included infants with atypical or delayed development. 484
A second reason may lie in the stimulus presentation, as Birch et al. (1982; 1985), and 485
Held et al. (1980) did not use random-dot stereograms. They rear-projected black-and-white 486
bar stereograms on a screen, and disparity was achieved through polarizing filters on the 487
stereo-projector and glasses worn by the infants. It is conceivable that their high contrast 488
stimuli might have attracted the infants’ gaze more than the stereo cards used in the present 489
study. 490
A third reason for the lower percentage of stereo-sensitive infants in our sample may 491
lie in the low dropout rate (2.4%). Whereas in the present study, infants were presented with 492
only two trials, some of the previous studies presented a much larger number of trials. 493
Unfortunately, most of them did not report their dropout rates. In the studies that did report 494
dropout rates, twice to ten times as many infants did not complete all trials and were excluded 495
from analyses (Birch et al., 1985; Braun & Kavšek, 2018). It is possible that these infants had 496
no impression of depth and got bored earlier. Such a selective dropout of infants not 497
perceiving the stereograms could have resulted in a disproportionately large percentage of 498
infants showing a preference for the stereogram in the analyzed sample. 499
A further methodological difference may lie in the use of a forced-choice preferential-500
looking procedure in the cited studies (Birch et al., 1982; Birch et al., 1985; Held et al., 1980; 501
Thorn et al., 1994), whereas the present study applied a preferential-looking method that was 502
based on looking time measurement.The excellent inter-rater agreement in the present study 503
suggests that this measure was highly reliable and objective. 504
Results from the longitudinal sample further showed that 56% of the infants exhibited 505
a preference for the stereogram over the dummy card at 4 months of age and 85% at 7 months 506
of age. The proportion of infants developing a preference for a stereogram between 4 and 7 507
months of age is roughly consistent with the developmental trajectory outlined by Birch et al. 508
(1982) and Held et al. (1980; Birch et al., 1982; Held et al., 1980). Their results showed a 509
steep increase in the preference for a stereogram, as compared to a stimulus without disparity, 510
from about 40% of the infants at 4 months, to 100% at 8 months of age. In our sample, about 511
half of the infants who showed a preference for the stereogram at 7 months did so already at 4 512
months, and a third of them seemed to have develop a preference for the stereogram between 513
4 and 7 months. However, four infants did not show a preference for the stereogram at either 514
timepoint, and two showed a preference for the stereogram at 4 but not at 7 months of age. It 515
is conceivable that these infants may have had problems with binocular vision or shown false 516
positive results. 517
Given the young starting age of our longitudinal sample, it should also be considered 518
whether some of the younger infants may not have had the necessary visual acuity to 519
recognize the stereogram. In a longitudinal study, Sokol (1978) presented 27 infants between 520
2 and 7 months of age with checkerboard patterns with check sizes from 7.5 to 90’ at the 521
retina. Visual evoked potentials were measured to determine visual acuity. As a group, the 522
infants showed a rapid improvement in acuity from about 9’ at 2 months, to 4’ at 4 months, 523
and 1’ at 7 months. Thus, because the dot size of 4.95’ (297”) in the Lang stereograms is 524
larger than 4’, the stereogram should be discernible for 4- and 7-month-old infants. 525
Analyses of looking times on group level further confirmed that 7-month-olds in the 526
total sample looked significantly longer at the stereogram than at the dummy card. Group 527
analyses also confirmed that the preference for the stereogram increased significantly from 4 528
to 7 months of age in the longitudinal sample, as reflected in an interaction of card and 529
timepoint in the analyses of looking times, and in a main effect of timepoint in the analyses of 530
preference scores.. In fact, infants looked significantly longer to the stereogram than the 531
dummy card at 7 months of age, but there was no significant looking time difference at 4 532
months of age (Figure 4). Total looking time also increased from T1 to T2, however this 533
increase was solely due to an increase in looking to the stereogram, whereas looking time to 534
the dummy card stayed the same across the two timepoints. In light of the specificity of this 535
increase, it is rather unlikely that a general increase in visual attention span was responsible 536
for the present results. This interpretation is further supported by the fact that the results did 537
not change if infants with very short looking times were excluded from the analyses. The 538
preference for the stereogram was distributed equally among girls and boys both at 4 and 7 539
months of age, and we found no sex differences on group level. Findings of earlier studies 540
have indicated a slightly earlier onset of stereopsis for girls than for boys (i.e., at 9.1 and 12.1 541
weeks, respectively, in Gwiazda, Bauer, and Held, 1989, and at 11.6 and 13.5 weeks in Thorn 542
et al., 1994). Yet, the earlier onset of stereopsis in girls does not appear to influence the ability 543
to extract depth information from stereograms at a later age, as none of the studies by Held et 544
al. (1980), Birch et al. (1982; 1985), Gwiazda et al. (1989), and Thorn et al. (1994) yielded a 545
sex difference at 18 weeks or older. The absence of an effect of sex in the present study is 546
thus in line with these findings. 547
Group analyses further showed that looking times were generally longer when the 548
stereogram was presented at the bottom position, and they also yielded significant interactions 549
with stereogram position or order. These variables were likely to affect looking times in an 550
infant study due to effects of postural control and familiarization. However, as we fully 551
counterbalanced these variables across participants, and the effects went in the same direction 552
and were just smaller in one condition, they were not pertinent to our interpretations. 553
Finally, it should be considered that infants may have been sensitive to the disparity of 554
the stereogram per se, rather than reacting to a perceived shape. Although this possibility 555
cannot be ruled out complete based on the present design, there is evidence from previous 556
studies suggesting that even young infants are able to recognize the shape of an object based 557
on 3D cues. For example, in a study by Yonas et al. (1987), 4-month-old infants who were 558
sensitive to disparity also recognized an object shape based on binocular depth cues, but not 559
infants who did not display a sensitivity for disparity. On the same subject, Braun and Kavšek 560
(2018) reported that at 5 months, infants preferentially looked at a novel shape as compared to 561
a familiar shape on a stereogram. If the infants had only reacted to the disparity per se, they 562
would not have shown any preference for the novel object, since both the known and the 563
novel object had the same disparity. These results suggest that, at least by the age of 5 564
months, infants are able to process 3D cues provided in stereograms in order to recognize an 565
object shape. They thus support the assumption that the 7-month-old infants in the present 566
study showed a preference for the object shape on the stereogram and were not only attracted 567
by the disparity. 568
Conclusion 569
In the present study, stereo cards of the Lang-Stereopad® were presented in a timed 570
preferential-looking paradigm to 80 infants at the age of 7 months, and roughly half of the 571
infants were also tested at 4 months of age. To our knowledge, the present study is the first to 572
investigate the usability of a commercially available stereo test in a standardized experimental 573
setting and with a large sample of young infants. The number of infants showing a preference 574
for the stereogram increased significantly from 4 to 7 months of age, and this increase was 575
also reflected in group analyses, showing a significant interaction of timepoint of testing and 576
looking to the stereo card. As no children were excluded and the drop-out rate was very low, 577
the present findings may be considered as representative. Moreover, the excellent inter-rater 578
agreement indicated that this new method allows for reliable and objective measurement, even 579
though it is highly efficient and can easily be combined with other assessments. Thus, the test 580
cards of the Lang-Stereopad® are well suited for application in an experimental setting and 581
provide an easily available instrument for assessing very young infants’ sensitivity to depth-582
inducing stimuli in future research. 583
References 585
Amigo, G., Fiorentini, A., Pirchio, M., & Spinelli, D. (1978). Binocular vision tested with visual 586
evoked potentials in children and infants. Investigative Ophthalmology & Visual Science, 587
17(9), 910–915. 588
Birch, E. E., & Salomao, S. (1998). Infant random dot stereoacuity cards. Journal of Pediatric 589
Ophthalmology & Strabismus, 35(2), 86–90. 590
Birch, E. E., Shimojo, S., & Held, R. (1985). Preferential-looking assessment of fusion and stereopsis 591
in infants aged 1-6 months. Investigative Ophthalmology & Visual Science, 26(3), 366–370. 592
Birch, E., & Petrig, B. (1996). FPL and VEP measures of fusion, stereopsis and stereoacuity in normal 593
infants. Vision Research, 36(9), 1321–1327. https://doi.org/10.1016/0042-6989(95)00183-2 594
Birch, E., Gwiazda, J., & Held, R. (1982). Stereoacuity development for crossed and uncrossed 595
disparities in human infants. Vision Research, 22(5), 507–513. https://doi.org/10.1016/0042-596
6989(82)90108-0 597
Birch, E., Morale, S., Jeffrey, B., O’Connor, A., & Fawcett, S. (2005). Measurement of stereoacuity 598
outcomes at ages 1 to 24 months: Randot® Stereocards. Journal of American Association for 599
Pediatric Ophthalmology and Strabismus, 9(1), 31-36. 600
https://doi.org/10.1016/j.jaapos.2004.11.013 601
Braun, S., & Kavšek, M. (2018). Infants perceive two-dimensional shape from horizontal disparity. 602
Infant Behavior & Development, 52, 140–145. https://doi.org/10.1016/j.infbeh.2018.07.003 603
Broadbent, H., & Westall, C. (1990). An evaluation of techniques for measuring stereopsis in infants 604
and young children. Ophthalmic and Physiological Optics, 10(1), 3–7. 605
https://doi.org/10.1111/j.1475-1313.1990.tb01097.x 606
Brown, A. M., Lindsey, D. T., Satgunam, P., & Miracle, J. A. (2007). Critical immaturities limiting 607
infant binocular stereopsis. Investigative Ophthalmology & Visual Science, 48(3), 1424– 608
1434. https://doi.org/10.1167/iovs.06-0718 609
Brown, A. M., & Miracle, J. A. (2003). Early binocular vision in human infants: Limitations on the 610
generality of the Superposition Hypothesis. Vision Research, 43(14), 1563–1574. 611
https://doi.org/10.1016/S0042-6989(03)00177-9 612
Calloway, S. L., Lloyd, I. C., & Henson, D. B. (2001). A clinical evaluation of random dot 613
stereoacuity cards in infants. Eye, 15(5), 629–634. https://doi.org/10.1038/eye.2001.198 614
Ciner, E. B., Schanel-Klitsch, E., & Scheiman, M. (1991). Stereoacuity development in young 615
children. Optometry and vision science: official publication of the American Academy of 616
Optometry, 68(7), 533-536. https://doi.org/10.1097/00006324-199107000-00004 617
Ciner, E. B., Schanel-Klitsch, E., & Herzberg, C. (1996). Stereoacuity development: 6 months to 5 618
years. A new tool for testing and screening. Optometry and Vision Science, 73(1), 43–48. 619
https://doi.org/10.1097/00006324-199601000-00007 620
Dobson, V., Teller, D. Y., Lee, C. P., & Wade, B. (1978). A behavioral method for efficient screening 621
of visual acuity in young infants. I. Preliminary laboratory development. Investigative 622
Ophthalmology & Visual Science, 17(12), 1142–1150. 623
Fantz, R. L. (1961). The origin of form perception. Scientific American, 204(5), 66–73. 624
Fawcett, S. L., Wang, Y.-Z., & Birch, E. E. (2005). The critical period for susceptibility of human 625
stereopsis. Investigative Ophthalmology & Visual Science, 46(2), 521–525. 626
https://doi.org/10.1167/iovs.04-0175 627
Fielder, A. R., & Moseley, M. J. (1996). Does stereopsis matter in humans? Eye, 10(2), 233–238. 628
https://doi.org/10.1038/eye.1996.51 629
Fricke, T. R., & Siderov, J. (1997). Stereopsis, stereotests, and their relation to vision screening and 630
clinical practice. Clinical and Experimental Optometry, 80(5), 165–172. 631
https://doi.org/10.1111/j.1444-0938.1997.tb04876.x 632
Giaschi, D., Narasimhan, S., Solski, A., Harrison, E., & Wilcox, L. M. (2013). On the typical 633
development of stereopsis: fine and coarse processing. Vision Research, 89, 65-71. 634
https://doi.org/10.1016/j.visres.2013.07.011 635
636
Gwiazda, J., Bauer, J., & Held, R. (1989). Binocular function in human infants: Correlation of 637
stereoptic and fusion-rivalry discriminations. Journal of Pediatric Ophthalmology and 638
Strabismus, 26(3), 128–132. https://doi.org/10.3928/0191-3913-19890501-08 639
Held, R., Birch, E., & Gwiazda, J. (1980). Stereoacuity of human infants. Proceedings of the National 640
Academy of Sciences, 77(9), 5572–5574. https://doi.org/10.1073/pnas.77.9.5572 641
Julesz, B., & Miller, J. E. (1962). Automatic stereoscopic presentation of functions of two variables. 642
Bell System Technical Journal, 41(2), 663–676. https://doi.org/10.1002/j.1538-643
7305.1962.tb02424.x 644
Kavšek, M. (2013). The onset of sensitivity to horizontal disparity in infancy: A short-term 645
longitudinal study. Infant Behavior & Development, 36(3), 329–343. 646
https://doi.org/10.1016/j.infbeh.2013.02.002 647
Kulp, M. T., Ciner, E., Maguire, M., Pistilli, M., Candy, T. R., Ying, G.-S., . . . Moore, B. (2017). 648
Attention and visual motor integration in young children with uncorrected hyperopia. 649
Optometry and Vision Science: Official Publication of the American Academy of Optometry, 650
94(10), 965–970. https://doi.org/10.1097/OPX.0000000000001123 651
Landers, R. (2015). Computing intraclass correlations (ICC) as estimates of interrater reliability in 652
SPSS. The Winnower, 2:e143518.81744, 1–4. https://doi.org/10.15200/winn.143518.81744 653
Lang, J. I., & Lang, T. J. (2018). Eye screening with the Lang Stereotest. American Orthoptic Journal, 654
38(1), 48–50. https://doi.org/10.1080/0065955X.1988.11981769 655
Norcia, A. M., & Gerhard, H. E. (2015). Development of three-dimensional perception in human 656
infants. Annual Review of Vision Science, 1, 569–594. https://doi.org/10.1146/annurev-657
vision-082114-035835 658
Ogle, K. N. (1952a). Disparity limits of stereopsis. Archives of Ophthalmology, 48(1), 50–60. 659
https://doi.org/10.1001/archopht.1952.00920010053008 660
Ogle, K. N. (1952b). On the limits of stereoscopic vision. Journal of Experimental Psychology, 44(4), 661
253–259. https://doi.org/10.1037/h0057643 662
Pai, A. S.-I., Rose, K. A., Samarawickrama, C., Fotedar, R., Burlutsky, G., Varma, R., & Mitchell, P. 663
(2012). Testability of refraction, stereopsis, and other ocular measures in preschool children: 664
The Sydney Paediatric Eye Disease Study. Journal of AAPOS: The Official Publication of 665
the American Association for Pediatric Ophthalmology and Strabismus, 16(2), 185–192. 666
https://doi.org/10.1016/j.jaapos.2011.09.017 667
Piantanida, A. (2019, June). Statistical evaluation in pediatric patients of the new Lang Stereopad test: 668
A preliminary report. Manuscript submitted for publication. 669
R Core Team. (2014). R: A language and environment for statistical computing: R Foundation for 670
Statistical Computing. Retrieved from http://www.R-project.org/ 671
Shimojo, S., Bauer, J., O’Connell, K. M., & Held, R. (1986). Pre-stereoptic binocular vision in infants. 672
Vision Research, 26(3), 501–510. https://doi.org/10.1016/0042-6989(86)90193-8 673
Simonsz, H. J., Kolling, G. H., & Unnebrink, K. (2005). Final report of the early vs. late infantile 674
strabismus surgery study (ELISS), a controlled, prospective, multicenter study. Strabismus 675
13(4), 169–199. https://doi.org/10.1080/09273970500416594 676
Sokol, S. (1978). Measurement of infant visual acuity from pattern reversal evoked potentials. Vision 677
research, 18(1), 33-39. https://doi.org/10.1016/0042-6989(78)90074-3 678
Teller, D. Y. (1979). The forced-choice preferential looking procedure: A psychophysical technique 679
for use with human infants. Infant Behavior and Development, 2, 135–153. 680
https://doi.org/10.1016/S0163-6383(79)80016-8 681
Thorn, F., Gwiazda, J., Cruz, A. A., Bauer, J. A., & Held, R. (1994). The development of eye 682
alignment, convergence, and sensory binocularity in young infants. Investigative 683
Ophthalmology & Visual Science, 35(2), 544–553. 684
Wattam-Bell, J. (2003). Motion processing asymmetries and stereopsis in infants. Vision Research, 685
43(18), 1961-1968. https://doi.org/10.1016/S0042-6989(03)00282-7 686
Westheimer, G. (2013). Clinical evaluation of stereopsis. Vision Research, 90, 38–42. 687
https://doi.org/10.1016/j.visres.2012.10.005 688
Wilcox, L. M., & Allison, R. S. (2009). Coarse-fine dichotomies in human stereopsis. Vision 689
Research, 49(22), 2653–2665. https://doi.org/10.1016/j.visres.2009.06.004 690
Yonas, A., Arterberry, M. E., & Granrud, C. E. (1987). Four-month-old infants' sensitivity to 691
binocular and kinetic information for three-dimensional-object shape. Child Development, 692
58(4), 910-917. https://doi.org/10.2307/1130531 693