HAL Id: hal-03011501
https://hal.archives-ouvertes.fr/hal-03011501
Submitted on 19 Nov 2020
HAL is a multi-disciplinary open access
archive for the deposit and dissemination of
sci-entific research documents, whether they are
pub-lished or not. The documents may come from
teaching and research institutions in France or
abroad, or from public or private research centers.
L’archive ouverte pluridisciplinaire HAL, est
destinée au dépôt et à la diffusion de documents
scientifiques de niveau recherche, publiés ou non,
émanant des établissements d’enseignement et de
recherche français ou étrangers, des laboratoires
publics ou privés.
probes targeted to Aβ amyloid aggregates
Alexandre Oliveira, Telma Costa, Licinia Justino, Rui Fausto, Jean-François
Morfin, Éva Tóth, Carlos Geraldes, Hugh Burrows
To cite this version:
Alexandre Oliveira, Telma Costa, Licinia Justino, Rui Fausto, Jean-François Morfin, et al..
Photo-physical studies on lanthanide( iii ) chelates conjugated to Pittsburgh compound B as luminescent
probes targeted to Aβ amyloid aggregates. Photochemical & Photobiological Sciences , Royal Society
of Chemistry, 2020, 19 (11), pp.1522-1537. �10.1039/D0PP00214C�. �hal-03011501�
ARTICLE
Received 00th
January 20xx,
Accepted 00th January 20xx DOI: 10.1039/x0xx00000x
Photophysical studies on lanthanide(III) chelates conjugated to
Pittsburgh compound B as luminescent probes targeted to
Aβ amyloid aggregates
Alexandre C. Oliveira,a Telma Costa,a Licinia L. G. Justino,a Rui Fausto,a Jean‑François Morfin,b Éva
Tóth,b Carlos F. G. C. Geraldes,a,c,d* Hugh D. Burrowsa*
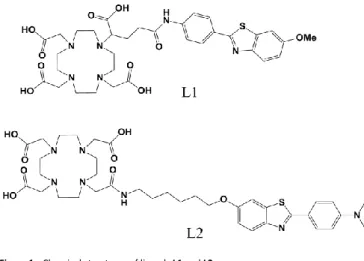
The photophysical properties of Eu3+ and Tb3+ complexes of DOTAGA and DO3A-monoamide conjugates of the Pittsburgh
compound B (PiB) chromophore, prepared using linkers of different lengths and flexibilities, and which form stable negatively charged (LnL1), and uncharged (LnL2) complexes, respectively, were studied as potential probes for optical detection of amyloid aggregates. The phenylbenzothiazole (PiB) moiety absorbs light at wavelengths longer than 330 nm with a high molar absorption coefficient in both probes, and acts as an antenna in these systems. The presence of the luminescent Ln3+ ion quenches the excited states of PiB through an energy transfer process from the triplet state of PiB to
the metal centre, and structured emission is seen from Eu3+ and Tb3+. The luminescence study indicates the presence of a 5D4→T1 back transfer process in the Tb3+ complexes. It also provides insights on structural properties of the Eu3+ complexes,
such as the high symmetry environment of the Eu3+ ion in a single macrocyclic conformation and the presence of one water
molecule in its inner coordination sphere. The overall quantum yield of luminescence of EuL1 is higher than for EuL2. However, their low values reflect the low overall sensitization efficiency of the energy transfer process, which is a consequence of the large distances between the metal center and the antenna, especially in the EuL2 complex. DFT calculations confirmed that the most stable conformation of the Eu3+ complexes involves a combination of a square
antiprismatic (SAP) geometry of the chelate and an extended conformation of the linker. The large calculated average distances between the metal center and the antenna point to the predominance of the Förster energy transfer mechanism, especially for EuL2. This study provides insights into the behavior of amyloid-targeted Ln3+ complexes as optical probes, and
contributes towards their rational design.
Keywords: Aβ amyloid, Eu(III) and Tb(III) luminescent probes, DOTAGA, Pittsburgh compound B, DFT calculations.
1. Introduction
Alzheimer’s disease (AD) is one of the most frequent disorders in elderly individuals, characterized by progressive neural
degeneration causing devastating cognitive impairment.1,2 Its
prevalence increases gradually from about 5% at 65 years to 30% at 85 years old.3 The two major neuropathological
hallmarks of AD are neurofibrillary tangles (NFT) and extracellular amyloid β plaques (Aβ). The amyloid cascade hypothesis assumes that Aβ plaques, which start to form about 10 to 20 years before the first clinical symptoms of the disease, are responsible for the patient’s impairment and death.4 They
are insoluble extracellular deposits, mainly composed of the Aβ1-40 and Aβ1-42 peptides cleaved from the amyloid precursor
protein (APP) overexpressed in the disease, which block the synaptic cleft. However, there is evidence indicating that toxicity in AD is caused by intermediate soluble aggregates, such as oligomers and protofibrils, rather than by the amyloid plaques, probably due to their interaction with biological membranes.5–7
In only 5% of AD cases, is the disease autosomal dominant3 due
to specific mutations,8,9 and the diagnosis of this familiar form
is easily obtained by identification of these mutations. However, in the dominant 95% sporadic AD cases final diagnosis is only obtained by post-mortem brain histological detection of amyloid plaques using a dye which selectively binds to them.10
a.University of Coimbra, Coimbra Chemistry Centre (CQC), Department of Chemistry,
3004-535 Coimbra, Portugal
b.Centre de Biophysique Moléculaire, CNRS, UPR 4301, Université d’Orléans, Rue
Charles Sadron, 45071 Orléans Cedex 2, France
c. University of Coimbra, Department of Life Sciences, Calçada Martim de Freitas,
3000‑393 Coimbra, Portugal
d.CIBIT/ICNAS - Instituto de Ciências Nucleares Aplicadas à Saúde, Pólo das Ciências
da Saúde, Azinhaga de Santa Comba, 3000-548 Coimbra, Portugal
*Address correspondence to:
Carlos F. G. C. Geraldes, Department of Life Sciences, University of Coimbra, Calçada Martim de Freitas, 3000‑393 Coimbra, Portugal; Tel. +351239240730; Email: geraldes@ci.uc.pt
Hugh D. Burrows, Department of Chemistry, University of Coimbra, 3004-535 Coimbra, Portugal; Email: burrows@ci.uc.pt
Electronic supplementary information (ESI) available: Fig. S1 - Absorption,
fluorescence spectra, fluorescence excitation spectra of the ligands; Fig. S2- Fluorescence decay profiles and their fitting for the ligands and their La3+, Eu3+ and
Tb3+ complexes; Fig. S3 - Absorption spectra of ligands in PBS obtained at increasing
irradiation times at 350 nm; Fig. S4 – Absorption, luminescence excitation and luminescence spectra of the Tb3+ complexes in PBS, collected with excitation
wavelengths of 330 nm and 360 nm, respectively, at T = 298 K. See DOI: 10.1039/x0xx00000x
Current clinical diagnosis is based on cognitive tests, only effective in advanced stages showing evident cognitive decline. The development of imaging probes for in vivo detection of the amyloid plaques could allow early diagnosis of AD and provide possibilities of monitoring new therapeutic strategies.7 A major
hurdle in the development of probes and drugs for the central nervous system is the difficulty of crossing the blood-brain barrier (BBB) to reach the brain parenchyma. Some empirical rules have been listed, indicating that the compounds should have low molecular mass and a good lipid solubility.11,12 In some
cases, such as brain cancer, the BBB is weakened and can be readily permeable.13 It can also be artificially disrupted by
hyperosmotic solutions using mannitol, a vasoactive compound. However, this approach can only be used in studies of animal models. Other delivery strategies have used ultrasound and micro-bubbles for transiently opening the BBB. Brain delivery of an imaging probe can be also increased by covalently conjugating it to natural polyamines, such as putrescine, spermine or spermidine, or using lipid soluble agents, carrier proteins, or proteins that can be transported by mediator receptors involved in endocytosis and transcytosis mechanisms.14
In the field of in vivo imaging of AD, the most significant progress so far has been the development of radiolabeled small-molecule agents capable of entering the brain and specifically targeting plaques and tangles, and their detection by positron emission tomography (PET) or single-photon emission computerized tomography (SPECT). Some small organic molecules, such as benzothiazoles and stilbenes, labeled with the positron emitters 18F or 11C, have shown good affinity
towards amyloid aggregates, accompanied by efficient BBB
crossover.15–17 [18F]Florbetapir was the first
radiopharmaceutical approved, in 2012, by the FDA for the specific detection of amyloid deposits by PET.18 Another
radiopharmaceutical widely tested for this purpose is the benzothiazole Pittsburg compound B (PiB) labeled with 11C. This
Thioflavin T (ThT) derivative is currently in phase 3 clinical trials for PET detection and treatment monitoring of AD.19 These
molecules are used as standards for comparison with other potential biomarkers for PET detection.20 The PET detection of
amyloid plaques using [11C]PIB and [18F]Florbetapir has shown
the capability to differentiate between patients having a mild cognitive impairment and those having high risk of developing AD.21,22 Another approach uses a metal ion radioisotope
complexed by a suitable ligand, which is coupled via a spacer to an amyloid-targeting moiety.23 Several 68Ga-based probes have
been reported recently, including conjugates of 68Ga(III)
complexes of DOTA (1,4,7,10-
tetraazacyclo-dodecane-1,4,7,10-tetraacetic acid) or DTPA
(diethylenetriaminepentaacetic acid), exhibiting high in vitro affinity for Aβ aggregates and fibrils, but with very limited brain uptake in in vivo AD animal models.22,24-26 Other reported
potential Aβ-targeted PET probes are based on 64Cu-labeled
bifunctional chelates conjugated to stilbenes,27 as well as 99mTc-based complexes for SPECT detection,28–31 some of which
showed reasonable brain uptake and affinity towards β-amyloid plaques.
Several Magnetic Resonance Imaging (MRI) contrast agents (CAs) have also been developed, based on iron oxide nanoparticles or Gd3+ complexes conjugated to the Aβ peptide,
intact or covalently bound to a polyamine,32–35 or to PiB,36–39 as
vectors to target the amyloid aggregates. However, this approach is limited by low BBB permeability of the probes in animal models.
Optical imaging is a sensitive technique with detection in the picomolar probe concentration range. This can be used alone or combined with other modalities, such as MRI or computer tomography (CT). Congo Red (CR) and ThT are commonly used for specific staining of amyloid plaques in post-mortem examinations.20 Luminescent probes also show considerable
potential for in vivo imaging applications. The requirements for an efficient luminescent agent for AD involve good optical properties, low toxicity and capability of crossing the BBB and targeting plaques. The charged dyes CR and ThT do not cross the BBB in vivo, as opposed to their neutral analogues Chrysamine G (CG)40 and PiB.19 Conjugated polymers, oligomers
and polyelectrolytes show excellent properties for detecting amyloid aggregates.41 For example, luminescent conjugated
polymers have been shown to detect discrete structural differences between protein aggregates, possibly associated with conformational changes on their backbones,42 while
oligothiophenes have been used for in vitro and in vivo imaging of protein aggregates in cerebral amyloidosis.43,44 These
oligomers may also be useful as therapeutic agents for reducing the pool of toxic species.45 Luminescent metal complexes also
show considerable potential both as optical probes to detect amyloid aggregation and as inhibitors of amyloid formation.27
Examples include dipyridophenazine ruthenium(II),46 which is
not luminescent in aqueous solution, but shows a strong photoluminescence in the presence of Aβ fibril aggregates. The main drawback of optical imaging is that light, especially in the UV/Vis region, does not penetrate deeply into tissues, due to light absorption and auto-fluorescence, such that this technique is useful mainly for superficial tissues. Lanthanide complexes show excellent luminescence properties, with spectra consisting of sharp peaks characteristic of each Ln3+ ion,
involving electronic states with long lifetimes in the µs-ms range, which makes them good choices as optical probes for a variety of chemical and biological systems.47,48 Their long
lifetimes allow the development of time-resolved techniques to eliminate scattering and the short-lived fluorescence background. The major problems with Ln3+ ions as optical
probes are their low intrinsic molecular absorption coefficients, which can be overcome by the design of efficient organic antennae for sensitized Ln3+ based luminescence.49 The Ln3+
luminescence covers a wide spectral range, such as the UV region for Gd3+ complexes, which is not biologically useful, and
the UV/Vis for Eu3+ and Tb3+. Recently, Ln3+ ions emitting in the
near infrared (NIR), such as Er3+ and Yb3+, have generated great
interest, especially when using sensitized luminescence with absorption and emission in the NIR region.50 This minimizes
tissue background scattering and auto-fluorescence resulting from the direct excitation of biological constituents like
hemoglobin, making possible the signal detection of deeper tissues in the spectral window between 650 to 1350 nm (the so-called therapeutic window), where human tissues have higher light transmission.51–53
In the present work, we report the potential of the Eu3+ and Tb3+
complexes of two previously reported macrocyclic ligands (L1 and L2) (Figure 1) as probes for optical imaging of aggregated beta amyloid peptides. The ligand L1 is a H5DOTAGA (1,4,7,10-
tetraazacyclo-dodecane-1,4,7-triacetic acid-10-glutaric acid) chelator conjugated with the PiB molecule through its amino group, forming negatively charged lanthanide complexes (LnL1) at physiologically relevant pH values.54 L2 is a
DO3A-monoamide derivative conjugated to the hydroxyl group of PiB, forming neutral lanthanide complexes (LnL2).55 The L1
and L2 chelators are expected to form thermodynamically very stable and kinetically inert complexes with Ln3+ ions. Gd3+
complexes of ligands of these types have been extensively studied as potential MRI contrast agents and some of their radiolabeled complexes were used in nuclear imaging studies (PET/SPECT).56-58 The PiB moiety endows the probes with
specific affinity towards Aβ aggregates and, by absorbing in the visible spectral window through the conjugated π system, acts as an antenna for sensitizing Ln3+ luminescence. The
photophysical properties of the antenna have been evaluated in the absence of the metal ions and in the complexes. The luminescence study provides information on structural features such as coordination geometry and metal hydration. The determination of the overall luminescence quantum yield and the overall efficiency of energy transfer are useful to evaluate the optical probe efficiency, and could be correlated with the distance between the antenna and the metal center as determined by DFT computation. Based on the results of this study, future synthetic work should be directed towards optimizing the photophysical properties of the Eu3+ complexes.
2. Materials and Methods
2.1. Reagents, general equipment and solutions
The trivalent lanthanide chlorides were obtained from Sigma-Aldrich and deuterium oxide (99.9% D) was obtained from
Euriso-top®. The other chemicals were purchased from Sigma-Aldrich and used without further purification. Ligands L1 and L2 were synthesized as previously reported.54-55 The Ln3+
complexes of the two ligands were prepared by mixing solutions of trivalent lanthanide chlorides and the ligand in equimolar quantities and adjusting the pH to 5.5 using aqueous NaOH solutions (10 or 100 mM). The pH measurements were carried out with a Crison micropH 2000 pH meter, coupled to a SemTix Mic pH 014/0 electrode. The solutions were allowed to react for 24 h at 60°C while the pH was regularly controlled. The presence of free metal ion was checked in each sample using the xylenol orange test.59 This was continued until the test was negative,
confirming full Ln3+ complexation. The concentrations of the
paramagnetic complexes were quantified by the NMR Evans method.60,61 The 1H NMR spectra were obtained on a Varian
VNMRS 600 MHz (14.09 T) spectrometer operating at 600.14 MHz.
2.2. UV-Vis spectrophotometry
The acquisition of the absorption spectra of the L1 and L2 ligands and of their complexes in aqueous solutions, the determination of molar absorption coefficients and the spectrophotometric analysis of the photodegradation of the two ligands were carried out at room temperature using Spectronic Unicam UV500 and Secoman® Uvikon XL UV/Vis spectrophotometers.
2.3. Photodegradation studies
A photodegradation study of the two ligands was undertaken using a Semi-Micro photochemical reactor (Applied Photophysics), in which 10 mM sodium phosphate buffer aqueous solutions (pH= 7.4) of ligands L1 or L2 were placed in a cell with an optical path of 1 cm and irradiated at 350 nm. UV-Vis absorption spectra were registered at different irradiation times.
2.4. Steady-state fluorescence and luminescence measurements
The ligand emission, excitation (collected at the maximum emission wavelength) and lanthanide luminescence spectra were obtained at room temperature with a Cary Eclipse (Varian) fluorescence spectrophotometer using the Varian Cary Eclipse software (version 1.1). The spectra obtained were not corrected for the instrumental response. The emission and excitation spectra at 77 K were recorded on a Fluorog 3.2.2 (Horiba-Jovin-Yvon) fluorimeter and these were corrected for the wavelength response of the system.
The ligand fluorescence quantum yields (𝜙F) and the overall
luminescence quantum yields (𝜙LLn) were determined by a
comparative method62 using quinine sulfate (λex = 366 nm,
𝜙F = 0.546 in 0.5 M H2SO4 degassed solution)63 and
tris(bipyridine)ruthenium(II) chloride ([Rubpy3]Cl2, 𝜙 =0.02861
in air-equilibrated aqueous solution)64, respectively. The
fluorescence quantum yields were determined using the equation:65
𝜙𝐹cp=∫ I(λ)cpdλ ∫ I(λ)𝑟𝑒𝑓dλ× ODref ODcp× 𝑛cp2 𝑛ref2 × 𝑓descp
𝑓desref× 𝜙𝐹ref (1)
where ∫ I(λ)xdλ is the integrated area under the emission
spectra of the sample (cp) and of the reference compound (ref); ODx are the optical densities of the ref and cp at the excitation
wavelength; nx is the solvent refractive index in which the cp and the ref were dissolved (𝑛H2O 1.333, 𝑛D2O= 1.328 and
𝑛H2SO4, 0.5M=1.338)); 𝑓des
𝑥 is the degassing factor, which takes
into account the effect of oxygen dissolved in the sample on the fluorescence intensity. Since the 𝜙F values of the compounds
were determined using optically matched solutions of the sample and reference compounds, the ODcp/ODref ratio
equals 1. At the excitation wavelength used, the OD was kept between 0.1-0.2 in order to avoid inner filter effects. Additionally, the samples were previously degassed, thus fcp/fref =1.
The luminescence and luminescence excitation spectra were recorded using the following experimental conditions: number of flashes = 5, delay time = 100 μs, gate time =1 ms, excitation slit = 20 nm, emission slit = 2.5 nm for the Eu3+ complexes,
emission slit = 5 nm for the Tb3+ complexes, increment
times = 0.3 nm, averaging time = 0.1 s and a photomultiplier voltage of 800 V for the LnL1 complexes and 950 V for the LnL2 complexes. The luminescence excitation spectra were collected at the maximum emission wavelength (616 nm for the Eu3+
complexes and 545 nm for the Tb3+ complexes). We found that
the emission shutter with the delayed time used was not able to eliminate completely the fluorescence emission. To overcome this, the baseline was corrected.
The measurements of luminescence lifetimes were made in deionized water (H2O) and deuterium oxide (D2O). The
luminescence decay times were obtained after 10 flashes, with delay time of 100 µs, gate time of 10 µs, excitation slit of 20 nm and emission slit of 10 nm. The photomultiplier voltage was kept at 1000 V and the decay curves were obtained from the average of 100 decays. The excitation was done at the maximum of the absorption spectrum and the emission was monitored at 701 nm for the Eu3+ complexes and 587 nm for the Tb3+
complexes. The decay curves were fitted with a mono-exponential function, and the luminescence lifetimes were obtained from the average of three independent samples.
2.5. Time-resolved Fluorescence
Picosecond time-resolved fluorescence measurements were performed using a home-built picosecond TCSPC (Time Correlated Single Photon Counting)66 apparatus. For ligand L1
and respective complexes excitation was made at 339 nm using a picoLED as excitation source. For ligand L2 and respective complexes the excitation source consisted of a picosecond Spectra Physics mode-lock Tsunami laser (Ti: sapphire) model 3950 (repetition rate of about 82 MHz, tuning range
700−1000 nm), pumped by a Millennia Pro-10s,
frequency-doubled continuous wave (CW), diode pumped, solid-state laser (λem = 532 nm). A harmonic generator model
GWU-23PS (Spectra-Physics) was used to produce the second and third harmonic from the Ti:sapphire laser exciting beam
frequency output. The samples were measured with excitation at 372 nm, and the horizontally polarized output beam from the GWU (second harmonic) was first passed through a ThorLabs depolarizer (WDPOL-A) and subsequently through a Glan-Thompson polarizer (Newport 10GT04) with vertical polarization. Emission at 90° geometry collected at magic angle polarization was detected through a double subtractive Oriel
Cornerstone 260 monochromator by a Hamamatsu
microchannel plate photomultiplier (R3809U-50). Signal acquisition and data processing were performed employing a Becker & Hickl SPC-630 TCSPC module. The fluorescence decay and instrumental response were performed until a maximum of 5×10³ counts was reached, using a time scale of 22.3 ps/channel
for ligand L1 and respective complexes, and 1.74 ps/channel for the ligand L2 and respective complexes.
2.6. Transient absorption measurements
The experimental setup to obtain triplet state absorption spectra used an Applied Photophysics laser flash photolysis apparatus pumped by the third harmonic (355 nm) of a Nd:YAG laser (Spectra Physics). Transient spectra were obtained by monitoring the optical density change at intervals of 10 nm over the 300-600 nm range and averaging at least 5 decays at each wavelength. First-order kinetics was observed for the decay of the transient absorption, assigned to the lowest triplet state. Excitation was at 355 nm with an unfocused beam. Special care was taken in determining triplet yields to have optically matched dilute solutions (absorbance between 0.2-0.3 in a 10 mm square cell) and low laser energy (2 mJ) to avoid multiphoton and triplet-triplet (T-T) annihilation effects. The samples used were degassed with nitrogen during approximately 20 minutes and sealed.
The triplet-triplet molar absorption coefficients were determined by the singlet depletion technique according to the well-known relationship:65
𝜀𝑇= 𝜀𝑆∆OD𝑇
∆OD𝑆 (2)
where ΔODS and ΔODT are the changes in optical density due
to singlet depletion and to triplet absorption in the differential transient absorption spectra, respectively, and S is the singlet
molar extinction coefficient. The intersystem-crossing yields (𝜙T) for the compounds were obtained by comparing the ΔOD
of the standard (benzophenone in ethanol,
𝜀𝑇𝑇𝑏𝑒𝑛𝑧𝑜𝑝ℎ𝑒𝑛𝑜𝑛𝑒= 7300 M-1 at 545 nm) optically matched (at the
laser excitation wavelength) and of the compound using the following equation: 𝜙𝑇cp=𝜀𝑇𝑇 𝑏𝑒𝑛𝑧𝑜𝑝ℎ𝑒𝑛𝑜𝑛𝑒 𝜀𝑇𝑇𝑐𝑝 × ∆𝑂𝐷𝑚𝑎𝑥𝑐𝑝 ∆𝑂𝐷𝑚𝑎𝑥𝑏𝑒𝑛𝑧𝑜𝑝ℎ𝑒𝑛𝑜𝑛𝑒× 𝜙𝑇 benzophenone (3)
Room-temperature singlet oxygen phosphorescence was detected at 1270 nm with a Hamamatsu R5509-42 photomultiplier cooled to 193 K in a liquid nitrogen chamber (Products for Research model PC176TSCE-005) after laser
excitation at 355 nm in an adapted Applied Photophysics flash kinetic spectrometer. The singlet oxygen formation quantum yield values, 𝜙∆cp, were determined by plotting the initial emission intensity for optically matched solutions as a function of the laser energy and comparing the slope with that obtained upon sensitization with the reference compound (1
H–phenalen-1-one in toluene), according to the following equation: 𝜙∆cp=slope1H−Phenalen−1−oneslopecp × 𝜙∆1H−Phenalen−1−one (4)
where 𝜙∆1H−Phenalen−1−one= 0.93, at exc = 355 nm.
2.7. Computational study
The structures and energies of six conformers of the [EuL1(H2O)]− complex and two conformers of the [EuL2(H2O)]
complex were calculated at the DFT (Density Functional Theory) level of theory within the hybrid meta-GGA approximation with the TPSSh67 exchange correlation functional and using the
GAMESS-US code.68 The geometries were fully optimized,
without symmetry constrains, using the effective core potential (ECP) of Dolg et al. and the associated [5s4p3d]-GTO valence basis set for the europium69 atom and the 6–31G(d,p) standard
basis set for sulfur, oxygen, nitrogen, carbon and hydrogen atoms. The ECP of Dolg et al. for europium includes the 4f electrons in the core and leaves the 5s and 5p electrons to be treated explicitly. The approximation of attributing the 4f electrons to the core of the ECP is reasoned by the fact that the 4f-orbitals have limited radial extension and therefore have an almost negligible participation in chemical bonding in lanthanide compounds.70,71 Vibrational frequency calculations
were carried out on the resultant stationary points for each conformer to confirm that they are true minima in the potential energy surface (i.e., to confirm that there are no imaginary frequencies). The relative Gibbs energies and equilibrium populations of the different conformers were calculated at 298.15 K.
3. Results and discussion
3.1. Ligand-centered emission
3.1.1. Photophysical properties of the free ligands L1 and L2
The spectral window and the absorption intensity are important features in the design of luminescence probes. In vivo excitation should not occur at a wavelength that could destroy cells, thus the probe should absorb above 330 nm.52 A strong absorption,
characterized by the molar absorption coefficient, improves the probe efficiency, which can be enhanced by sensitization of the metal ion through energy transfer from the chromophore. The photophysical properties of the phenyl-benzothiazole (PiB) moiety in the free ligands were characterized first. The absorption spectra of the free ligands L1 and L2 in aqueous solution show a maximum at wavelengths (abs) 330 nm and
360 nm, respectively (Figure S1 and Table 1), in the range adapted for biological applications. This band is assigned to a π→π* transition in the phenyl-benzothiazole moiety. The red-shift observed in the abs of this absorption band from L1 to
L2 is due to the presence of substituent groups with different electronic densities in their chemical structure. While L2 has two electron donating substituents (alkoxide and amide groups) at the terminal positions of the phenyl-benzothiazole moiety, L1 has an electron donating group (methoxy) and an electron withdrawing group (amine). This causes a larger energy increase of the ground singlet state (S0) relative to the first excited state
S1 of the chromophore in L2 than in L1, leading to a red-shift of the absorption band due to the decrease of the optical band gap, as observed for other substituted benzothiazoles.72 Both
ligands have high molar absorption coefficients, abs = 40500 ±
3300 M-1cm-1 for L1 and 28400 ± 350 M-1cm-1 for L2 (Table 1).
These absorption parameters are not changed in the TbL1 and TbL2 complexes, showing that these parameters of the PiB chromophore are not influenced by the Ln3+ complex moiety.
The fluorescence emission spectra of L1 and L2 at room temperature in aqueous solution in a 10 mM sodium phosphate
Table 1 - Photophysical properties of the PiB conjugate ligands (L1 and L2) and of the respective Ln3+ complexes (10 mM sodium phosphate buffer, pH= 7.4).a The margins of error indicated are at a 95% confidence level.
L1 LaL1 EuL1 TbL1 L2 LaL2 EuL2 TbL2
abs (nm) 330 330 330 330 360 360 360 360 abs (M-1cm-1) 4.05(± 0.33)×10 4 - - 4.05(± 0.33)×104 2.84(±0.035)×104 - - 2.84(±0.035)×104 F (nm) 410 410 410 410 445 445 445 445 T (nm) 460 460 460 460 450 450 450 450 T (M-1cm-1) 4.01×10⁴ 3.90×10⁴ 3.28×10⁴ - 2.6×10⁴ - - - 𝝓F (nm) 0.61± 0.02 0.61±0.02 0.49±0.02 0.61±0.02 0.64±0.03 0.62±0.02 0.35±0.02 0.60±0.03 𝝓T 0.27 0.26 0.24 - 0.15 - - - 𝝓 0.06 0.07 0.07 - - - - - 𝝓IC 0.12 0.13 0.27 - 0.21 - - - F (ns) 1.80 1.82 τ1=1.66 (a1=0.691)* τ2=0.88 (a2=0.309) 1.78 1.56 1.49 τ1=1.18 (a1=0.664)* τ2=0.17 (a2=0.336) 1.49 T (ns) 94 85 68 87 153 152 4.06 121 𝒌F (ns-1) 0.34 0.33 0.30 0.34 0.41 0.42 0.30 0.40 𝒌NR (ns-1) 0.22 0.22 0.31 0.22 0.23 0.25 0.55 0.27 𝒌IC (ns-1) 0.07 0.07 0.16 - 0.13 - - - 𝒌ISC (ns-1) 0.15 0.14 0.14 - 0.10 - - -
a Spectral data: absorption (λ
abs) and fluorescence (λF) wavelength maxima, triplet−triplet absorption (λT) maxima, and molar extinction singlet (εabs) and triplet (εT) coefficients. Photophysical properties:
fluorescence quantum yields (𝜙F), intersystem crossing singlet-to-triplet quantum yields (𝜙T), quantum yields for singlet oxygen formation (𝜙Δ), internal conversion quantum yields (𝜙IC), fluorescence
lifetimes (τF), triplet lifetimes (τT), radiative (𝑘F), radiationless internal conversion (𝑘IC), and intersystem crossing (𝑘ISC) rate constants; 𝑘F = 𝜙F/τF; 𝑘NR = (1 − 𝜙F)/τF; 𝑘IC = (1 − 𝜙F − 𝜙T)/τF; 𝑘ISC = 𝜙T/τF;
𝜙IC = 1 − 𝜙F − 𝜙T;The fluorescence decay curves were collected at em = 410 nm and em= 450 nm, for the L1 and L2 ligands and their complexes;
buffer (pH= 7.4) (Figure S1A) show a non-resolved emission band with maxima at 410 nm and 445 nm, respectively. The ligands display very similar photophysical properties (Table 1): large Stokes shifts (80 nm (5913 cm-1) and 85 nm (5306 cm-1),
respectively), high singlet excited state (S1) energies (324.40 (27100) and 294.12 (24570) kJ/mol (cm-1), respectively), high
fluorescence quantum yields (𝜙F = 0.61 and 0.64 for L1 and L2,
respectively) and mono-exponential fluorescence decays (F =
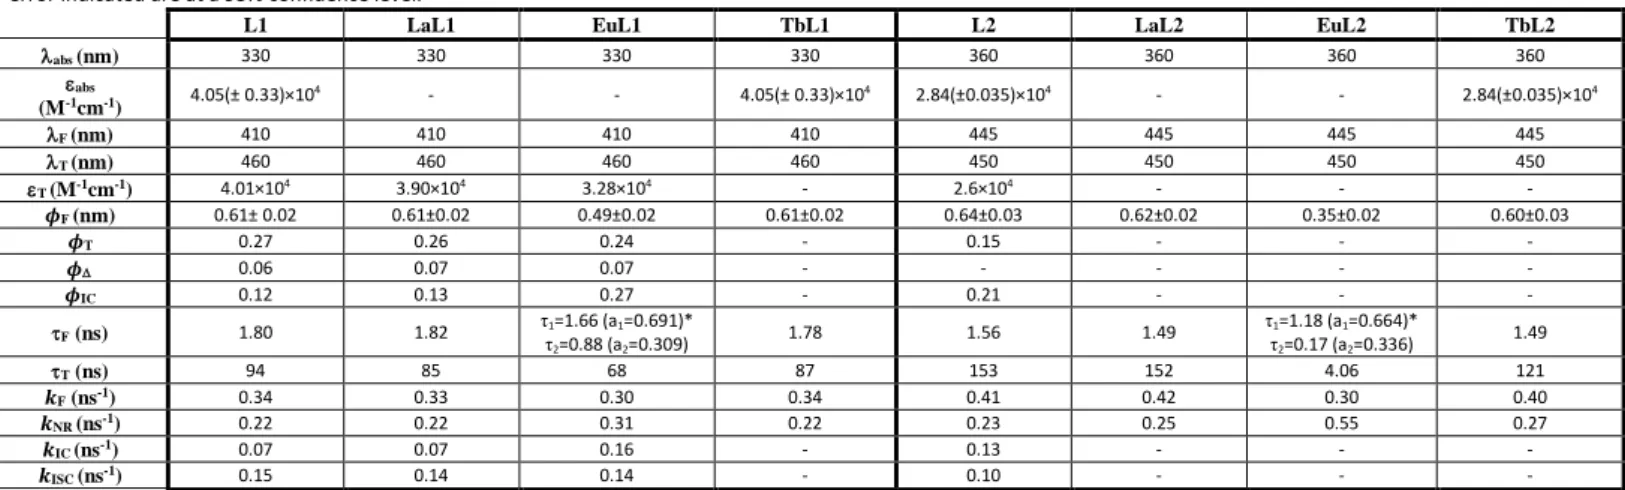
1.80 ns and 1.56 ns for L1 and L2, respectively). Decreasing the temperature to 77 K, the emission spectra of L1 and L2 in ethanol display an increase of their vibrational structure (Figure 2), which is the result of the confinement of the ligands into a more rigid environment.
3.1.2. Ligand singlet and triplet excited states in the presence and absence of metal ion
The presence of the Ln3+ ion changes the properties of the singlet and
triplet excited states of the phenyl-benzothiazole chromophore, which, after excitation, sensitizes the excited state of the metal ion. The triplet state of the ligands, in the absence and presence of bound Ln3+, has been characterized by laser flash photolysis (Table 1). Figure
3 depicts the transient singlet-triplet difference absorption spectra of ligand L1 in a degassed buffer solution. The depletion of the ground-state leads to the disappearance of a band at 330 nm, represented by a negative optical density (O.D.) variation, and the formation of a new band at 460 nm (positive O.D variation), which is assigned to the ligand L1 triplet state. Similar spectra were obtained for ligand L2 and in the presence of Ln3+ ions. The triplet decay time
(T), the intersystem-crossing (𝜙T) and internal conversion (𝜙IC)
quantum yields and the triplet-triplet absorption coefficient (T)
are very similar for L1 and LaL1, with small changes observed for EuL1. The presence of Eu3+ leads to a decrease of T and an
increase of 𝜙IC. Comparing L1 and L2, T and 𝜙IC increase,
whereas 𝜙T and T decrease for the latter ligand. Overall, the
photophysical parameters shown in Table 1 indicate that the Figure 2. Absorption (blue line), emission (red solid line) and excitation (red dashed line) spectra for L1 (A) and L2 (B), in ethanol at 298 K. The fluorescence emission (black solid
line) and excitation (black dashed line) spectra at 77 K are also presented. For L1 and L2, the fluorescence emission spectra were recorded with excitation at 330 nm and 360 nm, respectively, and for the excitation spectra the fluorescence emission was recorded at 410 nm and 443 nm, respectively.
Figure 3. Time resolved transient triplet-singlet absorption difference spectra for the
ligand L1 in 10 mM sodium phosphate buffer (pH = 7.4), observed with different delays following laser excitation at 355 nm. The triplet-triplet absorption decay obtained at 450 nm is shown as an inset.
presence of the lanthanide ion does not affect (LaLi, TbLi) or slightly (EuLi) affects the triplet state of the antenna in the L1 and L2 complexes studied.
The luminescence sensitization pathway of the Tb3+ and Eu3+
complexes occurs in three steps: excitation of the phenyl-benzothiazole moiety (antenna) into its singlet excited state, followed by intersystem crossing yielding the formation of the antenna´s triplet excited state, and finally energy transfer from the triplet state to the lanthanide ion. While we cannot exclude some contribution to the energy transfer from the donor excited singlet state, this is expected to be less important because the singlet state lifetime is markedly shorter than the triplet one. The excited state properties of the phenyl-benzothiazole moiety in the L1 and L2 probes remains unchanged upon La3+ complexation, demonstrating
that the presence of a non-luminescent metal ion does not influence the photophysical proprieties of the ligand (Table 1). In contrast, in the case of the Eu3+ complexes, EuL1 and EuL2, the presence of the
cation causes a decrease of the fluorescence quantum yields (𝜙F),
the fluorescence decay times (F) and the triplet lifetimes (τT) of L1
and L2 (Table 1). This shows that the excited singlet and triplet states of the antenna are quenched in the Eu3+ complexes, in agreement
with an efficient energy transfer mechanism from the triplet state of the antenna to the metal center. It should be noted that while the triplet lifetime for EuL2 is markedly shorter than that of the ligand L2, with EuL1, there is only a modest decrease in triplet lifetime relative to that of L1. However, more efficient triplet sensitization is observed with EuL1. A possible explanation for this apparent contradiction is the involvement of some other triplet quenching mechanism, such as charge transfer from the amine group, in EuL2.
Time-resolved fluorescence measurements of the free ligands collected at their maximum emission wavelengths resulted in mono-exponential decays with decay times (F) of 1.80 and 1.56 ns for L1
and L2, respectively, in buffer solution. The same behavior was found for the La3+ and Tb3+ complexes. Bi-exponential decays were
obtained for the EuL1 and EuL2 complexes (Table 1 and Figure S2). The fact that no rise-time was observed indicates that these correspond to two distinct species. A possible explanation is that these are associated with different conformations of the complexes. A representative determination of the rate constants for the SA/TSA conformer interconversions in DOTA-type Ln3+ complexes has been
carried out by quantitative analysis of variable temperature EXSY NMR spectra of Yb(DOTA)-. It was shown that the arm rotation and
ring inversion processes had quite similar activation energies, Ea, in
the 65-90 kJ.mol-1 range, corresponding to exchange kinetic
constants, kexch, at 297 K in the 14.4 – 116.7 s-1 range. This reflects the
high internal rigidity of the macrocyclic complexes, which explains the observed slow SA/TSA interconversion in the proton NMR timescale. Thus, these processes are too slow to explain the bi-exponential characteristics of the luminescence lifetimes of the EuL1 and EuL2 complexes.73 An alternative explanation of the
bi-exponential decay is by considering an equilibrium of the complex between a fully extended conformation, which is the more stable one according to the DFT study (Table 3 and Figures 5 and 6), originating the component with the longer fluorescence lifetime (Table 1), and a conformation where the chromophore is oriented
towards the metal ion, originating the component with shorter fluorescence lifetime. In the case of the EuL2, the fact that it has a longer spacer with high conformational freedom and allowing a closer approximation between the chromophore and the metal ion, would decrease the component with shorter fluorescence lifetime more significantly than in the case of EuL1. These slight conformation changes are expected to be in a timescale that explains the bi-exponential characteristics of the fluorescence lifetime. Otherwise there is little or no effect on that parameter.
3.1.3. Photostability of the ligands
A photostability study of the ligands and their complexes is very important for their evaluation as optical probes. Figure S3 shows that no significant change was observed in the absorption spectrum of ligand L1, following two hours of irradiation using 350 nm light (intensity 90 mW/cm2) in a semimicro photoreactor described in detail elsewhere.74 The
light intensity is comparable with that of the excitation lamp in conventional fluorimeters, demonstrating acceptable photostability. However, under the same conditions, ligand L2 showed a continuous decrease in the intensity of its 360 nm absorption band, with a corresponding shift to shorter abs
values, indicating that it is photodegradable. Although the
photo-degradation mechanism was not studied and
photoproducts were not isolated and identified, the presence of two isosbestic points at 240 nm and 325 nm indicates that ligand L2 photoreacts to give one degradation product. The limited photostability of L2, and possibly of its Ln3+ complexes,
indicates that their usefulness as optical probes is limited.
3.2. Metal-centered emission 3.2.1. Luminescence spectra
Excitation of the ligand-centered π→π* transitions at the maximum absorption wavelengths, 330 nm and 360 nm, respectively, was used to acquire the emission spectra of the visible-emitting EuLi and TbLi (i = 1, 2) complexes (Figures 4 and S4). All the compounds show characteristic red and green emissions, with emission profiles typical of the Ln3+ ion used.
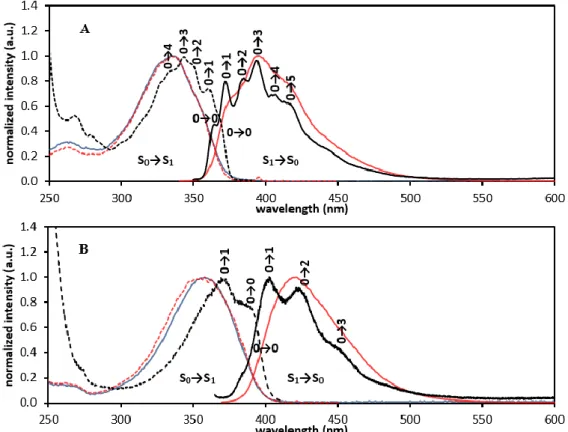
Figure 4 shows the luminescence spectra of the EuL1 and EuL2 complexes, with seven emission bands corresponding to transitions from the lowest excited state 5D0 to the different
levels of the ground state, 7FJ (5D
0→7FJ, J = 0 - 6). The
asymmetric electronic ligand field destroys the spherical symmetry of the Eu3+ ion, splitting each spectroscopic energy
level with different quantum number J in several sub-levels, the splitting being dependent on the group point symmetry of the complex. The intensity of some transitions is highly dependent of the chemistry environment and are called “hypersensitive transitions”. From the spectrum we can observe that the
5D0→7F1, the magnetic dipole transition (which is largely
independent of the Eu3+ environment), and the 5D0→7F4
transition have relative intensities similar to the hypersensitive
5D0→7F2 transition, reflecting similar high-symmetry chemical
environments around the Eu3+ ion, in agreement with other
studies involving complexes of DOTA and DO3A derivatives.75,76
symmetry of their coordination sphere is close to C4. However, the hypersensitive 5D0→7F2 transition has a considerably higher
intensity in the emission spectrum of EuL1 relative to EuL2. The strongly forbidden electronic dipole 5D0→7F0 transition is
allowed in a selected number of symmetries only (Cnv, Cn, and Cs).75,76
Here the transition is detectable as a single symmetric peak at 579.55 nm (17254.77 cm-1) for EuL1 and at 579.85 nm (17245.84 cm-1) for
EuL2, constituting 13.23% and 14.19% of the integrated intensity of the magnetic dipole 5D0→7F1 transition for EuL1 and EuL2,
respectively. This is an indication of pseudo-C4 symmetry about the Eu3+ ion, which is further reflected by the crystal-field splitting of the
other 5D0→7FJ transitions. Because the 7F0 states of Eu3+ are
non-degenerate, no crystal-field fine structure is expected for the
7F0→5D0 line. Thus, the number of bands observed for this transition
is a measure of the number of non-equivalent Eu3+ species present in
solution.75,76 However, with the rather wide beam width used in our
experiments (2.5 nm) it is not possible to comment on the presence of any isomers in solution. Ln3+ complexes with DOTA and DO3A
derivative ligands can adopt in solution square antiprismatic (SAP) and twisted square antiprismatic (TSAP) geometries, which differ in the value and sign of the torsion angle between the plane defined by the four Ln3+-bound nitrogen atoms of the macrocyclic ring and the
plane defined by the four Ln3+-bound oxygens of the pendant
arms.77,78 Based on the luminescence data, we can conclude that one
of these geometries is much more stable than the other one. Proton NMR spectra of paramagnetic Ln3+ complexes of DOTA monoamides
in solution indicate that their SAP geometry is significantly more stable than TSAP,78 a result that is confirmed for our systems by DFT
computational results (see later).
The luminescence spectrum of EuL2 shows a non-resolved band at 442 nm that is not related to the Eu3+ emission but has the same
features of the emission band of the ligand. The luminescence spectrum was obtained with a delay after flash of 0.1 ms, so that band cannot correspond to a normal fluorescence process, since the fluorescence lifetime of the chromophore is less than 2 ns. The luminescence excitation spectra of EuLi (i = 1, 2), also shown in Figure 4, are very similar to the respective absorption spectra of the ligand. This good spectral overlap fulfils the conditions for populating the lowest Eu3+ excited state through energy
transfer from the chromophore. According to Latva´s empirical rules,79 such an energy transfer is efficient when the energy
difference (ET1Ln*) between the antenna T1 state and the
lowest excited state of the Ln3+ ion (Ln = Eu, Tb) is in the
1850-5000 cm-1 range, suppressing the triplet state and giving high
luminescence quantum yields. Assuming that the energy of T1
of the chromophore in the EuLi complexes is very close to the reported value for 2-phenyl-benzothiazole in a polar solvent (20870 cm-1),80 the calculated energy differences relative to the 5D0 state for EuL1 and EuL2 (3615.2 cm-1 and 3624.2 cm-1,
respectively) are within the appropriate range for an efficient T1-5D0 energy transfer. Support for energy transfer comes from
the decrease of the triplet lifetimes (τT) of the Eu3+ complexes.
In contrast, the La3+ ion, without emissive excited electronic
states, cannot quench the T1 state and does not affect the τT
value of the chromophore. However, as has been pointed out by one of the referees, energy transfer from the triplet state to the Eu3+5D0 level is forbidden by both multipole and exchange
mechanism selection rules. These are relaxed due to J-mixing effects with the energetically close 5D1 and 5D2 levels, and it is Figure 4. Luminescence spectra (black line) of the EuL1 (A) and EuL2 (B) complexes in 10 mM sodium phosphate buffer (pH = 7.4), collected with excitation wavelengths of 330 nm
and 360 nm, respectively, at T = 298 K. The absorption (blue dashed line) and the luminescence excitation (red line) spectra are also presented. In the luminescence spectra, the J = 0 - 6 levels of the Eu3+ ground state involved in the electronic transitions 5D
probable that these are involved in the energy transfer from the ligand triplet state. Detailed discussion of the importance of selection rules in this process is given elsewhere.81-83
The luminescence spectrum of TbL1 shows the expected seven bands corresponding to the 5D
4→7FJ (J = 0 - 6) transitions, of
which four are intense and the other three (J = 0, 1, 2) are weak. However, it was not possible to detect these later bands for the TbL2 complex (Figure S4). The luminescence spectra of TbL1 and TbL2 also show two bands at 408 nm and 442 nm, respectively, which result from delayed fluorescence of the chromophore. The effect of the Tb3+ ion on the reduction of the chromophore
triplet lifetimes (τT) in the TbLi complexes is much smaller than
for the EuLi complexes (Table 1), indicating that the energy transfer from the T1 state to the 5D4 state of Tb3+ is less efficient.
This could be explained by the calculated energy differences between those states (ET1Tb*) for TbL1 and TbL2 (366.4 cm-1
and 379.5 cm-1, respectively), which are much smaller than 1850
cm-1, a situation that according to Latva´s empirical rules79
facilitates the 5D
4→T1 back transfer process. The luminescence
excitation spectrum of TbL2 is again quite similar to the respective absorption spectrum. However, in the case of TbL1, although the maxima of the two bands coincide in the excitation and absorption spectra, their relative intensities are very different in the two kinds of spectra, suggesting that long-range dipolar Förster resonance energy transfer (FRET) mechanism from the chromophore donor to the metal acceptor is not efficient and there may be a contribution from the short range exchange Dexter mechanism,65 which is facilitated for
donor-acceptor distances below 10 Å.84 In fact, the average distance
between the Tb3+ ion and the closest atom (P1) where the
LUMO (lowest unoccupied molecular orbital) of the chromophore has a significant charge density in the TbL1
complex is 7.73 Å, as calculated by DFT (see the later discussion). The Förster mechanism should dominate the energy transfer process in the TbL2 complex, for which the Dexter mechanism is highly improbable. This is supported by the large (greater than 10 Å) DFT computed average distance between the chromophore and Tb3+, separated by a saturated
aliphatic six carbon chain in a low energy all-trans conformation (see later).
3.2.2. Photophysical properties of the luminescent complexes
The efficiency of the overall sensitization process of the Eu3+ and
Tb3+ complexes was evaluated through the determination of the
overall quantum yield of luminescence (𝜙LLn), using
[Ru(bpy)3]Cl2 in an air equilibrated aqueous solution as
reference.64 These experimental values (Table 2) show that the
sensitization process has quite low efficiency for all complexes, but LnL2 are about one order of magnitude less efficient than the LnL1. In order to rationalize these absolute and relative values, we note that the overall quantum yield of luminescence can be described as follows:
𝜙LLn= ηpopD × ηte× 𝜙LnLn= ηsens× 𝜙LnLn; ηsens=𝜙L
Ln
𝜙LnLn (5)
where 𝜙LLn and 𝜙LnLn are the quantum yields obtained upon
excitation through the ligands (L) or direct excitation into the f-levels (Ln) and ηsens is the overall sensitization efficiency of
the excited level of the Ln3+ ion, which is the product of two
terms (ηpopD × ηte), where ηpopD is the efficiency to populate the
donor energy level of the antenna responsible for the energy transfer to the excited level of the Ln3+ ion after the initial
excitation, and ηte is the energy transfer efficiency from the
donor energy level to the acceptor level of the Ln3+.48,85,86 η sens
Table 2 - Calculated values of 𝑘obs, q, τr, 𝑘R, 𝛷𝐿𝑛𝐿𝑛, ηsens and Σ𝑘nr for the EuL1 and EuL2 complexes using the experimentally determined quantities τobs and 𝑘obs in H2O and D2O, [Itot/I(0,1)] and 𝛷𝐿𝐿𝑛. Some other parameters are also shown for TbL1 and TbL2. All parameters have been determined in 10 mM sodium phosphate buffer (pH = 7.4) at 298 K. The margins of error indicated are at a 95% confidence level.
EuL1 EuL2 TbL1 TbL2 τobs (H2O, ms) a) 0.583 ± 0.003 0.400 ± 0.011 0.298 ± 0.004 0.079 ± 0.010 τobs (D2O,ms) a) 1.871 ± 0.023 0.857 ± 0.017 𝒌obs (H2O, s-1) b) 1716.26 ± 8.3 2500.39 ± 70.5 𝒌obs (D2O, s-1) b) 534.58 ± 6.5 1166.49 ± 22.6 q c) 1.12 ± 0.01 1.30 ± 0.07 [Itot/I(0,1)], H2O d) 3.50 3.27 τr, (H2O, ms) e) 8.29 8.88 𝒌r, (H2O, s-1) f) 120.64 112.61 𝝓𝑳𝒏𝑳𝒏 , H2O g) 0.0703 0.0450 𝝓𝑳𝑳𝒏, H2O h) 1.84×10⁻³ ± 7×10⁻⁵ 1.27×10⁻⁴ ± 3×10⁻⁵ 2.62×10⁻⁴ ± 1×10⁻⁵ 2.09×10⁻⁵ ± 6×10⁻⁶ ηsens, H2O i) 0.0261 0.00282 ∑ 𝒌𝐧 𝐧𝐧𝐫(H2O, s-1) j) 1594.6 2387.4
a) Luminescence lifetime monitored at the maximum emission at 701 nm; b) Rate constant of observed decay (𝑘𝑜𝑏𝑠= 1/𝜏𝑜𝑏𝑠); c) Number of coordinated water molecules in the inner sphere
of the Eu3+ ion; d) The same as I
tot/IMD which is the relative contribution of the 5D0→7F1 transition, I(0,1), to the total integrated luminescence emission spectrum, Itot.; e) Radiative lifetime in the
absence of non-radiative decay processes; f) Radiative rate constant (𝑘𝑟= 1/𝜏𝑟); g) Intrinsic luminescence quantum yield of the Ln3+ ion; h) Experimental overall quantum yield of luminescence
determined by comparative method using [Ru(bpy)3]Cl2 as reference in air-equilibrated solution61; i) Overall sensitization efficiency to the excited state of the Ln3+ ion; j) Sum of all the rate
can be calculated from Equation (5) when 𝜙LLn and 𝜙LnLn are
known. The intrinsic luminescence quantum yield (𝜙LnLn) can, in
principle, be obtained directly from the intensity of the luminescence spectrum and the measurement of the luminescence lifetime, but this method is difficult to apply due to the for the weak Ln3+ f-f bands. An alternative is to use the
ratio between the observed rate constant (𝑘obs) and the
radiative rate constant (krad):
𝜙LnLn= 𝑘rad
𝑘obs=
τobs
τrad (6)
where 𝑘 = 1/τ, τobs is the observed lifetime of the Ln3+
emitting level and τrad is the radiative lifetime of this level. 𝑘 obs
is the sum of the rate constants of the different deactivation processes, including the radiative (𝑘rad) and all the non-radiative
(𝑘nr) rate constants:
𝑘obs= 𝑘rad+ ∑ 𝑘n nnr (7)
Thus, 𝜙LnLn reflects the extent of the non-radiative deactivation
processes occurring in the inner- and outer-coordination spheres of the Ln3+, which depends on the energy gap (ΔE)
between the emissive excited state and the highest ground state sub-level of the Ln3+. The lower the ΔE value, the more
efficient will be the quenching process by the vibrational overtones of the oscillators present in the ligand and solvent molecules.48,85,86
In Equation (6) τobs can be obtained experimentally, and τrad can
be calculated, although this is generally not easy.48,85 However,
Eu3+ is a special case, where the 5D0→7F1 transition has a purely
magnetic dipole (MD) character and can be used as an internal reference, leading to a simplified and convenient equation:
1
τrad= AMD,0× n
3× (Itot
IMD) (8)
where AMD,0 is a constant equal to 14.65 s-1, n is the refractive
index of the solution and (Itot/IMD) is the ratio between the
integrated area of the emission spectrum corresponding to all the europium transitions 5D0→7FJ (J=0-6), Itot, and the integrated
intensity of the magnetic dipole transition 5D0→7F1 (IMD or
I(0,1)).87
The experimental overall (𝜙LLn) and calculated intrinsic (𝜙LnLn)
quantum yield values for the EuL1 and EuL2 complexes are shown in Table 2, together with other experimental and calculated parameters. The intrinsic luminescence quantum yield (𝜙LnLn) is
higher for the EuL1 (0.0703) than for the EuL2 (0.0450). This may reflect structural differences, such as rigidity of the complexes. In the same way, the overall sensitization efficiency (ηsens) for EuL1
(0.0261) is an order of magnitude higher than for the EuL2 complex (0.00282). The main reason for these low values, and the consequent low quantum yields of luminescence is the large average distance between the antenna and the metal center in both complexes, which is even bigger for EuL2 (see below), explaining the lower 𝜙LLn value
found for this complex. In contrast, reported data in the literature
shows that, direct coordination of the chromophore to the metal center leads to quantum yields of luminescence and overall sensitization efficiencies that are one or two orders of magnitude higher than the values obtained for EuL1 complex.84,85,88,89
3.2.3. Determination of the number of inner-sphere water molecules
The number of water molecules coordinated in the inner sphere of an Ln3+ complex (hydration number, q) can be determined
from the difference of the luminescence lifetimes of the complex in H2O and D2O, based on the isotope effect observed
for the non-radiative quenching of the excited state of the metal ion. This quenching process is more efficient for the O-H than for the O-D oscillator, with a consequent shorter lifetime in H2O.
As a consequence, if non-radiative quenching is dominated by this process, the increase of q will proportionally lower the luminescence lifetime, and can be determined from the difference in efficiency of the process in H2O and D2O.90 The
phenomenological relationship proposed for Ln3+ complexes,
taking into account the small effect of the O-H, N-H and C-H oscillators present in the ligand and in the outer sphere solvent molecules on the decay of the excited state of the metal ion, is given in Equation (9):91
q = A × (Δ𝑘obs + B) (9)
where 𝑘obs = 𝑘obs(H2O)- 𝑘obs(D2O), 𝑘obs=1/obs, and obs is the
luminescence lifetime of the complex in ms. In the case of Eu3+
complexes, A = 1.2 ms and B = -0.25 ms-1.
The q values obtained for EuL1 and EuL2 are 1.12 and 1.30, respectively (Table 2), which are consistent with q = 1 reported for Eu3+ complexes with structurally related octadentate
polyaminocarboxylate ligands, such as DOTA and DO3A derivatives, where one water molecule is coordinated to the metal center, increasing the total coordination number to 9.73
The q values for the Tb3+ complexes were not determined, but
are expected to be very similar to those found for the Eu3+
complexes.
3.3. DFT study of the chelate geometry and the antenna-metal center distance
The tetraaza macrocycles L1 and L2, as -substituted DOTA and DO3A-monoamide derivatives, respectively, can form Ln3+
complexes in solution with two types of geometries: SAP and TSAP.77,78 As described above, the luminescence spectra of the
Eu3+ and Tb3+ complexes show that only one species is present
in solution. In order to investigate which geometry is energetically preferred, theoretical calculations at the DFT level of theory were performed for the complexes, EuL1 and EuL2, with one water molecule coordinated in the inner sphere of the metal ion, based on the calculated q values obtained from the luminescence lifetimes in water and in deuterated water. From these calculations, the relative populations of the SAP and TSAP isomers at 298.15 K were estimated for the two complexes. In each complex, in addition to the chelate geometry, the spacer arm conformation has to be considered. In the [EuL1(H2O)]−
complex, there is torsional flexibility with relatively low steric hindrance for the H2C−CN(=O) coordinate, describing the
torsion angle between the carbon atom of the amide moiety and the adjacent CH2 group of the spacer arm. However, due to
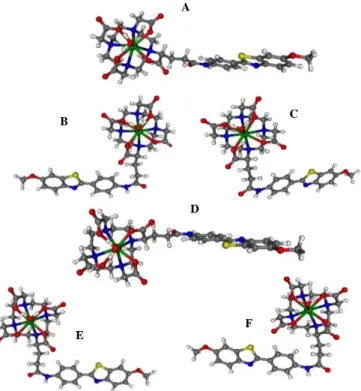
the large size of the complex, it was not possible to carry out a full scan of the energy of the molecule as a function of this coordinate. Therefore, for each type of chelate geometry, we have considered as the most important conformers the structures having C-C-C-N torsional angles (nitrogen atom from the amide and the subsequent three carbon atoms of the spacer) close to 180º, + 90º and -90º. These structures were optimized at the DFT level and their geometries, relative energies and relative populations at 298.15 K are presented in Figure 5 and Table 3. The [EuL1(H2O)]− conformers were
generically designated as SAP180, SAP+90, SAP-90, TSAP180, TSAP+90 and TSAP-90, combining the indication of their chelate geometry (SAP or TSAP) with that of their approximate C-C-C-N torsional angle (180º, +90º and -90º) (Figure 5).
The theoretical study shows that the most stable conformer for the EuL1 complex is SAP180, adopting an extended conformation of the spacer arm, which has a relative population of 68.3% at 298.15 K. The sum of the populations of all the conformers with SAP geometry is 90.5% (Table 3). Despite the fact that we are not including in this study all the possible minor conformers, this result demonstrates that the SAP geometry is significantly more stable than the TSAP one. This result is consistent with the observation of only one 5D0→7F0 transition
in the luminescence spectrum, showing that only one chelate geometry is detected in solution. This result is also in agreement with proton NMR and X-ray crystal studies from the literature, according to which the Eu3+ complexes of DOTA and its
-substituted derivatives generally adopt the SAP geometry in solution with q =1.77,78
In the case of the [EuL2(H2O)]- complex, the geometry and
energy of the SAP and TSAP isomers were calculated with an all-trans conformation of the spacer arm, which is expected as the dominant conformation for the carbon chain, since in this extended conformation the steric effects are minimized. The theoretically optimized geometries of the isomers are presented in Figure 6. This study shows that the SAP isomer is again the most stable form, being 1.8 kJ/mol lower in energy than the TSAP one (Table 3). In terms of population at 298.15 K, this corresponds to a population of 67.5% for the SAP geometry and a population of 32.5 % for the TSAP one.
The distance between the metal center and the antenna chromophore is important to ensure high efficiency of energy transfer, and, consequently, a high quantum yield of luminescence. Therefore, this distance (d) was also determined for each of the selected conformations of the Eu3+ complexes,
either by considering the closest atom (P1) where the LUMO (lowest unoccupied molecular orbital) of the chromophore has a significant charge density, or the centroid of the LUMO orbital (Figure 7). The P1 atom is the oxygen atom of the amide linker in L1 and of the PiB moiety in L2. Table 3 shows that the
A
B C
D
E F
Figure 6. DFT/TPSSh optimized structures of the SAP and TSAP isomers of the [EuL2(H2O)]
-complex.
Figure 7. DFT/TPSSh lowest unoccupied molecular orbitals (LUMOs) of the dominant
calculated distances for the EuL1 conformers (7.64 to 10.66 Å) are considerably smaller than those for EuL2 (13.22 to 19.07 Å) (the same is true if we consider the average distances over all conformers). The efficiency of energy transfer between the triplet state of the chromophore and the Eu3+ excited state
decays with their distance, but in different ways depending on the transfer mechanism. In the Förster mechanism the energy transfer decays proportionally to d-6, and in the Dexter
mechanism the decay is exponential (e-d).65 Therefore, both of
the mechanisms are in agreement with the observation that EuL1 has a higher luminescence quantum yield than the EuL2 complex. With the determination of the average distance between the antenna and the metal center we can speculate about the nature of the energy transfer mechanism in these complexes. For the occurrence of the short-range Dexter mechanism, which requires an orbital overlap between the donor and acceptor moieties through which an excited electron is transferred, this distance needs to be less than 10 Å.84 Thus,
the average distance calculated for EuL1 is compatible with a contribution of both mechanisms, but the considerably higher than 10 Å average value for EuL2 makes a contribution from the Dexter mechanism to be highly unlikely.
4. Conclusions
The conjugation of the DOTAGA and DO3A chelate to the PiB moiety, which is well known for its high and specific affinity to amyloid aggregates, provided Eu3+ and Tb3+ complexes with
luminescence properties which, according to previous reports, have high affinity to such aggregated amyloid peptides in
vitro.36-38,54 The corresponding Gd3+ complexes were found to
be effective relaxation agents in vitro.36,37,54 Some of their 68Ga3+
complexes have been studied as PET probes with very limited brain uptake in in vivo Alzheimer’s disease (AD) animal models,26 but functionalized multi-walled carbon nanotubes
(f-MWNTs) with the 111In3+ chelates of L1 and L2 were found by
SPECT to have enhanced brain delivery in in vivo animals.55 The
utility of Eu3+ complexes of such PiB conjugates as optical
probes has been demonstrated by ex vivo
immunohistochemical studies using the fluorescence detection of EuDO3A-PiB, which showed that they selectively target Aβ plaques on AD human brain tissue.36 In this paper we have used
luminescence and DFT computational calculations to demonstrate that these probes can be useful luminescence probes for optical imaging, allowing the exploitation of the ligands in multimodality approaches. The PiB amyloid targeting moiety can be used as an antenna to sensitize the lowest excited level of the luminescent Eu3+ or Tb3+ ion. However, the
presence
of one water molecule in the inner coordination sphere of the Ln3+, which provides an efficient relaxation mechanism for the
Gd3+ complexes in the context of MRI applications, limits the
luminescence quantum yield of the corresponding Eu3+ (Tb3+)
complexes by increasing the number of non-radiative decay routes. The distance between the antenna and the metal center is also a key factor in the development of these probes. While shorter distances increase the quantum yield of luminescence, they lower their affinity to the amyloid aggregates, due to the predominantly hydrophobic nature of their interaction. The low overall quantum yields of luminescence of the Eu3+ complexes
are mainly due to the low overall sensitization efficiency of their energy transfer process resulting from the large distances between the metal center and the antenna, especially in the EuL2 complex. In overall, the results of this work contribute to the mechanistic understanding of the functioning of such probes and illustrate the challenges associated to the rational design of amyloid multimodal targeted probes.
Conflicts of interest
There are no conflicts to declare.
Acknowledgements
The authors are grateful to the Fundação para a Ciência e a Tecnologia (FCT) for funding of the Coimbra Chemistry Centre
through the programmes UIDB/00313/2020 and
UIDP/00313/2020, also co-funded by FEDER/COMPETE 2020-EU. TC thanks the Coimbra Chemistry Centre for the award of a
research grant from the Project 2015/2020
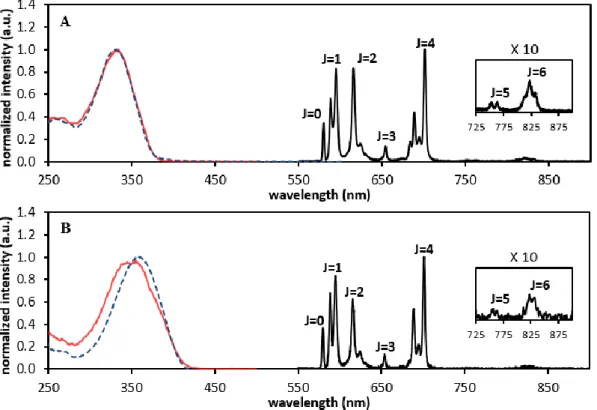
UID/QUI/00313/2013. ACO thanks the FCT for the PhD grant SFRH/BD/120934/2016. ET and JFM acknowledge financial support of the French ANR (DIVA, ANR-16-CE18-0022-01). We Table 3- Relative Gibbs free energies, ΔG298.15 (kJ/mol), equilibrium populations at 298.15 K, P298.15 (%) and distances d (Å) between the chromophore (antenna) and the metal center
for the isomers of the [EuL1(H2O)]- and [EuL2(H2O)]- complexes (Figures 5 and 6) calculated at the DFT/TPSSh level of theory.
EuL1 EuL2
Conformer SAP180 SAP-90 SAP+90 TSAP180 TSAP-90 TSAP+90 SAP TSAP
ΔG298.15 0.0 2.8 19.7 6.1 18.7 8.7 0.0 1.8
P298.15 68.3 22.2 0.0 5.8 0.0 3.6 67.5 32.5
d(Ln-P1)a 7.65 8.02 7.93 7.64 8.03 7.74 13.22 13.22
d(Ln-centroid)b 10.66 9.01 9.66 10.29 7.86 9.69 19.07 19.02
![Table 3- Relative Gibbs free energies, ΔG 298.15 (kJ/mol), equilibrium populations at 298.15 K, P 298.15 (%) and distances d (Å) between the chromophore (antenna) and the metal center for the isomers of the [EuL1(H 2 O)] - and [EuL2(H 2 O)] - complexe](https://thumb-eu.123doks.com/thumbv2/123doknet/14512269.529908/13.892.76.840.158.316/relative-energies-equilibrium-populations-distances-chromophore-antenna-complexe.webp)
