HAL Id: hal-02445546
https://hal.archives-ouvertes.fr/hal-02445546
Submitted on 20 Jan 2020
HAL is a multi-disciplinary open access
archive for the deposit and dissemination of
sci-entific research documents, whether they are
pub-lished or not. The documents may come from
teaching and research institutions in France or
abroad, or from public or private research centers.
L’archive ouverte pluridisciplinaire HAL, est
destinée au dépôt et à la diffusion de documents
scientifiques de niveau recherche, publiés ou non,
émanant des établissements d’enseignement et de
recherche français ou étrangers, des laboratoires
publics ou privés.
Copyright
Tubes & Bubbles Topological confinement of YouTube
recommendations
Camille Roth, Antoine Mazieres, Telmo Menezes
To cite this version:
Camille Roth, Antoine Mazieres, Telmo Menezes.
Tubes & Bubbles Topological confinement of
YouTube recommendations. PLoS ONE, Public Library of Science, 2020, 15 (4), pp.e0231703.
�hal-02445546�
Tubes & Bubbles
Topological confinement of YouTube recommendations
Camille Roth
*1,2, Antoine Mazières
†1, and Telmo Menezes
‡11CNRS, Centre Marc Bloch,Computational Social Science team, Berlin, Germany 2CAMS, Centre d’Analyse et de Mathématique Sociales, CNRS/EHESS, Paris, France
Abstract
The role of recommendation algorithms in online user confinement is at the heart of a fast-growing literature. Recent empirical studies generally suggest that filter bub-bles may principally be observed in the case of explicit recommendation (based on user-declared preferences) rather than implicit recommendation (based on user ac-tivity). We focus on YouTube which has become a major online content provider but where confinement has un-til now been little-studied in a systematic manner. Start-ing from a diverse number of seed videos, we first de-scribe the properties of the sets of suggested videos in or-der to design a sound exploration protocol able to cap-ture latent recommendation graphs recursively induced by these suggestions. These graphs form the background of potential user navigations along non-personalized rec-ommendations. From there, be it in topological, topical or temporal terms, we show that the landscape of what we call mean-field YouTube recommendations is often prone to confinement dynamics. Moreover, the most confined recommendation graphs i.e., potential bubbles, seem to be organized around sets of videos that garner the highest audience and thus plausibly viewing time.
Introduction
The effect of algorithms in the filtering of information and interactions in online platforms is currently at heart of a very active debate. The question of whether algo-rithmic recommendation fosters the serendipity of con-tact and content discovery or not is of particular inter-est. On the one hand, a growing literature aims at em-pirically comparing what happens when users do rely, at least in part, on the output of some recommenda-tion algorithm vs. when they do not. This kind of scien-tific endeavor generally need not venture into knowing or reverse-engineering which principles drive these algo-rithms. Contrarily, perhaps, to intuitions related to the popularization of so-called “filter bubbles”, several recent studies appear to show that algorithmic suggestions do not necessarily contribute to restrict the horizon of users.
*Corresponding author: [email protected]
†[email protected] ‡[email protected]
Be it in terms of interaction or information consumption, users do not seem to be proposed less diversity content in regard to what would happen in the absence of recom-mendation [1,2,3,4,5,6] or using distinct recommenda-tion approaches [7,8], except for what stems from explicit personalization (i.e. explicitly chosen [9], or self-selected [10], by users [11]). Put shortly, the picture that seems to emerge is that filter bubbles, and possibly echo cham-bers, mostly occur when platforms recommend content based on explicit personal preferences (e.g., by subscrib-ing to channels, specifysubscrib-ing lists of interests, etc.) rather than implicit traces (either at the user-level or aggregated from the activities of all users).
On the other hand, at a more downstream level, user re-actions to algorithmic curation are an equally important issue. The current state of the art exhibits mixed results and user populations may not be deemed to be homoge-neous. For one, users may variously seek diversity [12], be variously responsive to recommendation [1], use it for various purposes [13] or have various expectations about it [14] — in these respects, the “average user” does not re-ally exist. Users however seem to be generre-ally sensitive to social signals and goaded by the indication that some content is popular or appreciated [15,16,17] whereas they are weakly sensitive to content-based signals, for instance if they are informed of the diversity of what they are cur-rently consuming [18]. Such studies generally require the design of sophisticated experimental protocols or privi-leged access to private company data. On the whole, there appears to be no blanket answer to the complex interplay between the structure of proposed recommendations and user attitudes towards them.
In this context, while YouTube has become a key con-tent provider (being the second most popular site as of 2019), the influence of its recommendation system on user navigation dynamics and exploration diversity has been little studied (even though it is already a current news topic, see e.g., [19, 20]). The present contribu-tion intends to bridge this gap by focusing on the global, platform-level and thus non-personalized recommenda-tions of YouTube. Indeed, irrespective of the personalized, user-centric adjustments to recommendation, studying platform-level suggestions shall provide an overview of the forces that are susceptible to apply globally to all users. As such, characterizing a possible confinement on these recommendation landscape constitutes a primary
step toward characterizing confinement as a whole. On content-sharing platforms, a model of user behav-ior toward recommendations may be construed as the navigation on a recommendation graph where nodes are items (such as videos) and links are recommendation sug-gestions, which users may or may not follow. Under-standing the heterogeneity of the subsequent navigation topologies is crucial to appraise possible confinement processes. The issue of potential navigation topology has already generated several key studies in other platforms such as Twitter or Facebook, especially with respect to po-larization and fragmentation, yielding convincing graph typologies (see, inter alia, [21,22,23,24,25]). By contrast, the state of the art relevant to YouTube’s algorithms ap-pears to have essentially focused on their technical un-derpinnings [26], their improvement [27] or their impact on consumption and audience statistics [28,29,30]. To our knowledge, very few academic works appear to fo-cus on the general structure of the browsing network: for instance, [31] describes the potential navigation dynam-ics in relation to audience or macro-level features, while [32] principally use the recommendation graph as a data source for extracting crowdsourced content taxonomies.
The paper is broadly organized as follows. We first carry out an instrumental step by exploring how video recom-mendation sets are being provided by the platform in the absence of personalization. This enables us to devise a robust protocol of collection of node-centric recommen-dation graphs. We then analyze the shape of the graphs that are thus generated and their various confinement features. Most importantly, we discuss them in relation to various intrinsic properties of videos (especially in terms of popularity, consensus, or topics), both in a static and longitudinal manner.
Node-centric analysis of
recommenda-tions
Most YouTube videos include a tab featuring a list of sug-gested videos. How user-specific these suggestions are depends on whether users are logged in or share cook-ies and other identification information. While some sug-gestions seem to be clearly user-centric and depend on user navigation history (generally labeled by YouTube as Recommended for you), others appear to be node-centric, i.e. stemming from a pool of suggestions attached to the video itself, independently of the user history. In this latter case, suggested videos most likely depend on in-ferences made from platform-level behavioral traces ac-cumulated over an unknown pool of users and an un-known period of time. This engenders a dichotomy be-tween user-specific suggestions and what may be called a “mean field” of user-independent suggestions. We aim at characterizing this mean field, while leaving person-alized recommendation outside of the scope of this pa-per. We do not aim at all at reverse-engineering the way node-centric suggestions are being computed by the plat-form, but rather wish to understanding the navigation
landscape that YouTube algorithms contribute to shape. In other words, we take for granted how these recommen-dations are built and focus on characterizing this land-scape. Users are admittedly exposed to both types of sug-gestions, yet we contend that the analysis of the mean rec-ommendation field is already likely to shed light on the attraction forces that are due to node-centric suggestions, all other things being equal.
Data
In practice, we thus study user-independent suggestion lists attached to videos by creating non-persistent, anony-mous sessions with simple HTTPS requests on a given page from a set of about a hundred IP addresses
lo-cated in the region of Paris, France. We first define
a diverse set of YouTube videos by arbitrarily selecting five distinct sets of sources which feature links to such
videos. Two of these sets aim to capture mainstream
use by focusing on “Top” videos listed on Reddit and Wikipedia. The first set, denoted as “Reddit top” con-sists of the YouTube URLs contained in the most voted-up posts of 20 of the most subscribed subreddits (i.e., forums) listed on redditlist.com. The second set gath-ers the 5 most viewed videos from the 50 YouTube nels listed on the “List of most-subscribed YouTube chan-nels” Wikipedia page [33], which we denote as “Wikipedia
Top”. This yields a diverse range of popular content
mainly categorized by YouTube as “Music”, “Entertain-ment”, “Howto & Style” or “Science & Technology”. The remaining sets focus on the activity surrounding the 2019 European Parliament election. While not as pop-ular or representative of the use of YouTube, focusing on this context also contributes to reach political and election-related content. More precisely, the third set, de-noted as “Twitter”, consists of the most shared YouTube video links found on the micro-blogging platform over the 3 weeks leading to the 2019 European Parliament Elections and associated with a set of 22 hashtags that were manually selected to cover discussions related to the elections in 4 European languages: English, French, German and Italian (such as #EuropeanElections2019, #Europeennes2019, #Europawahl2019, #elezionieuropee, among others). The fourth and fifth sets are based on channels of political parties engaged in the 2019 Euro-pean elections in France and in Germany. In Germany, we focus on the 13 political parties that obtained a seat after the vote. In France, we equivalently consider the 13 main parties in descending order of obtained votes. In both cases, we identify the ten most viewed videos on each channel. We denote these seed sets respectively as “Political DE” and “Political FR”. This political selection yields a more homogeneous set of videos than the main-stream ones: the three subsets consist of content that is principally categorized by YouTube as “News & Politics”.
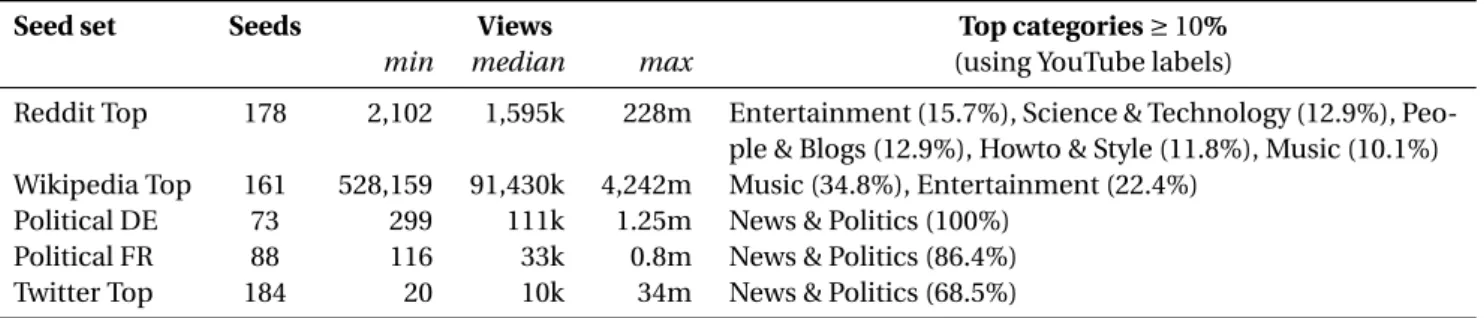
Table 1 gathers basic statistics for these seed sets.
Server errors, videos deleted during the data acquisition process and a handful unidentified crawling and pars-ing errors explain the discrepancy between the number
Table 1: Seed categories and basic statistics.
Seed set Seeds Views Top categories ≥ 10%
min median max (using YouTube labels)
Reddit Top 178 2,102 1,595k 228m Entertainment (15.7%), Science & Technology (12.9%),
Peo-ple & Blogs (12.9%), Howto & Style (11.8%), Music (10.1%)
Wikipedia Top 161 528,159 91,430k 4,242m Music (34.8%), Entertainment (22.4%)
Political DE 73 299 111k 1.25m News & Politics (100%)
Political FR 88 116 33k 0.8m News & Politics (86.4%)
Twitter Top 184 20 10k 34m News & Politics (68.5%)
of videos targeted for each set and the number of actually extracted seeds. While selecting IDs in a purely random manner across the platform could yield a more uniform sampling of video IDs on YouTube, it could bear the po-tential risk of overemphasizing insignificant videos with an extremely limited audience (using a protocol similar to [29], we verify that this would indeed be the case: a se-lection of 50 such random videos yields a median number of views of 115, far below the seed categories considered here).
Each HTTP request for the recommendations attached to a YouTube video returns a set of a maximum of 20 sug-gestions (in practice, exactly 20 sugsug-gestions four fifth of the time, and 19 about a fifth of the time). Our first con-ception of a model of a user navigating through these node-centric recommendations would thus consist of a walk in a directed recommendation graph whose nodes all have an out-degree of 19-20. However, for a given video, this set appears to fluctuate significantly from a re-quest to the other, bearing the risk of exploring a very un-stable and thus unreliable recommendation graph: exam-ining the temporal features of these suggestions is thus a prerequisite to construct such a graph.
To this end, we proceed with a long crawl centered on seeds and aimed at understanding the variation and po-tential evolution of suggestion sets across successive re-quests. Along the way, we also collect video metadata such as the number of views and appreciation statistics: number of thumbs up (likes), down (dislikes). For each seed, we carry out a total of 2,000 requests at a regular av-erage interval of about 10 minutes, thus covering a bit less than two weeks of sampling. This yields a node-centric time series of sets of suggestions.
Stability of a recommendation plateau
We first compute the frequency of occurrence and recur-rence aggregated over a certain number of requests R in order to appraise the stability of suggestions and thus of the related network. Irrespective of the sampling dura-tion, yet even more so for shorter time spans, a “plateau” of consistently highly frequently suggested videos quickly emerges (several of them are often recommended nearly 100% of the time), beyond which occurrence frequencies decrease steeply. The size of this plateau may be dynam-ically determined through a simple change-point analy-sis restricted to suggestions appearing at least, say, 1% of
the time. This lower bound does not significantly change the position of the detected change point but is needed to prevent the very flat long tail of the distribution to in-terfere with the detection process. The plateau is gener-ally found to feature between around 20 and 30 videos
(µ = 23.6, σ = 5.15). Nonetheless, its erosion over time
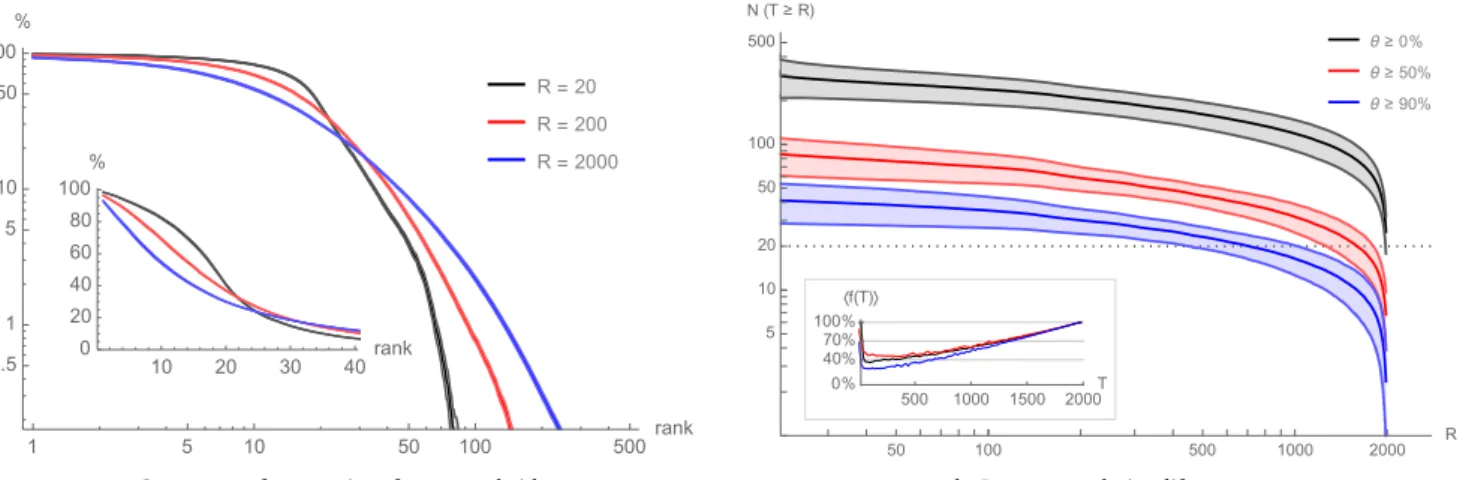
suggests the existence of a slow renewal process. In the longer term, the ordered distribution of occurrence fre-quencies progressively takes the shape of an heteroge-neous distribution apparently exhibiting a power-law-like tail with a cut-off. In figure1b, we gather the frequency of occurrence of videos with respect to their rank, for var-ious durations of aggregation. For instance, we see that the tenth most frequent suggestion after R = 200 requests (i.e. over about 33.3 hours, red curve) appears about 70% of the time. For all sampling durations R = 20, 200 and 2000, and all the more for the shorter ones, occurrence frequency is relatively high up to the ∼20th most frequent suggestion and then markedly decreases afterwards. This suggests that exit routes leaving from a given seed and, thus, the recommendation graph induced by mean-field suggestions, are rather stable when observed on a rela-tively short time span of a couple of days.
To further qualify this observation, we turn to the study of the lifespan of suggestions. For a given seed video, we define the occurrence frequency of a suggested video s
over a sliding window of r sampling requests asθ(s). We
fix r = 20, consistently with the above-observed minimal amount of requests needed to observe a robust plateau. We then denote as T (s) the lifespan of s, defined as the difference between the first and the last moment where
its average occurrence frequency θ(s) goes above a
cer-tain threshold. Put simply, the lifespan of a suggestion is such that it appeared above this threshold frequency at two moments separated by such a length of time. This does not mean, however, that it appeared consistently above this threshold over that length of time. We plot the numbers of suggestions having a lifespan of at least T (in-stead of exactly T , since we ignore what happens before or after we started collecting data). Figure1ashows the
distribution of lifespans for various thresholds: θ ≥ 0%
corresponds to suggestions appearing at least once (i.e.
at all), whereasθ ≥ 90% focuses on very dominant
sug-gestions which appear at least 90% of the time over their lifespan and thus principally belong to the plateau. While this graph exhibits a relatively large number of short-lived suggestions, it also demonstrates that the plateau videos
R = 20 R = 200 R = 2000 1 5 10 50 100 500rank 0.5 1 5 10 50 100 % 10 20 30 40rank 0 20 40 60 80 100 %
(a) Occurrence frequencies of suggested videos
θ ≥ 0% θ ≥ 50% θ ≥ 90% 50 100 500 1000 2000 R 5 10 20 50 100 500 N (T ≥ R) 500 1000 1500 2000T 0% 40% 70% 100% 〈f(T)〉 (b) Recommendation lifespans.
Figure 1: (a). Number of recommendations with a lifespan T ≥ R for various thresholds θ ≥ 0%, θ ≥ 50% and θ ≥ 90%} (averages are central lines, along with their 95%-confidence intervals). A lifespan of T means that a recommendation appeared at leastθ% of the time over a sliding window of r = 20 successive requests, at two distinct moments at least T requests apart. Inset: average presence of a suggestion over its lifespan as a function of the lifespan (again for the three thresholds). (b). Recommendation lifespans after R sampling requests, ordered by rank, averaged over all seeds. Inset: zoom on the inflection area typically occurring around the 20thsuggestion for R = 20.
are likely to be present for a significant time. This is all the more as suggestions with higher lifespans also appear more frequently across their lifespan and not just at its ex-tremities, as demonstrated by the inset in figure1a.
This bears two conclusions when considering the rec-ommendation graph induced by suggestions. First, focus-ing on the plateau would suffice as it concentrates most of the density of suggestion occurrence. This plateau has a modal distribution size and thus entails a network with a modal, homogeneous degree distribution – a quite pecu-liar object with respect to classical web topologies, which are generally heterogeneous. Second, this graph should be relatively stable in the short term, which substantiates the idea that a graph exploration protocol spanning over a short period would plausibly approximate well the rec-ommendation graph faced by users during a navigation session.
Induced recommendation graphs
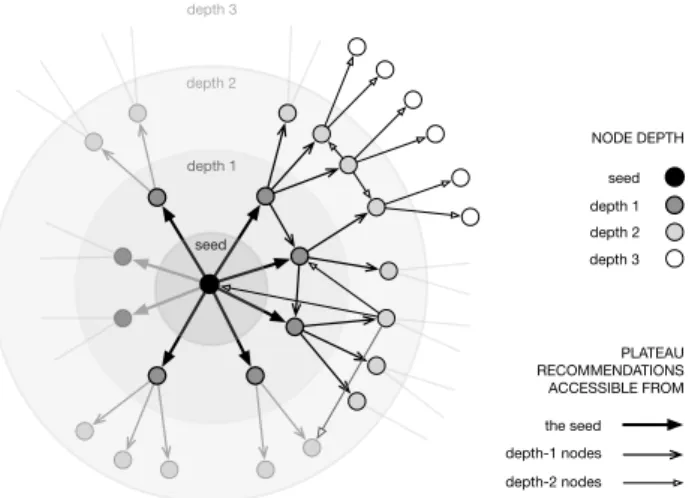
For each seed video, we now recursively crawl sugges-tions belonging to the above-evoked plateau computed by changepoint analysis for 20 requests. We repeat this until reaching a depth of 3, which constitutes the horizon we consider for recommendation graphs. In other words, the graph induced by a seed video contains its direct sug-gestions and two levels of indirect sugsug-gestions, as well as all the links between these nodes. See an illustration in figure2. Choosing an arbitrary depth of 3 is a trade-off between sampling frequency (to keep a reasonable band-width with YouTube servers) and sufficiently deep explo-ration of the various graphs. They are each collected in about 58.2hr (±13.6) which roughly remains within the plateau stability window (this corresponds to the timeelapsed after about 350 requests in figure1a). Graphs
contain an average of 3179 ± 1258 nodes and 7263 ± 2233 edges. We crawled plateaus from nodes up to depth 2 (i.e., for around 89.0k videos) and thus visited nodes up to depth 3 (reaching a total of 540k videos).
Graph entropy, diversity and confinement
We are specifically interested in exploring confinement within recommendation graphs. To this end, we devised two metrics. The first one is based on random walks, which play the role of a very simple and abstract model of user navigation (e.g., [25], to describe graph families). Random walks always start from ego (the seed video of the induced recommendation graph), and terminate when they reach a length of 20. Results were not very sensi-tive to this constant, unless it is so small that meaning-ful walks can no longer be captured (< 5). Other plausible random walk strategies include a restart once revisiting a node, or a restart once revisiting ego. Again, we found very similar results under such strategies, so we settled for the simplest one. We measure the diversity of visited nodes by computing the information entropy of the set of fre-quencies of visits. For one random walk, we refer to this
measure asη. For each graph we perform 100,000 random
walks – again, a value chosen to be high enough so that the results are stable across runs. The mean random walk en-tropy (η) gives us an estimation of the confinement of an idealized user exploring the recommendation graph from ego. The lower the entropy / diversity, the higher the con-finement. Another metric that we consider is the number of nodes in a recommendation graph (N ). This configures a direct measure of the number of video recommenda-tions that can be accessed from ego while not exceeding our maximal depth, independently of the probability of a user reaching a given node. Given that all out-degrees are
seed depth 1 depth 2 depth 3 NODE DEPTH the seed depth-1 nodes depth-2 nodes PLATEAU RECOMMENDATIONS ACCESSIBLE FROM seed depth 1 depth 2 depth 3
Figure 2: Illustration of the recursive crawl focused on a
given seed video. Recommendations are crawled for the
seed until a plateau may be estimated, which defines the direct neighbors of the seed and a set of nodes at depth 1. This process is repeated for all nodes at depth 1 in paral-lel, thus defining depth 2, and again with nodes at depth 2. In the end, the recommendation graph induced by the seed contains nodes at depths 1 and 2 and potentially in-cludes links towards already explored nodes, i.e. at depth 0 (seed), 1 (seed’s direct neighbors) and 2 (seed’s indirect neighbors). There are on average 23.6 nodes at depth 1
(σ = 5.15), 325 nodes at depth 2 (σ = 98.23) and 2830
nodes at depth 3 (σ = 1160). Some elements are shaded
simply to indicate that we do not represent all nodes and links on this figure for the sake of clarity.
roughly equal to 20 and maximal depth is 3 for all graphs, N becomes indeed smaller when the set of targets acces-sible from the graph exhibits redundancy. To summarize, the first metric measures the propensity for diversity from the perspective of an idealized user following recommen-dations, and is determined by the topology of the graph. The second metric measures the global potential for di-versity of the graph, independently of user behavior, and is simply determined by the size of the set of recommen-dations up to a certain depth.
In figure 3 we show that the two metrics are
nega-tively correlated (ρ = −0.71). This is somewhat counter-intuitive: it means that the more diverse the mean random walk is, the less diverse the graph is, overall. The dots in the scatter plot are colored according to the number of views of ego on a log scale. The darker the dot, the more views ego has. This helps illustrate another interesting fact: number of views are positively correlated with mean random walk entropy (ρ = 0.36) and negatively correlated
with the number of nodes in the graph (ρ = −0.44). All
of these correlations have a p-value < 0.0001. It appears that, as videos receive views, their overall recommenda-tion graphs contract, becoming significantly smaller in number of nodes, while the diversity of the mean ran-dom walk increases. We first provide illustrative visualiza-tions of three sample graphs, corresponding to the closest
graphs to the two extremes and the middle point of the regression line. These sample graphs provide a prelimi-nary intuition of how topology changes across the spec-trum defined by the correlation line.
Higher random walk entropy thus corresponds to smaller graphs, as well as denser graphs: there is a strong
correlation betweenη and 〈k〉, the average degree of the
graph (ρ = 0.82). Graph contraction goes with increased
connectivity – in the sense that everywhere is more ac-cessible from everywhere else: even if the number of po-tentially accessible videos gets smaller (as graph size N decreases), the number of actually accessible videos in-creases (as further exemplified by the very strong
corre-lation between NV and η). Put differently, graph
con-traction nevertheless results in more isotropy in a smaller space: graphs with higher entropy lead to more videos
being visited on average (higher NV) whereas they stem
from a smaller potential selection (smaller N ).
Furthermore, we could confirm that graphs with higher η (i.e., more diverse random walks while having a smaller N ) do also qualitatively appear to users to be more con-fined semantically. To substantiate this empirically, we designed a simple human-based protocol. We produced three sets of 20 seed videos which are closest respec-tively to each extreme and the middle point, similarly to the above procedure. We recruited six participants: each of them received plateau recommendations for 20 seed videos randomly selected among the 60, without know-ing anythknow-ing about them. We then asked them to tell us, for each seed, whether plateau videos are similar to one another or not, on a scale of 5 stars, from most similar
(*****)to least similar(*). We gathered the aggregation of their subjective evaluation of the semantic confinement of plateau videos in figure4. We see that region 1 videos were perceived as most confined, while region 3 videos were seen as least similar, thus confirming a link between η and semantic confinement.
Confinement and seed properties
To expand our empirical exploration of confinement, we consider a number of other metrics. For the seed videos, we consider their age in seconds (a), their number of likes (l ) and dislikes (d ), and the number of subscribers (s) of the channel that they belong to. For the recommendation graphs, we apply the same random walk strategy to mea-sure confinement or diversity in terms of video authors (ηa) and categories (ηc), as provided by YouTube.
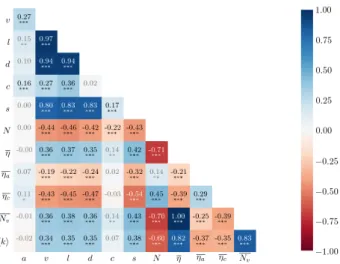
In figure5we present the correlations found between
the above-mentioned metrics as well as the two original diversity metrics (η and N) and the number of views (v). It can be observed that all metrics that correspond to ex-plicit user actions (v, l and d ) are highly inter-correlated, and also highly correlated with the number of subscribers (s) of the channel of the seed video, hinting at an audi-ence effect. To evaluate consensus around a video, we also derive from l and d a contentment index (c), com-puted as the log of the ratio of the number of likes (plus one, for consistency reasons regarding the log) over the
(a) Induced recommendation graphs plotted according to number of nodes in the graph (N ) and mean random walk entropy (η). Points are colored according to number of views, on a log scale presented on the right. Solid green lines indicate medians, red dashed line is a linear regression of the distribution. Three points are marked in this latter line: one at each extremity and one in its middle.
(b) Sample graph 1 (c) Sample graph 2 (d) Sample graph 3
Figure 3: Induced recommendation graphs and sample visualizations. The three sample graphs (b), (c) and (d) are the closest ones to the three points indicated in the regression line of plot (a). Nodes (and adjacent edges) are colored according to the category of the video they correspond to.
number of dislikes (plus one, to avoid divisions by zero) i.e., c = log(d +1l +1). There are generally more likes than dis-likes and the opposite happens in about only 0.6% of the cases. Interestingly, this index is at best weakly correlated with explicit actions, thus denoting an intrinsic property of videos. As for the two extra random walk entropy mea-sures, we find that unlikeη, ηcis positively correlated with
N (ρ = 0.45), and that ηa is only very weakly correlated
with N (ρ = 0.14). The mild positive correlation between ηcand N is already hinted at by the category coloring of the sample graphs in the lower panel in figure3. As al-ready mentioned, mean number of distinct visited nodes
per random walk (Nv) and mean degree (〈k〉) are very
Region 1 Region 2 Region 3 * ** *** **** *****
Figure 4: Human evaluation of confinement. Plateau recommendations for seed videos stemming from region 1 (largest entropyη) are generally perceived as most sim-ilar (five stars), while the opposite holds for region 3. Re-gion 2 appears as a middle way.
Figure 5: Pearson correlations between various recom-mendation graph metrics. Asterisks indicate significance: *** for P < 0.0001, ** for P < 0.001, * for P < 0.01.
close to no correlation with any of the metrics, except for a weak correlation with v (ρ = 0.27).
A plausible interpretation for the interplay between random walk diversities (especiallyη and ηc), recommen-dation graph size (N ) and number of views (v), arises from modeling the recommendation engine as a
knowledge-discovery process. By viewing a video, the user
pro-vides empirical data on the probability of relatedness of the video being watched and all the videos the user has watched before. Of course, there are certainly myriad im-plementation details on how different signals and pieces of information about the user and the video are taken into account to tweak the recommendation process. Here we are not interested in reverse-engineering a given recom-mendation engine, but instead in using empirical data to try to uncover more general dynamics from a user’s per-spective. This is of particular interest to understand how a generic recommendation engine may mediate the explo-ration of a given cultural space by human actors. Inde-pendently of the details, it appears trivial to assume that users viewing videos also provide a connection between
this video and the videos previously seen by them. The observation that the age of a video has almost no corre-lation with any of the other metrics goes in favor of this interpretation: the dynamics of the system appears to be dominantly driven by the actions of its users.
This standpoint invites us to take the number of nodes in the recommendation graph as an expression of uncer-tainty. The user is given more choices, but these choices lead to more constrained paths. As a video receives views, and so knowledge about relatedness of this video to other videos in the system increases, recommendations be-come possibly more focused: smaller in overall number, but more inter-related between themselves, and thus fur-ther constraining the user in a general sense, while pro-viding a more diverse navigation path, in terms of distinct video IDs, within this more constrained realm. This inter-pretation is given further credence by the fact that, even
though random walk video diversityη increases with N,
random walk category diversity ηc decreases. In other
words, the user is exposed to a higher diversity of unique videos on a less diverse set of topics.
Confinement and transitions
We dig further this notion of topical confinement by fo-cusing on the node level and especially the navigations in-duced by jumping from a video to another one. More pre-cisely, for each node that appears in any crawl, we com-pute the outgoing transition probabilities for immediate recommendations i.e., we examine dyadic directed links from a node to the members of the plateau found for that node. We distinguish three types of features related to topics, on the one hand, and to explicit user actions, on the other hand; all of which are linked to some intrinsic property of a seed video (semantics, popularity, consen-sus):
• topical categories, found in the meta data of the re-spective videos. We focus on the six top categories in the whole data set (News & politics, Entertainment, Music, People & Blogs, Science & technology, Howto & Style). YouTube provides for many other possible categories which each appear less than a dozen times here, so we gathered them as “[Other]”.
• contentment indices, defined as before as the log of the ratio of likes over dislikes. Since negative values are rare, we gather them into a single category de-noted as “negative”. Integer ranges strictly above 4 are also strongly underpopulated (less than a dozen of occurrences each) and are, again, gathered as “[Other]”.
• number of views, binned as quartiles whose bound-aries are {143k, 960k, 5.31m} views.
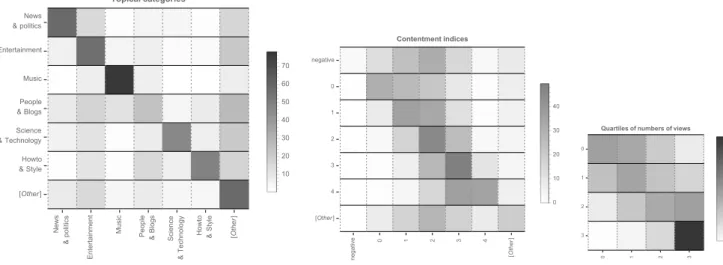
In figure 6, we show the likelihood of jumping from a
video with some property to a recommended video of the plateau with some property as transition matrices. Re-sults are aggregated over all nodes appearing in the var-ious seed-centric crawls.
News & politics Entertainment Music People & Blogs Science & Technology
Howto &Style [Other
] News & politics Entertainment Music People & Blogs Science & Technology Howto & Style [Other] Topical categories 10 20 30 40 50 60 70 negative 0 1 2 3 4 [Other ] negative 0 1 2 3 4 [Other] Contentment indices 0 10 20 30 40 0 1 2 3 0 1 2 3
Quartiles of numbers of views
10 20 30 40 50 60 70
Figure 6: Recommendation transition matrices for all nodes, with respect to topical categories (left), contentment index (middle) and quartiles of numbers of views (right).
For one, it appears that topical categories are also gen-erally topological categories, even though we observe large variations across topics: from “Music” which is mas-sively self-reinforcing, to “People & blogs” which rather redistribute users toward other topics, especially “Enter-tainment”.
The effect of “contentment” displays a quite different picture. There are few negatively rated videos and con-tentment typically ranges between 1 and 3. Yet, there is also a tendency to redistribute users toward videos which are more positively rated so, in a sense, the recommenda-tion landscape does not confine users into controversial areas.
Views follow a rather automorphic tendency where, ir-respective of the origin quartile, recommended videos generally exhibit the same order of magnitude as the ori-gin video. This effect is particularly strong for the most viewed videos. As such, the recommendation landscape does not seem to push viewers of less viewed videos to-wards most viewed videos. Furthermore and similarly, mainstream videos do not appear to forward users to-wards less viewed videos, which seems to be likely to in-duce a reinforcement mechanism in these areas, oppo-site to the conclusions of [28]. One may suggest that we just observe here the result of an a posteriori redistribu-tion mechanisms where videos recommended from the most viewed ones incidentally garner views and end up in the highest quartile as well. This possibility is however invalidated by the computation of these transition matri-ces restrained to newly appearing videos only i.e., videos that were not part of the plateau when collecting recom-mendation graphs (see below): these matrices do exhibit exactly the same patterns as the ones shown on figure6.
In other words and to summarize, following mean-field recommendations, users are incited (1) to navigate within the same topical category, especially so for mu-sical and political/news videos, (2) to remain in sets of videos which have rather comparable numbers of views, especially so for mainstream videos, and (3) to go towards
more consensual videos, to a lesser extent when videos are moderately consensual.
Evolution of recommendation graphs and
ori-gin of novelty
We previously observed that recommendation sets at-tached to a seed video slowly evolve with time. New sug-gestions appear in the plateau over time. We may ask in which direction does the introduction of novelty in rec-ommendation sets alter the picture that we sketched so far and, in particular, where do new suggestions come from and what percentage of them stems from inside vs. outside the known recommendation graph. Put dif-ferently, is novelty really novel? To check this, we con-sider as novelty the new plateau suggestions for seed videos appearing at the end of the long crawl i.e., R = 2000 requests after the recommendation graph has been collected. We first notice that percentages vary greatly across seed videos, as shown on the left panel in figure7: most plateaus nevertheless exhibit at least a third of novel videos, with an average of about 58%. However, many of these novel recommendations can be found not far in the recommendation graph, at depth 2 or 3. In other words, a significant portion of suggestions at R = 2000 come from inside the known graph at R = 0 (almost four in five): rein-forcement is also at work here, in the sense that new sug-gestions are either direct or indirect neighbors.
Similarly, we could also verify that transitions matri-ces restricted to novel recommendations are of the same nature as those which were observed in figure6: the ag-gregated matrices look almost indistinguishable from the original matrices (we thus do not shown them here).
Concluding remarks
This work was focused on recommendation graphs ex-tracted from YouTube. Two types of findings were at-tained: firstly about the temporal dynamics of the
mean-rank 20% 40% 60% 80% 100%
Novelty after 2000 steps
rank 20% 40% 60% 80% 100%
Proportion of novelty stemming from depth 2 or 3 after 2000 steps
d=1 d=2 d=3 purely new 20% 40% 60% 80% 100%
Origin of plateau videos at t+2000steps
(average over all seeds)
Figure 7: Provenance of new suggestions for seed videos. Left: Distribution of the percentage of novelty: percentage of plateau recommendations which are new at the end of the long crawl (after R = 2000 requests) vs. its beginning. Middle: Distribution of the percentage of such novelty which could already be found deeper in the recommendation graph at the beginning of the crawl. Right: Average, over all seeds, of the provenance of plateau recommendations, with respect to their position in the recommendation graph. Error bars indicate standard deviations.
field recommendations provided by the platform for a given seed video, and secondly about the configuration of local recommendation graphs centered around seed videos, especially in regard to confinement and diver-sity. The former does not aim at reverse-engineering: it is purely instrumental to the purpose of the latter. In this re-spect, we could exhibit a plateau of highly frequently sug-gested videos and characterized this phenomenon statis-tically, both in terms of size and duration. This led to an exploration and retrieval protocol that is both compu-tationally feasible and leads to observables – the recom-mendation graphs – with well-justified and empirically grounded boundaries. Recommendation graphs are, for one, a peculiar sort of networks, with a modal degree dis-tribution.
In turn, the analysis of these graphs according to sev-eral metrics, notably measures of confinement, led to a better understanding of recommendation dynamics, in-cluding its interaction with users. In a nutshell, be it in topological, topical or temporal terms, the landscape of what we call mean-field YouTube recommendations gen-erally exhibits confinement. However, we could also show that this claim must be nuanced in various directions.
• First, recommendation graphs exhibit a wide range of values of entropies: some graphs are more con-fined or confining than others. Counter-intuitively, higher entropies (in terms of navigation) are associ-ated with lower diversity (in terms of distinct num-ber of accessible videos). This hints at a dichotomy where some seed videos are at the root of an isotropic navigation (higher entropy) in a more limited space of videos (lower size).
• Second, we could demonstrate that higher entropies are found for seed videos with a higher number of
views. We hypothesized that a higher popularity
means that more information could be collected and thus plausibly enabled the platform to refine and in passing contract the associated recommendation graph. This contributes to hint at a dynamic of in-creasing confinement driven by user activity.
• Third, we exhibited the existence of confinement in topical terms (categories are endogenous), tempo-ral terms (seemingly new recommendations are not to be found too far in the recommendation graph), popularity terms (high view videos transition to high view videos, keeping in mind the correlation be-tween the number of views and topological confine-ment), but not in contentment terms.
Future work should certainly appraise a variety of other modes of recommendation (such as personalized sugges-tions), other types of behavior (such as organic naviga-tion, whereby users search for videos by themselves) and a mix thereof (such as browsing on subscription-based channels). On the whole, the analysis of the graphs we extracted nonetheless demonstrate the diversity of navi-gation anisotropy on YouTube in a variety of dimensions. They also suggest that the most confined graphs i.e., po-tential bubbles, are organized around videos that garner the highest audience and plausibly viewing time. Admit-tedly, our work could help devise algorithms that make users aware of their possible confinement, in line with [34] and [35]. While our results further indicate that it is difficult to provide a binary answer to the question of confinement on this platform, they appear to nuance the emerging picture in the literature that implicit recom-mendation has a neutral or even horizon-expanding role.
Acknowledgements
We are grateful to Katharina Tittel for her participation in the Twitter data set perimeter definition, and to Lucie Lamy, Serge Reubi and Ay¸se Yuva for their kind contribution to the human-based confinement evaluation step. This paper has been par-tially realized in the framework of the “Algodiv” grant (ANR-15-CE38-0001) funded by the ANR (French National Agency of Re-search) and the “Socsemics” Consolidator grant funded by the European Research Council (ERC) under the European Union’s Horizon 2020 research and innovation program (grant agree-ment No. 772743).
References
[1] Nguyen TT, Hui PM, Harper FM, Terveen L, Konstan JA (2014) Exploring the filter bubble: the effect of using rec-ommender systems on content diversity in Proceedings
of the 23rd international conference on World wide web.
(ACM), pp. 677–686.
[2] Bakshy E, Messing S, Adamic LA (2015) Exposure to ideo-logically diverse news and opinion on facebook. Science 348(6239):1130–1132.
[3] Aiello LM, Barbieri N (2017) Evolution of ego-networks in social media with link recommendations in Proceedings of
the Tenth ACM International Conference on Web Search and Data Mining. (ACM), pp. 111–120.
[4] Datta H, Knox G, Bronnenberg BJ (2018) Changing their tune: How consumers’ adoption of online streaming af-fects music consumption and discovery. Marketing Science 37(1):5–21.
[5] Roth C (2019) Algorithmic distortion of informational land-scapes. Intellectica 70(1):97–118.
[6] Haim M, Graefe A, Brosius HB (2018) Burst of the filter bub-ble? effects of personalization on the diversity of google news. Digital Journalism 6(3):330–343.
[7] Bessi A, et al. (2016) Users polarization on facebook and youtube. PLoS ONE 11(8):e0159641.
[8] Möller J, Trilling D, Helberger N, van Es B (2018) Do not blame it on the algorithm: an empirical assessment of multiple recommender systems and their impact on
con-tent diversity. Information, Communication & Society
21(7):959–977.
[9] Thurman N, Schifferes S (2012) The future of personaliza-tion at news websites. Journalism Studies 13(5–6):775–790. [10] Zuiderveen Borgesius FJ, et al. (2016) Should we worry
about filter bubbles? Internet Policy Review 5(1).
[11] Dylko I, et al. (2017) The dark side of technology: An ex-perimental investigation of the influence of customizabil-ity technology on online political selective exposure.
Com-puters in Human Behavior 73:181 – 190.
[12] Munson SA, Resnick P (2010) Presenting diverse political opinions: how and how much in Proc. SIGCHI Conf. on
hu-man factors in computing systems. (ACM), pp. 1457–1466.
[13] Chen J, Nairn R, Chi EH (2011) Speak little and well: Rec-ommending conversations in online social systems in Proc
CHI’11 Vancouver, BC, Canada. pp. 217–226.
[14] Rader E, Gray R (2015) Understanding user beliefs about al-gorithmic curation in the facebook news feed in Proc. ACM
CHI’15. pp. 173–182.
[15] Salganik MJ, Dodds PS, Watts DJ (2006) Experimental study of inequality and unpredictability in an artificial cultural market. Science 311:854–856.
[16] Steck H (2011) Item popularity and recommendation ac-curacy in Proc. RecSys’11, Oct 23-27, 2011, Chicago, IL. pp. 125–132.
[17] Messing S, Westwood SJ (2014) Selective exposure in the age of social media: Endorsements trump partisan source affiliation when selecting news online. Communication
Re-search 41(8):1042–1063.
[18] Munson SA, Lee SY, Resnick P (2013) Encouraging read-ing of diverse political viewpoints with a browser widget in
Proc. ICWSM 7th AAAI Intl. Conf. Weblogs and Social Media.
(AAAI press), pp. 419–428.
[19] Nicas J (2018) How youtube drives people to the internet’s
darkest corners
(https://www.wsj.com/articles/how- youtube-drives-viewers-to-the-internets-darkest-corners-1518020478).
[20] Tufekci Z (2018) Youtube, the great radicalizer
(https://www.nytimes.com/2018/03/10/opinion/sunday/youtube-politics-radical.html).
[21] Conover MD, et al. (2011) Political polarization on twitter in
Fifth international AAAI conference on weblogs and social media.
[22] Barberá P, Jost JT, Nagler J, Tucker JA, Bonneau R (2015) Tweeting from left to right: Is online political
communica-tion more than an echo chamber? Psychological science
26(10):1531–1542.
[23] Jacobson S, Myung E, Johnson SL (2016) Open media or echo chamber: the use of links in audience discussions on the facebook pages of partisan news organizations.
Infor-mation, Communication & Society 19(7):875–891.
[24] Vicario MD, Zollo F, Caldarelli G, Scala A, Quattrociocchi W (2017) Mapping social dynamics on facebook: The brexit debate. Social Networks 50:6 – 16.
[25] Garimella K, Morales GDF, Gionis A, Mathioudakis M
(2018) Quantifying controversy on social media. ACM
Transactions on Social Computing 1(1):3.
[26] Davidson J, et al. (2010) The youtube video recommenda-tion system in Proceedings of the fourth ACM conference on
Recommender systems. (ACM), pp. 293–296.
[27] Covington P, Adams J, Sargin E (2016) Deep neural net-works for youtube recommendations in Proceedings of the
10th ACM conference on recommender systems. (ACM), pp.
191–198.
[28] Zhou R, Khemmarat S, Gao L (2010) The impact of YouTube recommendation system on video views in Proceedings of
the 10th ACM SIGCOMM conference on Internet measure-ment. (ACM), pp. 404–410.
[29] Park M, Naaman M, Berger J (2016) A data-driven study of view duration on youtube in Tenth International AAAI
Con-ference on Web and Social Media.
[30] Zhou R, Khemmarat S, Gao L, Wan J, Zhang J (2016) How youtube videos are discovered and its impact on video
views. Multimedia Tools and Applications 75(10):6035–
6058.
[31] Cheng X, Dale C, Liu J (2008) Statistics and social network of youtube videos in 2008 16th Interntional Workshop on
Quality of Service. (IEEE), pp. 229–238.
[32] Airoldia M, Beraldo D, Gandini A (2016) Follow the algo-rithm: An exploratory investigation of music on youtube.
Poetics 57(August):1–13.
[33] Wikipedia (2019) List of most-subscribed YouTube
channels
(https://en.wikipedia.org/wiki/List_of_most-subscribed_YouTube_channels). [Online; accessed
15-May-2019].
[34] Resnick P, Garrett RK, Kriplean T, Munson SA, Stroud NJ (2013) Bursting your (filter) bubble: Strategies for promot-ing diverse exposure in CSCW ’13 Companion, Feb. 23–27,
2013, San Antonio, Texas, USA. pp. 95–100.
[35] Ekstrand MD, Kluver D, Harper FM, Konstan JA (2015) Let-ting users choose recommender algorithms: An experi-mental study in Proc. ACM RecSys’15 Ninth ACM Conf. on