HAL Id: hal-02619286
https://hal.uca.fr/hal-02619286
Preprint submitted on 25 May 2020
HAL is a multi-disciplinary open access
archive for the deposit and dissemination of sci-entific research documents, whether they are pub-lished or not. The documents may come from teaching and research institutions in France or
L’archive ouverte pluridisciplinaire HAL, est destinée au dépôt et à la diffusion de documents scientifiques de niveau recherche, publiés ou non, émanant des établissements d’enseignement et de recherche français ou étrangers, des laboratoires
Jean-Louis Combes, Mary-Françoise Renard, Shuo Shi
To cite this version:
Jean-Louis Combes, Mary-Françoise Renard, Shuo Shi. Have unequal treaties fostered domestic mar-ket integration in Late Imperial China ?. 2020. �hal-02619286�
C E N T R E D' ÉT U D E S E T D E R E C H E R C H E S S U R L E D E V E L O P P E M E N T I N T E R N A T I O N A L
SÉRIE ÉTUDES ET DOCUMENTS
Have unequal treaties fostered domestic market integration in
Late Imperial China?
Jean-Louis Combes
Mary-Françoise Renard
Shuo Shi
Études et Documents n° 4
May 2020
To cite this document:
Combes J.-L., Renard M.-F., Shi S. (2020) “Have unequal treaties fostered domestic market integration in Late Imperial China ? ”, Études et Documents, n° 4, CERDI.
CERDI
POLE TERTIAIRE
26 AVENUE LÉON BLUM
F-63000 CLERMONT FERRAND TEL.+33473177400
The authors
Jean-Louis Combes
Professor, School of Economics, University of Clermont Auvergne, CNRS, CERDI-IDREC, F-63000 Clermont-Ferrand, France.
Email address: j-louis.combes@uca.fr
Mary-Françoise Renard
Professor, School of Economics, University of Clermont Auvergne, CNRS, CERDI-IDREC, F-63000 Clermont-Ferrand, France.
Email address: m-francoise.renard@uca.fr
Shuo Shi
PhD Candidate in Economics, Fudan University, CCES, China. Email address: shishuostone@foxmail.com
Corresponding author: Mary-Françoise Renard
This work was supported by the LABEX IDGM+ (ANR-10-LABX-14-01) within the program “Investissements d’Avenir” operated by the French National Research Agency (ANR).
Études et Documents are available online at: https://cerdi.uca.fr/etudes-et-documents/
Director of Publication: Grégoire Rota-Graziosi Editor: Catherine Araujo-Bonjean
Publisher: Mariannick Cornec ISSN: 2114 - 7957
Disclaimer:
Études et Documents is a working papers series. Working Papers are not refereed, they constitute research in progress. Responsibility for the contents and opinions expressed in the working papers rests solely with the authors. Comments and suggestions are welcome and should be addressed to the authors.
Abstract
The objective of the paper is to study the relationship between international trade openness and domestic market integration in Late Imperial China. More specifically, we focus on a natural experiment namely the Unequal Treaties of the second half of the nineteenth century that lifted the long-existing international trade restriction system.
The integration of domestic markets is analyzed while looking at the existence of a long term common movement in the grain prices between provinces. The econometric results show that trade openness did not lead to better integration of the Chinese domestic grain markets. Our results support the hypothesis according to which long-distance trade has not generated efficiency gains in domestic markets. We evidence a strong segmentation between domestic and international grain markets owing to different traded products and operators.
Keywords
Market integration, Law of one prices, Late Imperial China.
JEL Codes
One of the main characteristics of China’s development is the mixing of political centralization and economic decentralization. It may result in fragmentation and inequalities across China’s provinces. This situation has expanded since the reform and open-up strategy was adopted in 1978, with trade and investment policies being concentrated in coastal provinces in a first time. More generally, the Chinese case raises a more general question concerning the relationship between trade openness and domestic market integration. Are the two dynamics independent or complementary? Does trade openness generates positive spillovers between external and domestic trade? In a country as large and geographically diverse as China, the topic of provincial market integration is crucial for understanding the movements of production factors and their impact on economic growth. This paper investigates the historical integration of China’s domestic markets. In contrast to the existing literature, we examine this market integration in the perspective of international trade environment. Specifically, we study
the impact of the unequal treaties signed during the 19th century and at the beginning of
the 20th century between the Qing dynasty (1644–1912) and foreign powers on the
domestic market integration. These unequal treaties have led, among other things, to trade openness. Thus, they can be seen as a natural experiment highlighting the impact of trade openness on domestic market integration.
More precisely, this paper econometrically evaluates domestic grain market integration before and after the unequal treaties. The Law of One price (LOP) in late imperial China (1736–1911) using the maximum likelihood (ML) method of cointegration developed by Johansen (1988) and Johansen and Juselius (1990) is thus tested. In addition, a robustness test based on price sigma convergence is implemented. It appears mainly that the unequal treaties have not led to a better integration of domestic cereal markets. They remain fundamentally fragmented in late imperial China. In the first section, we will explain the potential links between unequal treaties and the domestic market integration. In the second one, we will present the methodology and the data and in the
third one, we will give and comment the results.
1 - Unequal treaties and domestic market integration
Economic development has often been linked to market integration. This means there are strong relationships between different regions in a country that lead to prices convergence, the so-called “Law of One price” (LOP). The consequence is that one region depends on the situation of the other ones, more than its own history (Marshall, 1920). There are no or few economic restrictions on the mobility of goods and services, production factors and persons between them (Tinbergen, 1965).
This relationship has been used to understand why China did not face an industrial revolution as in Europe, with the hypothesis that market integration is an indicator of economic efficiency and more generally of development. During a long time, the underdevelopment in China, despite the unified political system was supposed to induce less integrated markets than in Europe and then explain the lag between the both. This idea has been weakened mainly by Pomeranz (2000) who suggested that China’s markets during the 18th century were closer to the markets described in the neo-classical
model than European ones. Shiue and Keller (2007) provided empirical support by studying 121 prefectural markets. However, these results have been challenged by other studies concluding on a disintegration of markets in Northern as well as Southern Chinese regions (Bernhofen and al., 2015, 2017, Gu and Kung, 2019).
China’s situation is very specific under the Qing dynasty (1644–1912). At the beginning of the period we are interested in, the Qing dynasty had good economic results, a territorial expansion and a growing population, from 138 million in 1700 to 381 million in 1820 and 430 in 1850, and an economic growth stronger than the Japanese one (Maddison, 2007). Political centralization was strong with a multi-level bureaucratic hierarchy. Nevertheless, with an increasing population and without substantial
improvement in agricultural productivity, market integration decreased after 1776 (Gu, 2013). Several rebellions weakened the government, the more important being the Taiping Rebellion (1850–1864). At its peak, the Taiping Heavenly Kingdom controlled 16 provinces most of which were the major tax revenue sources of the central government. To fight against this rebellion, the central government created a new type of army, which involved a strong delegation of power to the provincial authorities (Maddison, 2007). It has been very costly. The authorities could not anymore pay for the hydraulic structures, the banks of the Yellow River had been abandoned and it was impossible to use it to send grains to Beijing (Maddison, 2007). Then to increase it income, the government implemented a new tax, Lixin Tax, at the provincial level. “Political boundaries determine market size when commodity circulation is restricted by taxation, trade policies, and currency” (Gu, 2013, p.73). Brandt et.al. (2014) consider economic failure is due to an imperial institutional system that protected vested interests, as the local gentry. The revolts happening during this period induced a decrease in the level of standard of the population and the whole economic system has been weakened or collapsed during the treaties period.
Before the Qing Dynasty, China has been engaging in foreign trade since a long time, mainly with proximate countries mostly in Asia (Keller et.al., 2011). In the Ming Dynasty (1368–1644), tributary trade was accepted but controlled by the central government, or Chaoting, with stringent restrictions. Although the Qing dynasty adopted restrictive trade policy, several provinces were still allowed to maintain authorized coastal ports to international trade. In 1685, four customs were set up in the city of Canton (Guangdong Province), Xiamen (Fujian Province), Ningbo (Zhejiang Province), and Songjiang (Jiangsu Province) to regulate trade with foreign merchants. In the second half of the reign of Emperor Kangxi (1662–1722), foreign merchant ships were allowed to trade with China at all the ports specified. Trade regulation evolved into the Canton System (1757–1842) under which all the trade with the West was only allowed on the southern port of Canton (now Guangzhou) (Van Dyke, 2005). Foreign
trade was restricted, and rice exports were prohibited.
Since the mid-19th century, however, the Canton System gradually vanished: the
unequal treaties between the Qing government and the West knocked off the long-term trade restriction in China. As the result of military failure in the Opium War (1840–
1842), China was forced to sign the Treaty of Nanjing (1842). It abolished the traditional tributary system, liberalised the highly regulated trading system, legalizing the opium trade and opened additional ports to foreign trade. In addition to Guangzhou and the four treaty ports1 opened to foreign trade and residence by the Treaty of
Nanjing, more provinces in China were opened to foreign merchants by the following treaties. Based on the Treaty of Tianjin (1858), China opened Tainan, Haikou, Shantou, Haicheng, Nanjing, Penglai, Tamsui, Yantai, and Yingkou. The Convention of Beijing (1860) legalised Tianjing as a trade port. By the Traité de Paix (1885), Baosheng and Liangshan were opened. By the Treaty of Shimonoseki (1895), Shashi, Chongqing, Suzhou, and Hangzhou were opened to Japan. Therefore, most of Chinese provinces succumbed and opened trading ports to major industrial countries. Less regulated trade environment often improves, theoretically, market integration, though it takes a rather long historic process.
With new industrial enterprises in the ports, we could consider they need to increase the demand and then facilitate transportation. Several studies have been devoted to the relationships between transport costs and trade (Anderson and van Wincoop, 2004). With the invention of railways at the beginning of the 19th century, the transport costs which are one of the main obstacle to trade, decreased a lot in Europe, 36% in France between 1841 and 1851 (Caron, 1997). This resulted in an integration of markets and a spatial concentration of activities. This integration is very dependent on the quality of
infrastructures and its deterioration has a strong impact on trade (Limao and Venables, 2001). In the case of China, the openness arising from the treaties gave the opportunity for foreigners to produce in China and to trade with the mainland. Therefore, it should be an opportunity to invest in infrastructures, which could decrease transaction costs and fuel domestic market integration. Profit opportunities in international trade could have encouraged both private agents and the Chinese state to promote domestic trade (improvement of transport and communication infrastructure, payment system, commercial law,..).
However, this virtuous dynamic may not manifest for two reasons: if people involved in domestic trade and in international trade are not the same and if the goods traded internationally are different of those traded in domestic markets. The first reason rests on the opposition between on the one hand, merchants, which are active in the ports, would be more interested by international trade and on the other hand, officials would be more concerned about domestic trade. Their main objective could be to ensure a regular supply of necessities (grains,…) to urban markets to avoid social and political troops. There is a traditional opposition between government and the administration interested in the inland country and some merchants, interested in trade and in technological progress. The ports affected by the treaties are usually considered as “enclaves of modernity” and it is not relevant for the other cities, and even less for the rest of the country; China’s agriculture has not been significantly concerned by the openness of the country (Maddison, 2006). China’s firms were family ones and domestic trade was not based on legal contracts, but was part of the social relationships, which determined the social life: relationships between individuals, bonds of friendship, family commitments… (Fairbank and Goldman, 2010). Then, “the insertion of a treaty port economy in the traditional Chinese empire represented initially what seemed like a small rupture to a giant closed political system” (Brandt et.al., 2014, p.81).Without any modern constitution or commercial law, a small number of Western-style enterprises hardly overthrew one ounce of the dominant traditional mentality. An
example reflects the institutional barriers that existed at that time. When the British firm Jardine Matheson established a steam-powered silk filature in Shanghai during the 1860s, they prepared for “their inability to obtain prompt and efficient delivery and storage of cocoons in the immediate rural hinterland outside treaty port (Brandt et.al., 2014, p.83). The frontier between the modern institutions in the treaty ports and the traditional ones (including informal monopolies and the guild system) was quite strong. Until the mid-20th century, China had an ethnocentric vision of the world because of its ideology, mentalities and educational system (Maddison, 2006). It seems that local markets were vibrant, but trade was cut off between regions (Rawsky, 1972).
The second reason for the lack of virtuous cycle between openness and market integration may be due to the opposition between internationally tradable goods and domestically tradable ones. First, we must notice that China’s trade openness was less important than in some similar countries. In 1870, China’s exports accounted for 5.6 per cent of Asian and Western exports, and 3.9 in 1913. For the same years, India’s trade accounted for 13.9 and 8.8 per cent (Maddison, 2006). Large countries are often less opened than small ones, but it may not explain the difference between these two large countries. China’s foreign trade policy has often been restrictive, allowing limited exchange between domestic and foreign traders in specific areas (Keller et.al., 2011). The tradition of a lack of interest for foreign products from the government is well known. It reflects the nationalism and the wish of self-sufficiency, but also a kind of reality. It is reported than in the 1830s the Chinese native nankeen cotton cloth was superior in quality and cost compared to Manchester cotton goods (Greenberg, cited by Keller et. al., 2011). In 1890, agriculture represented 68.5 per cent of GDP and handicraft 7.7 per cent (Maddison, 2007). Exports are mainly composed of tea and silk. Imports are mainly devoted to opium (37 per cent in 1870), and cotton latter in the 20th century. Then China’s imports became more diversified after 1911. China did virtually import no equipment or modern means of production, which could have been traded domestically. Traditionally, it also imports luxury goods from Europe. These types of
products are dedicated to very few people in the population and may not be a vector for market integration.
In either case, domestic markets in late imperial China would be more isolated than integrated. Even though the unequal treaties forced China to open some ports, introducing a friendly environment for price convergence, China's rigid social system and autarkic economy might still impede domestic market integration. If so, the LOP is unlikely to hold.
2- Data and methodology
As shown by Fackler and Goodwin(2001), market integration occurs when supply or
demand shocks in one region is partially or fully transmitted to another region. Market integration is the subject of major studies insofar as it leads to efficiency gains and ensures the inter-regional smoothing of shocks (e.g. Shiue, 2002). For markets to be fully integrated, the LOP must hold. The LOP is a stronger assumption than market integration. It indicates that price changes in a given location net of transaction costs are perfectly transmitted to prices in other locations through trade. Arbitrage clears the spatial price differences. Although the literature has highlighted the limitations of an approach that relies exclusively on price data (e.g. Barrett & Li, 2002), in the lack of sufficiently reliable data on quantities traded, the usual method for testing market integration is to consider in the long-term price co movements between different locations (Federico, 2012). Specifically, it is assumed that if prices diverge permanently, then arbitrage opportunities are not fully exploited, and markets are not integrated. To examine the market integration in late imperial China, we focus on grain prices that was more marketized than other important staple commodities, such as maize, potato, and sweet potato. In the eighteen century, accounting for roughly 40% of the gross national product, 20% of China’s total grain output was traded between the provinces
of which the Yangtze region was the logistics center (Peng, 2006; Xu & Wu, 2000).
Grain was used by Shuie & Keller (2007), Li (2000), and Gu (2013) among others in
their work on market integration in historic China.
In the cointegration tests, we specifically use data on grain prices in 13 provinces in late imperial China with a maximum period spanning from 1738 to 1911. The data are obtained from Chen and Kung (2016).2 The Qing government originally kept those
grain prices. Local officials reported grain prices to the central government each month. Given that cropping patterns were different across regions in the Qing Dynasty, to ensure comparability, we follow Chen and Kung (2016) and convert one “dan” of grain
(of various kinds) into the standardized kilocalories.3 This conversion based upon
sources compiled by the Institute of Nutrition and Food Safety, Chinese Center for Disease Control and Prevention (2002).4 We then calculated the yearly average price
and adjusted the price according to purchasing power parity, which was 1,900 USD. The deflator was obtained from Peng (2006).
Our utilization of grain prices from a nationally representative sample departs from the seminal work by Shiue & Keller (2007) who select the southern and central regions of China. Our sample is on province-level that deviates from the county-level sample used by Gu (2013). Therefore, our focus is on market integration between provinces and not
within provinces. Indeed, long-distance trade is likely more affected by international trade treaties than short-distance trade.
2 Their data on grain price is based on “Qing Dynasty’s Price of Food Database,” Institute of Modern History, the
Academia Sinica, Taiwan (http://mhdb.mh.sinica.edu.tw/foodprice/about.php), and “Grain Prices Data during
Daoguang to Xuantong of the Qing Dynasty”, Institute of Economics, Chinese Academy of Social Science (2010).
3 The dan is the unit of weight employed at the time. Each dan equals 83.5 kg.
Province Classification
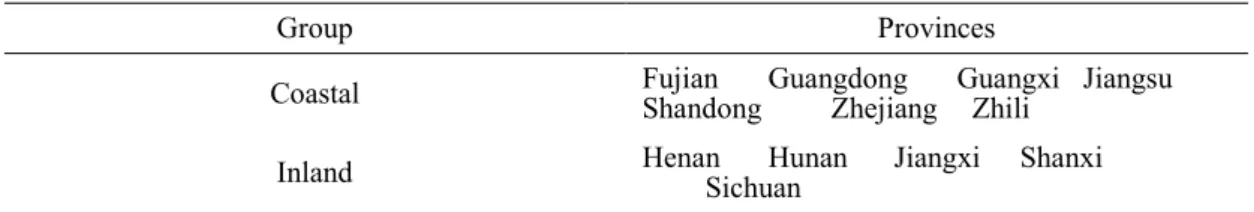
In our sample, the 13 provinces are Fujian, Guangdong, Guangxi, Henan, Hubei, Hunan, Jiangsu, Jiangxi, Shandong, Shanxi, Sichuan, Zhejiang, and Zhili. The sample is constrained by the availability of consistent data for the period.5 We classified the
provinces according to two rules: geographic location and overseas trade policy. The geographic location was probably decisive in connecting domestic markets to international trade in late imperial China. Coastal provinces with ports received price information more conveniently through international trade activities and could be more integrated. By contrast, markets in inland provinces would be less likely to be integrated because grain prices in landlocked markets were determined by regional transactions rather than their international counterparts. Therefore, we classify 12 provinces into coastal and inland groups (see Table 1). Hubei is dropped in this classification because its data is inconsistent with that of other inland provinces in study periods.
Table 1 Province Classification Based on Geographic Locations
Group Provinces
Coastal Fujian Shandong Guangdong Zhejiang Zhili Guangxi Jiangsu Inland Henan Sichuan Hunan Jiangxi Shanxi Source: Authors’ classification.
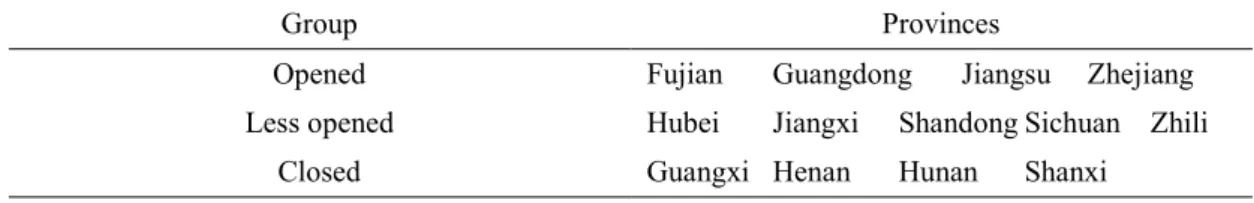
Based on the opening timeline of each provincial trade port, we classify 13 provinces
into three groups, namely opened group, less-opened group, and closed group (see Table 2). One province is classified as opened if ports there were opened by China, as less opened if ports there were forced to open by the unequal treaties. It is noteworthy
5 In Chen and Kung (2016)’s dataset, there are 18 provinces. Among them, 13 provinces are used in our sample.
that the provinces in the closed group had no ports opened by China or according to the unequal treaties in our study period.
Table 2 Province Classification Based on Opening Policies
Group Provinces
Opened Fujian Guangdong Jiangsu Zhejiang Less opened Hubei Jiangxi Shandong Sichuan Zhili
Closed Guangxi Henan Hunan Shanxi Source: Authors’ classification.
Cointegration Test
We consider two local markets of a homogeneous good: grains. When trade happens, the price in the importing market 𝑃𝑡𝑖 is the sum of the price in the exporting market
𝑃𝑡𝑒 and transaction costs 𝑇𝑡𝑒𝑖. The arbitrage condition would thus hold as 𝑃
𝑡𝑖 = 𝑃𝑡𝑒+
𝑇𝑡𝑒𝑖. The market integration relationship to be investigated is given as the following equation under the assumption of stationary transaction costs:
ln𝑃𝑡𝑖 = 𝑎 + 𝑏ln𝑃𝑡𝑒 + 𝜀𝑡 (1.)
If 𝑏 = 1, the LOP holds and the markets are fully integrated. If 0 < 𝑏 < 1, the prices tend to move in the same direction, but the markets are not fully integrated. However, when the price series are non-stationary, the LOP cannot be tested by estimating this regression (Engle & Granger, 1987). In this situation, cointegration tests are the
appropriate tool. The multivariate Johansen test (Johansen & Juselius, 1990) will be
used here since it allows for hypothesis testing on the parameters in the cointegration vector and exogeneity tests. The Johansen test is based on a vector autoregressive error correction model (VECM). If 𝑃𝑡 denotes an (𝑛 × 1) vector of I(1) prices, then the kth-order VECM is given by
where Γ𝑖 = −(𝐼 − Π1−. . . −Π𝑖) ; 𝑖 = 1,2, … , 𝑘 − 1 ; Π = −(𝐼 − Π1−. . . −Π𝑘) ; each of Π𝑖 is an 𝑛 × 𝑛 matrix of parameters; 𝜀𝑡 is an identically and independently distributed n-dimensional vector of residuals with zero mean and variance matrix, Ω𝜀; 𝜇 is a constant term; and 𝑡 is trend. Since 𝑃𝑡−𝑘 is I(1), but ∆𝑃𝑡 and ∆𝑃𝑡−𝑖 variables are I(0), equation (2) will be balanced if Π𝑃𝑡−𝑘 is I(0). So, it is the Π matrix that
conveys information about the long-run relationship among the variables in 𝑃𝑡. The
rank of Π, 𝑟, determines the number of cointegration vectors, as it determines how many linear combinations of 𝑃𝑡 are stationary. According to Stock and Watson (1988), there will be 𝑛 − 𝑟 different stochastic trends between the provincial prices series. Consequently, 𝑟 could be interpreted as a proxy of the strength of market integration. When 𝑟 = 0, each provincial price follows its own trend and the degree of market fragmentation is maximum. When 0 < 𝑟 < 𝑛 − 1, provincial markets are integrated, but the LOP does not hold in the presence of at least two common stochastic trends. When 𝑟 = 𝑛 − 1, there exist a unique common stochastic trend between all prices (and all the pair-wise prices are cointegrated). The empirical question is therefore the extent to which unequal treaties impact 𝑟.
To examine the strength of market integration, 𝑟, we propose two likelihood ratio test statistics. The null hypothesis of at most 𝑟 cointegrating vectors against a general alternative hypothesis of more than 𝑟 cointegrating vectors is tested by
𝑇𝑟𝑎𝑐𝑒 𝑠𝑡𝑎𝑡𝑖𝑠𝑡𝑖𝑐 (𝜆 − trace) = −𝑇 ∑ ln(1 − 𝜆̂𝑖) 𝑛
𝑖=𝑟+1
(3.)
The null of 𝑟 cointegrating vector against the alternative of 𝑟 + 1 is tested by
𝑀𝑎𝑥𝑖𝑚𝑢𝑚 𝑒𝑖𝑔𝑒𝑛 𝑣𝑎𝑙𝑢𝑒 𝑠𝑡𝑎𝑡𝑖𝑠𝑡𝑖𝑐 (𝜆 − max) = −𝑇ln(1 − 𝜆̂𝑟+1) (4.)
and 𝑇 is the number of usable observations.6
Robustness check: sigma price convergence
We check the robustness of the results of the cointegration tests by examining time evolution of price convergences. Following Wolszczak-Derlacz (2008) which derives the concept from the literature of real convergence, we define sigma convergence as the evolution over time of the spatial dispersion of provincial prices. Sigma convergence occurs when the price dispersion declines over time. Specifically, for each year, the standard deviation of the grain price distribution between provinces is calculated and presented in a graph. It must be checked whether unequal treaties lead to a break in the price dispersion trend.
3- Results
The search for a common stochastic trend implies that all the price series are non-stationary and integrated of the same order. For most province groups in our sample, however, the price series are often found to be stationary by the results of unit root tests for each group.7 This limits our application of the cointegration tests to the geographic
location groups and opening policy groups with at least two price series integrated of order one, or I(1).
Geographic Location Groups
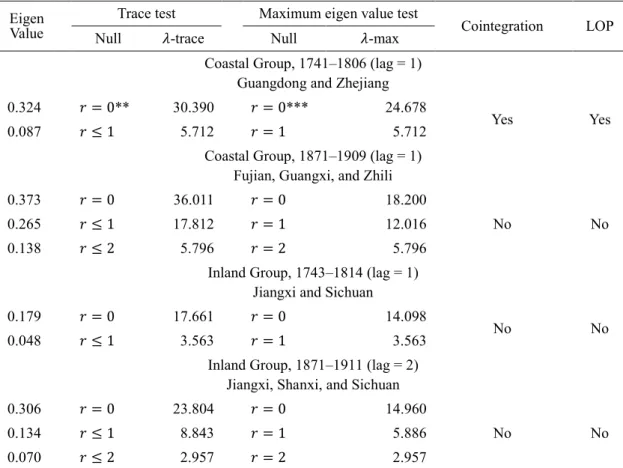
Table 3 presents the cointegrations results of the geographic location groups. Both the trace and 𝜆-max tests show one cointegrating vector for Jiangsu and Shandong in the
6 For details, see Johansen & Juselius (1990).
coastal group, 1741‒1806. This implies that the grain prices in Jiangsu and Shandong contain the same stochastic trend and so are cointegrated. Since, there are only two provinces in this group, the finding of cointegration suggests that the LOP holds for grain markets in Jiangsu and Shandong before the 1860s. The cointegration results for the remaining three groups indicate that the grain markets in the coastal group after 1860s, as well as in the inland group, are unintegrated: there is no common stochastic trend
Table 3 Cointegration Results of the Geographic Location Groups
Eigen Value
Trace test Maximum eigen value test
Cointegration LOP Null 𝜆-trace Null 𝜆-max
Coastal Group, 1741–1806 (lag = 1) Guangdong and Zhejiang
0.324 𝑟 = 0** 30.390 𝑟 = 0*** 24.678
Yes Yes 0.087 𝑟 ≤ 1 5.712 𝑟 = 1 5.712
Coastal Group, 1871‒1909 (lag = 1) Fujian, Guangxi, and Zhili 0.373 𝑟 = 0 36.011 𝑟 = 0 18.200
No No 0.265 𝑟 ≤ 1 17.812 𝑟 = 1 12.016
0.138 𝑟 ≤ 2 5.796 𝑟 = 2 5.796 Inland Group, 1743‒1814 (lag = 1)
Jiangxi and Sichuan
0.179 𝑟 = 0 17.661 𝑟 = 0 14.098
No No 0.048 𝑟 ≤ 1 3.563 𝑟 = 1 3.563
Inland Group, 1871‒1911 (lag = 2) Jiangxi, Shanxi, and Sichuan 0.306 𝑟 = 0 23.804 𝑟 = 0 14.960
No No 0.134 𝑟 ≤ 1 8.843 𝑟 = 1 5.886
0.070 𝑟 ≤ 2 2.957 𝑟 = 2 2.957
Notes: *** Significant at the 1% level. ** Significant at the 5% level. * Significant at the 10% level. The optimal lag specification of the coastal group (1871‒1909) is selected by the Schwarz
information criterion (SIC). For other groups, the optimal lag specification is selected by the AIC. Source: Authors’ calculation.
Opening Policy Groups
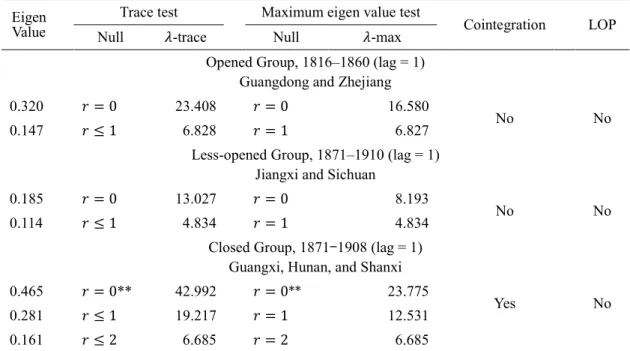
Table 4 presents the cointegration results of the opening policy groups. For Guangxi, Hunan, and Shanxi in the closed group, 1871‒1908, both the trace and 𝜆-max tests
reject the null hypothesis of none cointegrated vectors, revealing at least two vectors common stochastic trends. This suggests that the LOP does not hold because the common stochastic trend is not unique. By contrast, for the opened and less-opened groups where trading port were opened by China or according to the unequal treaties, little evidence is found for the existence of market integration in both the pre- and post- 1860s.
Table 4 Cointegration Results of the Opening Policy Groups
Eigen Value
Trace test Maximum eigen value test
Cointegration LOP Null 𝜆-trace Null 𝜆-max
Opened Group, 1816‒1860 (lag = 1) Guangdong and Zhejiang
0.320 𝑟 = 0 23.408 𝑟 = 0 16.580
No No 0.147 𝑟 ≤ 1 6.828 𝑟 = 1 6.827
Less-opened Group, 1871‒1910 (lag = 1) Jiangxi and Sichuan
0.185 𝑟 = 0 13.027 𝑟 = 0 8.193
No No 0.114 𝑟 ≤ 1 4.834 𝑟 = 1 4.834
Closed Group, 1871‒1908 (lag = 1) Guangxi, Hunan, and Shanxi 0.465 𝑟 = 0** 42.992 𝑟 = 0** 23.775
Yes No 0.281 𝑟 ≤ 1 19.217 𝑟 = 1 12.531
0.161 𝑟 ≤ 2 6.685 𝑟 = 2 6.685
Notes: *** Significant at the 1% level. ** Significant at the 5% level. * Significant at the 10% level. The optimal lag specification of the closed group (1871‒1908) is selected by the Schwarz information criterion (SIC). For other groups, the optimal lag specification is selected by the AIC. Source: Authors’ calculation.
Robustness check: sigma price convergence
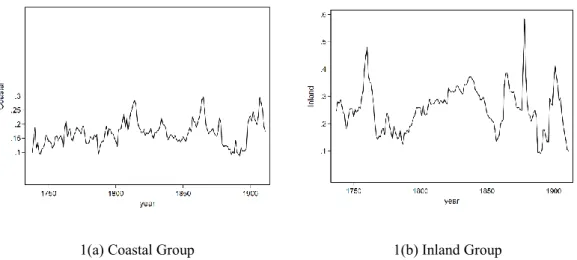
Figure 1 shows the evolution of the grain-price standard deviation between provinces in the coastal and the inland group for each year. Besides, Figure 2 shows the evolution in the opened, less-opened, and closed groups. These two figures reveal that the dispersion in grain prices between Chinese provinces is not characterized by a downward trend. The econometrics analysis shows that there does not exist a market integration in late Imperial China, but a fragmentation of markets, which is the legacy of late Imperial China.
1(a) Coastal Group 1(b) Inland Group
Figure 1 Sigma Convergence of the Grain Prices in the Geographic Location Groups, 1737‒1911
Source: Authors’ calculation.
2(a) Opened Group 2(b) Less Opened 2(c) Closed Group Figure 2 Sigma Convergence of the Grain Prices in the Opening Policy Groups, 1737‒1911
Source: Authors’ calculation.
The fragmentation of the China’s territory seems to be an old story, because of several phenomena: the growing size of the population as previously mentioned, the provincial-based administrative organization, the technology and may be mainly, the poor level of transportation infrastructures. Several studies have been devoted to the link between population and grains. For instance, Chen and Kung (2016) found that like potato in Europe, maize can be at the origin of population growth during 1776–1910 but unlike the potato, it had no significant effect on economic growth because of the lack of new technology. It seems to be the same with grains and the absence of industrial revolution in China. It did not allowed a better efficiency of the markets, which may explain the lack of integration. Transportation is another condition to market integration. Most of
interregional trade relied on natural waterways (Shuie, 2002). Transports were and stayed during years, one of the most serious problems of the Chinese economy (Domenach and Richer, 1987). In 1890, manufacturing industries and modern mode of transport amounted for 0.5 per cent of GDP, and the railways were practically inexistent. China’s exports amounted 0.6 per cent of GDP, which is low compared with other Asian countries (Maddison, 2007). It was probably not sufficient to influence the markets integration. The new trade flows and the new ideas arriving in the opened ports did not concerned the rest of the country, at least at short term, and it seems that the improvements in transport were mainly on the sea between them.
4- Conclusion
Since 1978, China gradually opened its market to the rest of the world and became the major powerhouse of the global economy. China’s economic miracle is greatly due to the improvement of resource allocation efficiency through domestic and international market integration. The initiation of China’s market integration, however, should be revisited in a long-term perspective.
This paper focuses on China’s domestic market integration in the 18th and 19th century. At that moment, the increased market integration in Western Europe finally triggered the Industrial Revolution. By contrast, China's domestic markets seemed more isolated than integrated. It was likely the result of the trade restriction by the Chinese government. The unequal treaties between the Qing government and western powers, however, might affect the trade restriction and invigorate market integration.
We thus evaluate domestic market integration in late imperial China. Specifically, the objective of the paper is to study the consequences of unequal treaties that lift the long-existing international trade restriction system, on domestic grain markets integration.
The degree of market integration is assessed by focusing on both long-term co-movements and sigma convergence in grain prices between provinces. The hypothesis tested is that of complementarity between international and domestic trade integration: better access to international markets would promote better functioning of domestic markets. It appears that the hypothesis according to these treaties would have fostered a greater integration of domestic markets between provinces is significantly rejected. We find no evidence for market integration to hold after the 1870s. Our findings are in line with Cheung’s (2008) argument that the markets in China were only sporadically
integrated in the late imperial era. They are also an illustration of the opposition between the Mandarins, fixed in the past, turned to the continent, not open to progress, and the Compradore, interested in changes and turned to the sea, the both of them being sometimes considered as the “double face of Asia” (Bergère, 1998). The name of Compradore has been given to some Chinese merchants working with foreigners and building a little private industrial sector. The treaties have been a shock, and induced a strong transformation in the ports, but during the Qing dynasty, they probably did not affected most of the China’s economy and of the China’s people, even though they may have initiated a process of change for the long-term. So, they did not play as an integration force for the domestic markets.
Appendix: Unit Root Tests for the Order of Integration
Before proceeding to the cointegration tests, we need to examine the univariate time series properties of the data and to confirm that all the price series are non-stationary and integrated of the same order. To this end, we perform the Augmented Dickey-Fuller (ADF) test for each time series. All the price series are transformed in a natural logarithm. Lag lengths are chosen based on the Akaike Information Criteria (AIC). Our strategy for the unit root tests is as follows. For each province-period-specific series, we report its ADF test result in natural logarithm level. If the unit-root null is rejected for the level of the series, then the series is stationary, or I(0). For the non-stationary series, we then report its ADF test result in logarithm first difference. If the unit-root null is rejected for the first difference of the series but cannot be rejected for the level, then we say that the series contains one unit root and is integrated of order one, I(1). We only perform cointegration tests for the group with at least two I(1) series.
Geographic Location Groups
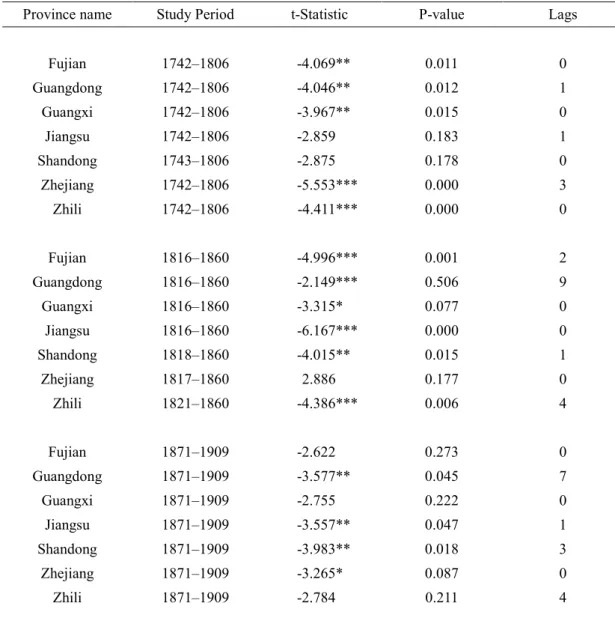
Table 5 presents the results of the ADF tests in natural logarithm level for the coastal group. Jiangsu and Shandong (1742‒1806), as well as Fujian, Guangxi, and Zhili (1871‒1909), show non-stationary grain prices. Other province-period-specific series are found stationary. Table 6 presents the results of the ADF tests in logarithm first differences for the non-stationary series. The null hypothesis of non-stationarity can be rejected for the five prices in first differences.
Table 5 ADF Tests in Natural Logarithm Levels, Coastal Group
Province name Study Period t-Statistic P-value Lags
Fujian 1742‒1806 -4.069** 0.011 0 Guangdong 1742‒1806 -4.046** 0.012 1 Guangxi 1742‒1806 -3.967** 0.015 0 Jiangsu 1742‒1806 -2.859 0.183 1 Shandong 1743‒1806 -2.875 0.178 0 Zhejiang 1742‒1806 -5.553*** 0.000 3 Zhili 1742‒1806 -4.411*** 0.000 0 Fujian 1816‒1860 -4.996*** 0.001 2 Guangdong 1816‒1860 -2.149*** 0.506 9 Guangxi 1816‒1860 -3.315* 0.077 0 Jiangsu 1816‒1860 -6.167*** 0.000 0 Shandong 1818‒1860 -4.015** 0.015 1 Zhejiang 1817‒1860 2.886 0.177 0 Zhili 1821‒1860 -4.386*** 0.006 4 Fujian 1871‒1909 -2.622 0.273 0 Guangdong 1871‒1909 -3.577** 0.045 7 Guangxi 1871‒1909 -2.755 0.222 0 Jiangsu 1871‒1909 -3.557** 0.047 1 Shandong 1871‒1909 -3.983** 0.018 3 Zhejiang 1871‒1909 -3.265* 0.087 0 Zhili 1871‒1909 -2.784 0.211 4
Notes: Trend and intercept are included in the test equation of each province. ***Significant at the 1% level. **Significant at the 5% level. *Significant at the 10% level. The lag length is chosen based on the Akaike Information Criterion (AIC). Source: Authors’ calculation.
Table 6 ADF Tests in Logarithm First Difference, Coastal Group
Province name Study Period t-Statistic P-value Lags
Jiangsu 1742‒1806 -6.593*** 0.000 3 Shandong 1743‒1806 -16.607*** 0.000 1
Fujian 1871‒1909 -6.387*** 0.000 0 Guangxi 1871‒1909 -6.832*** 0.000 1 Zhili 1871‒1909 -3.960*** 0.000 6
Notes: Trend and intercept are included in the test equation of each province. ***Significant at the 1% level. **Significant at the 5% level. *Significant at the 10% level. The lag length is chosen based on the Akaike Information Criterion (AIC). Source: Authors’ calculation.
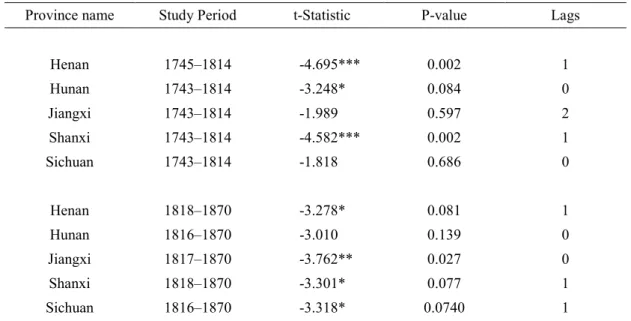
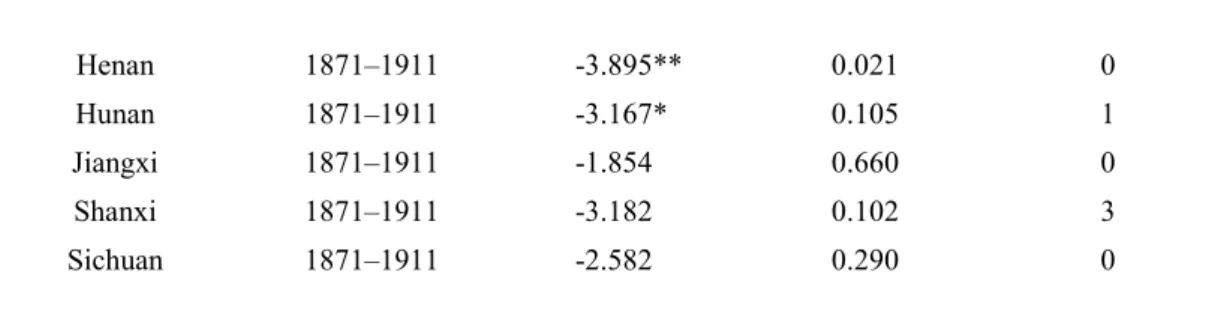
Table 7 presents the results of the ADF tests in natural logarithm levels for the inland group. Although Hunan (1816‒1870) fail to reject the null hypothesis of non-stationary, the rest series of their group are unlikely to have unit root. Jiangxi and Sichuan (1745‒ 1814), in togetherness with Jiangxi, Shanxi, and Sichuan (1871‒1911) cannot reject the null hypothesis of non-stationary. In Table 8, the null hypothesis of non-stationarity can be rejected for the five prices in first differences.
Table 7 ADF Tests in Natural Logarithm Levels, Inland Group
Province name Study Period t-Statistic P-value Lags
Henan 1745‒1814 -4.695*** 0.002 1 Hunan 1743‒1814 -3.248* 0.084 0 Jiangxi 1743‒1814 -1.989 0.597 2 Shanxi 1743‒1814 -4.582*** 0.002 1 Sichuan 1743‒1814 -1.818 0.686 0 Henan 1818‒1870 -3.278* 0.081 1 Hunan 1816‒1870 -3.010 0.139 0 Jiangxi 1817‒1870 -3.762** 0.027 0 Shanxi 1818‒1870 -3.301* 0.077 1 Sichuan 1816‒1870 -3.318* 0.0740 1
Henan 1871‒1911 -3.895** 0.021 0 Hunan 1871‒1911 -3.167* 0.105 1 Jiangxi 1871‒1911 -1.854 0.660 0 Shanxi 1871‒1911 -3.182 0.102 3 Sichuan 1871‒1911 -2.582 0.290 0
Notes: Trend and intercept are included in the test equation of each province. ***Significant at the 1% level. **Significant at the 5% level. *Significant at the 10% level. The lag length is chosen based on the Akaike Information Criterion (AIC). Source: Authors’ calculation.
Table 8 ADF Tests in Logarithm First Difference, Inland Group
Province name Study Period t-Statistic P-value Lags
Jiangxi 1743‒1814 -69.843*** 0.000 1 Sichuan 1743‒1814 -8.608*** 0.000 0
Jiangxi 1871‒1911 -6.498*** 0.000 0 Shanxi 1871‒1911 -4.459*** 0.000 3 Sichuan 1871‒1911 -6.258*** 0.000 0
Notes: Trend and intercept are included in the test equation of each province. ***Significant at the 1% level. **Significant at the 5% level. *Significant at the 10% level. The lag length is chosen based on the Akaike Information Criterion (AIC). Source: Authors’ calculation.
Opening Policy Groups
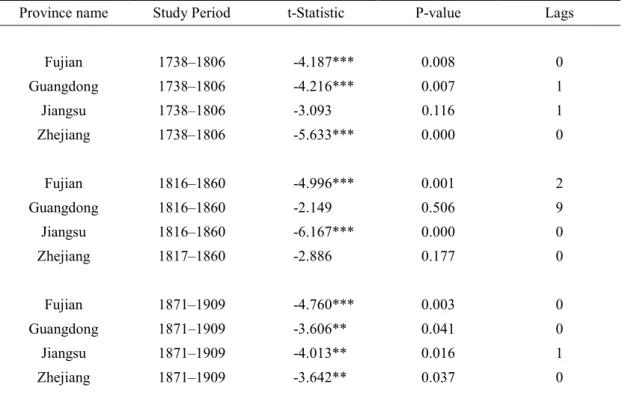
Table 9 presents the results of the ADF tests in natural logarithm levels for the opened group. Only Guangdong and Zhejiang (1816‒1860) in a pair cannot reject the null hypothesis of non-stationary. Table 10 presents the results of the ADF tests in logarithm first difference the non-stationary series. The null hypothesis of non-stationarity can be rejected for the two provinces in first differences.
Table 9 ADF Tests in Natural Logarithm Levels, Opened Group
Province name Study Period t-Statistic P-value Lags
Fujian 1738‒1806 -4.187*** 0.008 0 Guangdong 1738‒1806 -4.216*** 0.007 1 Jiangsu 1738‒1806 -3.093 0.116 1 Zhejiang 1738‒1806 -5.633*** 0.000 0 Fujian 1816‒1860 -4.996*** 0.001 2 Guangdong 1816‒1860 -2.149 0.506 9 Jiangsu 1816‒1860 -6.167*** 0.000 0 Zhejiang 1817‒1860 -2.886 0.177 0 Fujian 1871‒1909 -4.760*** 0.003 0 Guangdong 1871‒1909 -3.606** 0.041 0 Jiangsu 1871‒1909 -4.013** 0.016 1 Zhejiang 1871‒1909 -3.642** 0.037 0
Notes: Trend and intercept are included in the test equation of each province. ***Significant at the 1% level. **Significant at the 5% level. *Significant at the 10% level. The lag length is chosen based on the Akaike Information Criterion (AIC). Source: Authors’ calculation.
Table 10 ADF Tests in Logarithm First Difference, Opened Group
Province name Study Period t-Statistic P-value Lags
Guangdong 1816‒1860 -7.280*** 0.000 0 Zhejiang 1817‒1860 -7.466*** 0.000 0
Notes: Trend and intercept are included in the test equation of each province. ***Significant at the 1% level. **Significant at the 5% level. *Significant at the 10% level. The lag length is chosen based on the Akaike Information Criterion (AIC). Source: Authors’ calculation.
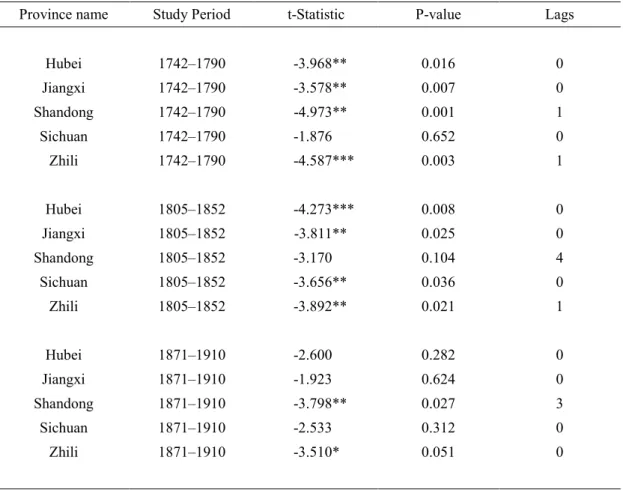
Table 11 presents the results of the ADF tests in natural logarithm levels for the less-opened group. Hubei, Jiangxi, and Sichuan (1871‒1910) in a group cannot reject the null hypothesis of stationary. Table 12 shows that the null hypothesis of non-stationarity in first differences can be rejected for Jiangxi and Sichuan other than Hubei.
Table 11 ADF Tests in Natural Logarithm Levels, Less-opened Group
Province name Study Period t-Statistic P-value Lags
Hubei 1742‒1790 -3.968** 0.016 0 Jiangxi 1742‒1790 -3.578** 0.007 0 Shandong 1742‒1790 -4.973** 0.001 1 Sichuan 1742‒1790 -1.876 0.652 0 Zhili 1742‒1790 -4.587*** 0.003 1 Hubei 1805‒1852 -4.273*** 0.008 0 Jiangxi 1805‒1852 -3.811** 0.025 0 Shandong 1805‒1852 -3.170 0.104 4 Sichuan 1805‒1852 -3.656** 0.036 0 Zhili 1805‒1852 -3.892** 0.021 1 Hubei 1871‒1910 -2.600 0.282 0 Jiangxi 1871‒1910 -1.923 0.624 0 Shandong 1871‒1910 -3.798** 0.027 3 Sichuan 1871‒1910 -2.533 0.312 0 Zhili 1871‒1910 -3.510* 0.051 0
Notes: Trend and intercept are included in the test equation of each province. ***Significant at the 1% level. **Significant at the 5% level. *Significant at the 10% level. The lag length is chosen based on the Akaike Information Criterion (AIC). Source: Authors’ calculation.
Table 12 ADF Tests in Logarithm First Difference, Less-opened Group
Province name Study Period t-Statistic P-value Lags
Hubei 1871‒1910 -2.966 0.156 6 Jiangxi 1871‒1910 -6.139*** 0.000 0 Sichuan 1871‒1910 -6.065*** 0.000 1
Notes: Trend and intercept are included in the test equation of each province. ***Significant at the 1% level. **Significant at the 5% level. *Significant at the 10% level. The lag length is chosen based on the Akaike Information Criterion (AIC). Source: Authors’ calculation.
Table 13 presents the results of the ADF tests in natural logarithm levels for the closed group. Guangxi, Hunan, and Shanxi (1871‒1910) in a group cannot reject the null
hypothesis of non-stationary. Table 14 shows that the null hypothesis of non-stationarity can be rejected for all the three prices in first differences.
Table 13 ADF Tests in Natural Logarithm Levels, Closed Group
Province name Study Period t-Statistic P-value Lags
Guangxi 1743‒1860 -3.914** 0.017 0 Henan 1743‒1860 -4.692** 0.002 1 Hunan 1743‒1860 -3.001 0.140 0 Shanxi 1743‒1860 -4.190*** 0.008 1 Guangxi 1816‒1860 -3.314* 0.077 0 Henan 1816‒1860 -3.201* 0.098 1 Hunan 1816‒1860 -3.436* 0.059 1 Shanxi 1816‒1860 -3.338* 0.074 1 Guangxi 1871‒1908 -1.520 0.804 3 Henan 1871‒1908 -3.851** 0.024 0 Hunan 1871‒1908 -1.566 0.788 7 Shanxi 1871‒1908 -3.176 0.105 3
Notes: Trend and intercept are included in the test equation of each province. ***Significant at the 1% level. **Significant at the 5% level. *Significant at the 10% level. The lag length is chosen based on the Akaike Information Criterion (AIC). Source: Authors’ calculation.
Table 14 ADF Tests in Logarithm First Difference, Closed Group
Province name Study Period t-Statistic P-value Lags
Guangxi 1871‒1908 -6.848*** 0.000 1 Hunan 1871‒1908 -5.225*** 0.000 9 Shanxi 1871‒1908 -4.431*** 0.006 3
Notes: Trend and intercept are included in the test equation of each province. *** Significant at the 1% level. ** Significant at the 5% level. * Significant at the 10% level. The lag length is chosen based on the Akaike Information Criterion (AIC). Source: Authors’ calculation.
Summary
We find that in the 18th and early 19th century, grain prices in China’s provincial markets
are stationary. Then, in most cases, the search for a common stochastic trend is then irrelevant: China’s domestic markets were more isolated than integrated. By contrast, after 1870, grain prices began to show a non-stationary pattern in several coastal provinces and most of the inland provinces. For the provinces with less or even without any opened ports, grain prices were in the transition away from stationarity. This tendency to non-stationarity, however, does not necessarily imply the existence of common stochastic trends.
References:
Anderson J.E. and E. van Wincoop (2004), Trade costs, Journal of Economic Literature, 42 (3), 691-751.
Barett, C.B. and Li, J.R. (2002): Distinguishing between equilibrium and integrationin spatial analysis.
American Journal of Agricultural Economics, 84 (2), 292-307.
Bergère, M.Cl. (1998), Le mandarin et le compradore, Hachette Litterature, Paris.
Bernhofen D., M.Eberhardt, J.Li, and S.Morgan (2015), Assessing Market (Dis)Integration in Early Modern China and Europe, CESifo Working Paper, n°5580, Center for Economic STudies and Ifo Institute (CESifo), Munich.
Bernhofen D., M.Eberhardt, J.Li, and S.Morgan (2017), The Evolution of Markets in China and Western EUrope on the Eve of Industrialisation, Research paper series, 2017/12, University of Nottingham.
Brandt L., D.Ma and T.Rawski (2014), From Divergence to Convergence: Reevaluating the History Behind China's Economic Boom, Journal of Economic Literature, 52(1), 45-123.
Caron F. (1997). Histoire des chemins de fer en France, Tome 1: 1740-1883, Fayard, Paris.
Chen, S., & Kung, J. K. (2016). Of maize and men: the effect of a New World crop on population and economic growth in China. Journal of Economic Growth, 21(1), 71-99. doi: 10.1007/s10887-016-9125-8
Cheung, S. (2008). The Price of Rice: Market Integration in Eighteenth-Century China. Bellingham: Center for East Asian Studies, Western Washington University.
Domenach J.L. and Ph.Richer, 1987, La Chine, Tome 1, 1949-1971, Points Histoire, Seuil, Paris. Engle, R. F., & Granger, C. W. J. (1987). Co-Integration and Error Correction: Representation,
Estimation, and Testing. Econometrica, 55(2), 251-276. doi: 10.2307/1913236
Fackler, P. L., & Goodwin, B. K. (2001). Chapter 17 Spatial price analysis Handbook of Agricultural
Economics (1, pp. 971-1024): Elsevier. (Reprinted).
Fairbank JK. and M.Goldman, 2010, Histoire de la Chine, Des origines à nos jours, Tallandier, Paris. Federico, G. (2012), How much do we know about market integration in Europe? Economic History
Review, 65, 470-497.
Gu, Y. (2013). Essays on Market Integration: The Dynamics and Its Determinants in Late Imperial China,
1736-1911. Degree of Doctor of Philosophy A Thesis submitted to the Hong Kong University of
Science and Technology, Hong Kong University of Science and Technology.
Gu, Y. and J. Kai-Sing Kung, 2019, “Malthus Goes to China: The Effect of Positive Checks on Grain Market Development, 1736‒1910.” Revise and Resubmit, Journal of Economic History.
Institute, O. E., & Chinese, A. O. S. S. (2010). Grain Prices Data during Daoguang to Xuantong of the
Qing Dynasty. Guilin: Guangxi Normal University Press.
Institute, O. N. A. F., & Chinese, C. F. D. C. (2002). China Food Composition. Beijing: Peking University Medical Press.
control, 12(2-3), 231-254
Johansen, S., & Juselius, K. (1990). Maximum likelihood estimation and inference on cointegration— with applications to the demand for money. Oxford Bulletin of Economics and statistics, 52(2), 169-210
Keller, W., Li, B., & Shiue, C. H. (2011). China’s Foreign Trade: Perspectives From the Past 150 Years. The World Economy, 34(6), 853-892. doi: 10.1111/j.1467-9701.2011.01358.x
Li, L. (2000). Integration and Disintegration in North China's Grain Markets, 1738–1911. Journal of
Economic History, 60(3), 665-699
Limao N. and A.J.Venables (2001), Infrastruture, Geographical Disadvantage, transport Costs and Trade,
World Bank Economic Review, 15:3, 451-479.
Maddison A., 2006, La Chine dans l'économie mondiale de 1300 à 2030, Outre-terre, 2, n°15, 89-104. Maddison A., 2007, Chinese Economic Performance in the Long Run, Second Edition, Revised and
updated: 960-2030 AD.
Marshall A. (1920), Principles in Economics, Macmillan Press, London.
Murphey R., 1977, The Outsiders: The Western Experience in India and China. Ann Arbor, University of Michigan Press.
Peng, K. (2006). Grain Price since the Qing Dynasty. Shanghai: Shanghai People Press. Pomeranz K., 2010, Une grande divergence, Albin Michel.
Rawski E., 1972, Agricultural change and the peasant, Cambridge MA, Harvard University Press. Shiue, C.H. (2002), Transports Costs and Geography of Arbitrage in 18th Century China, American
Economic Review, 92 (5), 1406-1419.
Shiue, C. H., & Keller, W. (2007). Markets in China and Europe on the Eve of the Industrial Revolution.
American Economic Review, 97(4), 1189-1216
Stock J, Watson MW. (1988), . Testing for common trends. Journal of the American Statistical
Association 83 (104), 1097–1107.
Tinbergen J. (1965), International Economic Integration, Elsevier Publishing Company.
Van Dyke, P. A. (2005). The Canton Trade: Life and Enterprise on the China Coast, 1700‒1845. Hong Kong: Hong Kong University Press.
Wolszczak-Derlacz, J. Price convergence in the EU—an aggregate and disaggregate approach.
International Economics and Economic Policy 5, 25–47 (2008).
Xu, D., & Wu, C. (2000). Chinese Capitalism, 1522‒1840. London: Palgrave Macmillan UK.
Yang, Z. (1996). Statistics and the Relevant Studies on the Historical Population of China. Beijing: China Reform Publishing House.