Query Recommendations for OLAP Discovery-driven Analysis
Arnaud Giacometti, Patrick Marcel, Elsa Negre, Arnaud Soulet
(1)
Université François Rabelais Tours, France Laboratoire d’Informatique
Antenne Universitaire de Blois UFR Sciences et Techniques 3 place Jean Jaurès
F-41000 Blois, FRANCE
e-mail: arnaud.giacometti@univ-tours.fr phone number: (+33)2.54.55.21.14 fax number: (+33)2.54.55.21.41 (2)
Université François Rabelais Tours, France Laboratoire d’Informatique
Antenne Universitaire de Blois UFR Sciences et Techniques 3 place Jean Jaurès
F-41000 Blois, FRANCE
e-mail: patrick.marcel@univ-tours.fr phone number: (+33)2.54.55.21.55 fax number: (+33)2.54.55.21.41 (3)
Université François Rabelais Tours, France Laboratoire d’Informatique
Antenne Universitaire de Blois UFR Sciences et Techniques 3 place Jean Jaurès
F-41000 Blois, FRANCE e-mail: elsa.negre@univ-tours.fr phone number: (+33)2.54.55.21.48 fax number: (+33)2.54.55.21.41 (4)
Université François Rabelais Tours, France Laboratoire d’Informatique
Antenne Universitaire de Blois UFR Sciences et Techniques 3 place Jean Jaurès
F-41000 Blois, FRANCE
e-mail: arnaud.soulet@univ-tours.fr phone number: (+33)2.54.55.21.67 fax number: (+33)2.54.55.21.41
Query Recommendations for OLAP Discovery-driven Analysis
ABSTRACT
Recommending database queries is an emerging and promising field of investigation. This is of particular interest in the domain of OLAP systems where the user is left with the tedious process of navigating large datacubes.
In this paper we present a framework for a recommender system for OLAP users that leverages former users’ investigations to enhance discovery-driven analysis. The main idea is to recommend to the user the discoveries detected in those former sessions that investigated the same unexpected data as the current session. This is done by (1) analysing the query log to discover pairs of cells at various levels of detail for which the measure values differ significantly, and (2) analysing a current query to detect if a particular pair of cells for which the measure values differ significantly can be related to what is discovered in the log.
This framework is implemented into a system that uses the open source Mondrian server to recommends MDX queries. Preliminary
experiments were conducted to assess the quality of the
recommendations in term of precision and recall, as well as the efficiency of their on-line computation.
KEYWORDS
OLAP, discovery-driven analysis, query recommendation, collaborative filtering, MDX queries
INTRODUCTION
One of the goals of recommender systems is to help users navigating large amounts of data. Existing recommender systems are usually categorized into content-based methods and collaborative filtering methods (Adomavicius et al., 2005). Content-based methods recommend to the user items similar to the ones that interested him in the past, whereas collaborative filtering methods recommend to the user items that interested similar users.
Applying recommendation technology to database, especially for recommending queries, is an emerging and promising topic (Khoussainova et al., 2009; Chatzopoulou et al., 2009, Stefanidis et al., 2009). It is of particular relevance to the domain of multidimensional databases, where OLAP analysis is inherently tedious since the user has to navigate large datacubes to find valuable information, often having no idea on what her forthcoming queries should be. This is often the case in discovery-driven analysis (Sarawagi et al., 1998) where the user investigates a particular surprising drop or increase in the data.
In our earlier works (Giacometti et al., 2008; Giacometti et al., 2009a) we proposed to adapt techniques stemming from collaborative filtering to recommend OLAP queries to the user. The basic idea is to compute a similarity between the current user’s sequence of queries (a session) and the former sequences of queries logged by the server. In these works, similarity between sessions is only based on the query text, irrespective of the query results. In this present article, to take into consideration what the users were looking for, we leverage query results to compute recommendations. Our approach is inspired by what is done in web search and e-commerce applications (e.g., Parikh et al. (2008)) where inferred properties of former sessions are used to support the current session.
The present work improves on (Giacometti et al., 2009b), where we proposed a framework tailored for recommending queries in the context of discovery driven analysis of
the user was investigating. As it is the case in discovery-driven analysis, this has the form of a pair of cells showing a significant unexpected difference in the data. We proposed a framework for detecting in the log of an OLAP server such pairs, arranging them into a specialisation relation, and recording per session the queries at various levels of detail that contain the pairs detected. During subsequent analyses, if a difference is found that was investigated in a former session, then the discoveries of this former session are suggested to the current user.
The goal of the present paper is to demonstrate the validity of this approach for recommending query in the particular context of discovery-driven analysis of OLAP cubes. To this end, we extend the work of (Giacometti et al., 2009b) in the following ways: First the framework has been slightly changed to better take into account sessions investigating the same difference pair. This means that discoveries are no more recorded only for a particular session but can span across sessions. Second, the framework has been implemented and we undertook a few experiments to assess the effectiveness and the efficiency of our approach. Finally, we propose a dedicated architecture for implementing the approach beyond a prototypical setting.
This paper is organized as follows. Next section motivates our approach with a simple yet realistic example. The third section reviews related work. Preliminary definitions on OLAP data model and query model are recalled in the fourth section. The framework of our recommender system is formally presented in the fifth section, and the algorithms are presented in the sixth section. In these sections, the example given in the second section is used as a running example to illustrate the framework. The seventh section introduces our prototypical implementation of the framework, and the eighth section presents some preliminary experiments. Finally, before concluding, we briefly discuss the feasibility of our approach in a real context and propose an architecture thereof.
MOTIVATING EXAMPLE
In this section we illustrate our approach with an artificial yet realistic motivating example that will be used as a running example throughout this paper. This example uses typical discovery-driven analysis sessions of a simple datacube containing sale results of various products in various locations at different times. These sessions are sequences of queries, the result of which are depicted in Figure 1. On the left are three sessions from the log of the OLAP server and on the right is a current session. This current session consists of only one query (q) that asks for the aggregated sales of cheese in 2007 and 2008 in Europe and USA. The current user may wonder where to navigate the cube further. We will now show how the information in the log can be exploited to provide her with some suggestions.
Figure 1: Example of a log and a current session.
Let us first describe the sessions contained in the log of the OLAP server. In what follows, query q denotes the iij
th
query of the jth session. Session 1 first asked for the sales for various dairy products (cheese, milk, and butter) in France for each semester of 2007 and
2008 (queryq11), and then for the sales of cheese and milk in France for each quarter of 2008
and each semester of 2007 (q12).
The second session first asked for the sales of cheese in 2006-2007 (q12) and then the
sales of cheese in 2007-2008 (q22). Next it asked for the sales of cheese for 2007-2008 in
France, Italy and Spain (q ). Then for the sales of cheese for 2007-2008 in two french 32
regions, namely Normandie (q42), and finally the Loire Valley ( 2 5
q ).
The third session asked for the sales of goat cheese for 2005-2008 (q13). Then the user
rolled up and asked for the sales of cheese for 2005-2008 (q23). Finally, she rolled up again to
obtain the sales of all dairy products for 2005-2008 (q ). 33
By observing these sessions one can notice that each of them is concerned with a general difference that is a drop of the sales of cheese from 2007 to 2008. It appears for instance for query q23 of session 3 and for query
2 2
q of session 2. In the log, there is no difference that can be said to be more general than this one (note for instance that the sales of dairy products are stable from 2007 compared to 2008). Hence this particular difference, the drop of sales for cheese from 2007 to 2008, is said to be the most general difference pair (mgdp for short). The queries whose result displays this difference are called most general
difference queries (mgdq for short). This difference also appears for queries q of the current session, q11, 2 3 q , q and 52 3 1
q , at lower levels of detail. These queries can be said to confirm this difference and are called drill-down differences in what follows. On the other hand, query q42
shows that the sales of cheese in a particular region increased from 2007 to 2008. This query is said to be an exception to the general difference in what follows.
Suppose now that the log is processed to find the most general difference queries it contains, as well as their drill-down differences and exceptions. Note that this processing uses
the cube schema, more precisely the dimension tables, to detect roll-ups and drill-downs. A recommender system for OLAP analysts should detect that the current user’s query is a drill-down difference of one of the mgdq of the log (namely the drop of the sales of cheese). It would then suggest to the user to navigate the cube to see the mgdq, its drill-down differences and exceptions. In our framework, such a suggestion has the form of a graph whose vertices are queries. This graph allows the user to navigate the relevant queries of the log, starting from the current query. Figure 2 illustrates this principle, by depicting two paths in such a graph, computed from what is detected in the log presented in Figure 1. Each arrow can be interpreted as “if you have evaluated this query then you might be interested by that next query”. For instance, it is recommended to the user to evaluate query q23, whose result
displays the mgdp, then the drill-down queries that detail the location hierarchy (France first with query q , then Loire Valley with query 32
2 5
q ) and finally query 2 4
q whose result displays an exception to the general difference in a particular French region. Note that the graph’s vertices are the recommended query texts that the user simply has to evaluate if she is interested in the recommendation. For instance, for query q22, the MDX text would be
SELECT {[2007], [2008]} ON ROWS, {[Country.All]} ON COLUMNS FROM [SalesCube] WHERE ([cheese]).
Our framework can be used as a basis for such a recommender system. It is composed of two parts: The processing of the log, and the computation of recommendations. It is detailed after the sections Related work and OLAP data model and query model.
Figure 2: Example of a log and a current session, with some computed recommendations.
RELATED WORK
Anticipating database queries
In a recent paper, Khoussainova et al. (2009) point out the need for systems leveraging former sessions to support database users analyzing large amount of data. The only works we know that proposes to recommend queries for supporting database exploration is those of Chatzopoulou et al. (2009) and Stefanidis et al. (2009). Although these works share some common features with ours, they differ on two important aspects: First they do not assume a particular database schema and hence the roll-up/drill-down relationship is not exploited, and second, the fact that a session is a sequence of queries is not taken into account.
In the context of multidimensional databases, our previous works (Giacometti et al., 2008; Giacometti et al., 2009a) propose a framework and a system for recommending OLAP queries to a current user by taking advantage of former analytical sessions. This framework is based on the proposal of methods for evaluating the distance between multidimensional queries on the one hand, and the distance between sessions on the other hand. Following a
classical collaborative filtering approach, the current session is compared to the sessions found in the log and the sessions close to the current session are used for computing recommendations.
In the present paper our goal is to complement this approach by taking users’ discoveries into consideration. The idea is no more to recommend queries of sessions that are close to the current session. Instead, our framework recommends queries based on sessions that investigated the same general difference as the one investigated by the current user.
In the same context, the recent work of Jerbi et al. (2009) recommends OLAP queries to the current user by transforming the current query with user preferences. They suppose that a user profile exists from which the preferences that are the most relevant to the current query are used to transform it into a recommended query. This work is more of a content-based method as it does not take former sessions into account. Note that this is closed to that of personalizing OLAP queries with a user profile (Bellatreche et al., 2005), the main difference being that a personalized query is included in the current query, whereas it is not necessary for the recommended query computed by the method of Jerbi et al. (2009).
Finally, note that the work of Sapia (1999; 2000) shares with our work the goal of predicting the forthcoming OLAP query. However the main concern of this work is to prefetch data, not to guide the user towards interesting parts of the cube.
Discovery-driven analysis of datacubes
To support interactive analysis of multidimensional data, Sarawagi et al. (1998) introduced discovery-driven analysis of OLAP cubes. This and subsequent work resulted in the definition of advanced OLAP operators to guide the user towards unexpected data in the cube or to propose to explain an unexpected result. We now present two of these operators
that can be thought of as implementations of some of the operators of our framework, and that are indeed used for implementing it (see Section Implementing the framework).
The DIFF operator proposed in (Sarawagi, 1999) explores the reasons why an aggregate is lower (or higher) in one cell compared to another. It takes as parameter two cells c and c’, and looks into the two isomorphic subcubes C and C’ that detail the two cells (i.e., the subcubes that are aggregated to form the observed c and c’). As a result, it summarizes the differences in these two subcubes by providing the pairs of cells (one in C and one in C’) that contribute the most to the difference between c and c’.
For instance, on the example given in the second section, a DIFF computed on the two cells in the result of query q22 would include in its answer the two cells in the result of query
2 5
q and the first two cells in the result of query 2 3
q (since in both cases the difference is important), but it will not include the two cells of query q42 (since in this case the difference is not important).
In (Sathe et al., 2001) a RELAX operator has been proposed that can be thought of as the opposite to the DIFF operator. Indeed RELAX tries to confirm at a lesser level of details a particular significant difference, and summarizes the exceptions to this confirmation. In its basic form, the RELAX operator takes as parameter two cells c and c’, and rolls up to less detailed levels to check if the difference between c and c’ also occurs at these levels. For each of these roll-ups, the most relevant exceptions (i.e., pairs of cells for which the difference does not hold) to this difference are computed.
For instance, on the example given in the second section, a RELAX computed on the two cells in the result of query q would include in its answer both the two cells in the result 52
details) and the two cells in the result of query q42 (that are exception to this general
difference since the sign of the difference in this case is the opposite).
For both DIFF and RELAX, various optimizations were proposed to guarantee that these operators can be launched on-line. Both operators perform a single pass over the data. DIFF relies on dynamic programming and RELAX uses an Apriori-like trick. Their efficiency justifies the fact that they are used in our implementation of our framework.
We next discuss briefly how these operators relate to our approach.
Discussion.
First, note that both DIFF and RELAX are slightly different from the other classical OLAP operators (roll-up, slice, etc.), in the sense that they do not produce a cube nor a cross-tab as a result, but a list of cells in the navigated cube. This list can be large. The main difference with our present work is that these operators are applied only on query results and they do not take into consideration what other users have discovered. Taking the queries of the log into account can be viewed as a way of filtering the result of these operators, and to propose to the current users only those query results that the former users did find relevant. Indeed, consider the example given in the previous section. Suppose the current user applies the RELAX operator on the result of her/his current query to search for differences that generalize the difference of sales of cheese in USA for 2007-2008. The answer can contain general differences for the sales result at higher levels of dimension products (dairy, food, consumable, etc.), combined with higher levels of dimension location (North-America, America, Outside Europe, etc.), combined with higher levels of dimension time (21st century, etc.). Obviously this answer can be very large. However, in the log there are only three sessions that focused on the drop of the sales of cheese, and thus our framework will propose to the current user to search in this direction first.
Finally, note that discovery-driven analysis is still attracting attention. Indeed, two recent works use a data mining approach to inform the user of potentially interesting regions of a cube by either automatically detecting interesting cells (Cariou et al., 2007) or proposing interesting drill paths (Cariou et al., 2008). In the former case, the goal is simply to highlight in a given query result the cells whose measure deviates the most from a theoretical value computed under independence model hypothesis. In the latter case however, the goal can be seen as recommending drill-down queries to the user. This approach does not take into account former explorations and thus it is very close to the DIFF operator described above.
Session properties used in Information Retrieval
The idea of using former sessions to improve current search is very popular in Information Retrieval (Adomavicius et al., 2005) and Web Usage Mining (Spiliopoulou et al., 2000).
In recent works, properties of the session are inferred to support subsequent searches. For instance, in (Downey et al., 2008), the information goal of a session is defined as the last URL visited during the session or alternatively the last click on a search engine result page.
In (Parikh et al., 2008) in the domain of e-commerce, the session goal is a particular event occurring in the session. In this case of the EBay site, the goal of a session is a buy event. This allows enriching all the sessions (and especially the queries of the sessions) with the description of the item bought, which is called the context of the session. The authors show how defining the context of a session helps recovering from null result in subsequent searches, provides a better understanding of the queries in the session, or helps generating recommendations.
These works have influenced our approach. Indeed, the mgdq detected in an OLAP session can be viewed as the session context and the drill-down differences and exceptions, if any, can be viewed as the session goals.
OLAP DATA MODEL AND QUERY MODEL
In this section, we define formally the data model and the query model that we use throughout the paper for presenting our framework. The model is a classical star schema queried with MDX queries. We now give the formal definitions. Basic knowledge is assumed on the relational model and query language (relation instance and schema, primary and foreign key, etc.) (see e.g., Abiteboul et al., 1995).
Dimension, level, roll-up/drill-down, member
A dimension D is a relation name with schema {L0, ..., Ld} such that L0 is the primary
key of D.
Given a dimension D with schema S = {L0, ..., Ld}, Roll-up and Drill-down are two
partial mappings from S to S, defined by: Given an attribute Lj in S, Roll-up(Lj)=Lk if there
exists a functional dependency Lj → Lk or undefined otherwise, and Drill-down(Lj)=Ll if
there exists a functional dependency Ll → Lj or undefined otherwise. The attributes of the
schema of a dimension are called aggregation levels (or levels for short).
A dimension table for D is an instance of D. For a dimension table D with schema S = {L0, ..., Ld}, a member is an element of Uj adom(Lj)for j in [0,d] (adom(Lj)denotes the active domain of Lj). Given two levels Lj, Lk of a dimension D such that Lk=Roll-up(Lj), we
use mj < mk to denote that (mj,mk)∈
π
{Lj,Lk}(D). < is transitive and defines a hierarchy for D.An n-dimensional fact table F is a relation instance with schema
{
L01,K,L0n,m}
where{
0 0}
1, ,Ln
L K is the primary key of F, L is the primary key of some dimension table D0i i.
Elements of dom(m) are called measures. Given a Fact table F, a fact is a tuple of F.
Note that we consider that, without loss of generality, a fact is associated with only one measure value.
Cube and Cells, cell references
An n-dimensional cube C = D1, . . . , Dn, F is defined as the classical n + 1 relation
instances of a star schema, i.e., D1, ..., Dn are dimension tables and F is a fact table. Given an
n-dimensional cube C = D1, …, Dn, F , a cell reference (or reference for short) over schema
{L1, ..., Ln} is an n-tuple m1, . . . , mn where mi
∈
dom(Li) is a member of dimension Difor all i
∈
[1, n]. A cell c is a tuple c= m1, ..., mn, mes where m1, ..., mn is a referenceover {L1, ..., Ln} and mes is a value of dom(m). Given a cube C, a cell whose reference is
m1, ..., mN , is the result of the relational query:
{
〈m1,K,mN〉}
><π
m(σ
(L1 =m1)andKand(LN = mN)(π
L1,K,LN;m((F ><D1K><DN))).mes is called the measure of the cell. In what follows we will use measure(c) to denote the
measure of the cell c.
Specialisation relation over reference and cells
Given a cube C and two cells r and r’, we consider the classical relation over cell references defined by: r <cells r’ if for all dimensions Di with hierarchy <i, either r(i) = r’(i) or
r(i) <i r’(i). This relation is extended to cells as follows: For two cells c, c’ of an
of c’. Note that this relation corresponds to the one used in the cube lattice (see e.g., Lakshmanan et al. 2003).
Example 1. Consider the motivating example. The cell cheese, 2007, Europe, 100 has reference cheese, 2007, Europe and is part of the result of query q. The cell Cheese, 2007, All, 200 has reference cheese, 2007, All and is part of the result of query q22. We
have cheese, 2007, Europe, 100 <i cheese, 2007, All, 200 .
Multidimensional query and query result
In this article, the multidimensional queries considered, i.e., logged or recommended, are the ones expressed with MDX, the de facto standard. As in our previous work (Giacometti et al., 2008; Giacometti et al., 2009), we define multidimensional queries as sets of references in the following way: Given an n-dimensional cube C = D1, . . . , Dn, F , let Ri be a set of
members of dimension Di for all i ∈ [1, n], a query over C is the set of references R1 × . . . ×
Rn. This definition complies with the MDX standard. Indeed, given an MDX query: SELECT
s1 ON ROWS, s2 ON COLUMNS, ... FROM f WHERE w, each of s1, s2,… and w respectively
defines a relational query over dimension tables, the Cartesian product of which corresponds to our definition of query. Given a cube C, the result of a query q on C is the set of cells whose references are in q.
In what follows, we note r ∈ q to denote that r is a reference of a query q and c ∈ q to denote that c is a cell of the result of a query q. r(i) denotes the ith member of a reference r. When the context is clear, a query q will be confounded with its result, and we note cells(q) the set of cells of a query q.
Example 2. Consider the motivating example. The current query q is the set of references {cheese} × {2007, 2008} × {Europe, USA}. Its result is the set of cells { cheese, 2007, Europe, 100 , cheese, 2008, Europe, 10 , cheese, 2007, USA, 50 , cheese, 2008, USA, 5 }. This query can be expressed in MDX over a cube called SalesCube as:
SELECT {[Europe], [USA]} ON ROWS, {[2007], [2008]} ON COLUMNS FROM [SalesCube]
WHERE ([cheese])
Session, log
A session is a sequence of queries, and a log is a set of sessions. We denote the set of queries of a session s by queries(s) and the set of queries of a log L by queries(L). For instance, the log illustrated Figure 1 is the set { q11, q12 , q12, q22,
2 3 q , q42, q52 , 1 3 q , 2 3 q , q33 }.
THE RECOMMENDER SYSTEM FRAMEWORK
Overview of the approach
Recommendations are computed on the basis of the differences discovered in the log. The key idea is to detect the difference that the current query is investigating and to recommend the queries in the log that investigated the same difference.
More precisely, the log is preprocessed offline in the following way: (1) The log is examined to discover the pairs of cells whose measure differ significantly, to retain the most general ones (the most general difference pairs, mgdp) as well as the queries that contains
them (the most general difference queries, mgdq). (2) For such pairs, a structure called
investigation is created that records the set of mgdq and, at a lower level of detail, the queries
that confirm the difference (their drill-down differences), and the queries that contradicts the difference (their exceptions).
Recommendations are computed online each time a current query is added to the current session by the current user. The current query is analyzed to detect to which investigations it corresponds (this query may be itself a mgdq, a drill-down difference, or an exception of what is detected in the log). Then a navigation plan (a set of queries arranged in a graph) is proposed for the current user to see drill-down differences or exceptions to the mgdq, by using the queries of the investigations.
In what follows, we detail the framework, starting with explaining how the log is processed and then how recommendations are computed.
Difference pairs
We now define the pairs of cells that will be considered during the processing of the log. First note that the specialization relation over cells can be extended to pairs of cells in the following way.
Definition 1 (specialization over pairs). Let C be a cube and c, c’, c’’, c’’’ be four cells in C. The pair c, c' is a generalization of c'' c, ' '' , noted c, c' <cells c' c', ''' if both
c <cells c’’ and c’ <cells c’’’.
Example 3. Let c = cheese, 2007, all, 200 , c’ = cheese, 2008, all, 20 , c’’ = cheese, 2007, France, 50 , and c’’’ = cheese, 2008, France, 6 be four cells in the cube analyzed, that appear in the results of query q2 and q . We have 2 c, c' <cells c'' c, ' '' .
If we have c, c' <cells c'' c, ' '' , we will say that c, c' is a roll-up pair of c'' c, ' ''
and c'' c, ' '' is a drill-down pair of c, c' . Moreover, if c'' c, ' '' is a drill-down pair of c, c' and sign(measure(c’’) − measure(c’’’)) ≠ sign(measure(c) − measure(c’)) we will say that
'' ' , '' c
c is an exception pair of c, c' . Given a set S of pairs of cells, the most general pairs
are the pairs of S that have no roll-up pairs in S.
Definition 2 (most general pairs). Let S be a set of pairs of cells. The most general pairs of S is denoted by the set max <cells (S). For a given pair of cells c, c' of S, the set of the most
general pairs for c, c' in S is the set:
max <cells (
{
c'',c' '' ∈S c'',c' '' isaroll−up pairof c,c'}
).In what follows we will call a significant difference pair (or difference pair for short) a pair of cells such that their measures differ significantly. This significance is computed in two steps. First, a user-defined function fdp on which we do not impose particular requirements is used to detect base difference pair (examples of such functions are given in the section “implementing the framework”).
Definition 3 (base difference pair). Let C be a cube, fdp be a Boolean function over the pairs of cells in C and c’, c be two cells in C. The pair c, c' is a difference pair for C with regards to fdp if fdp(c,c’)=true.
Example 4. If the function fdp outputs true if the measures differ at least by a factor of 10, then the pair of cells c, c' of Example 3 is a base difference pair.
The operator difference outputs the pairs of cells in a query q that are base difference pairs, i.e., difference(fdp, q) = { c, c' ∈ q | fdp(c, c’) is true} for some Boolean function fdp over pairs of cells. For a given base difference pair c, c' , we define its roll-up (resp. drill-down) difference pairs as its roll-up (resp. drill-drill-down) pairs that show a significant difference w.r.t. c, c' . This significance is computed with another user-defined Boolean function, example of which is given in the section “implementing the framework”.
Definition 4 (roll-up/drill-down difference pairs). Let c, c' be a difference pair, c'' c, ' '' be one of its roll-up (resp. drill-down) pairs and r be Boolean function over couples of pairs of cells. We say that c'' c, ' '' is a roll-up difference pair (resp. q’ is a drill-down difference pair) for c, c' if r(c,c’,c’’,c’’’)=true.
The next operators detect, for a pair c, c' , a set of queries Q and a Boolean function
r, which are the pairs of Q that are roll-up (resp. drill-down, resp. exception) difference pairs for c, c' . Formally, rollupDifferencePairs(c, c’, Q, r) = { c '' c, ' '' | ∃ q ∈ Q with c'' c, ' '' ∈ q and c'' c, ' '' <cells c, c' ∧r(c,c’,c’’,c’’’)=true}, drilldownDifferencePairs(c, c’, Q, r) = {
'' ' , '' c
c | ∃ q ∈ Q with c'' c, ' '' ∈ q and c'' c, ' '' >cells c, c' ∧ r(c,c’,c’’,c’’’)=true},
exceptionPairs(c, c’, Q) = { c '' c, ' '' | ∃ q ∈ Q with c '' c, ' '' ∈ q and c'' c, ' '' is an exception pair for c, c' }.
In what follows, base difference pairs, roll-up difference pairs and drill-down difference pairs will be called simply difference pairs. A most general difference pair (mgdp) of a set S of
Example 5. Recall Examples 3 and 4. In Figure 1 every cell that is part of a difference pair has its measure in bold face. Base difference pairs are detected with the Boolean function used in example 4, and their roll-up and drill-down difference pairs are detected with a function outputting true if, for two difference pairs of cells c, c' and c'' c, ' '' ,
β
> − − ) ' ( ) ( ) '' ' ( ) '' ( c measure c measure c measure c measurefor some threshold β >0.
If c, c' and c'' c, ' '' are the pairs given in Examples 3 and 4, then c, c' is a roll-up difference pair of c'' c, ' '' . If S is the set of all pairs of cells in the queries in session 2, then
' , c
c is the most general difference pair of c'' c, ' '' in S.
Difference queries
We define a difference query to be a query whose result displays one or more difference pairs. A query is a roll-up (resp. drill-down) difference query of a difference query if its result confirms the difference at a higher (resp. lower) level of detail. An exception is a query that contradicts a difference at a lower level of detail. The following definitions formalize these notions.
Definition 5 (difference query). Let C be a cube, fdp be a Boolean function over the pairs of cells in C. A query q over C is a difference query if there exist two cells c, c’ ∈ q such that the pair c, c' is a difference pair for C and fdp.
Definition 6 (roll-up/drill-down/exception difference query). Let q and q’ be two queries, and let c, c' be a difference pair in q. We say that q' is a roll-up (resp. drill-down, resp. exception) difference query for q if there exists a difference pair c'' c, ' '' in q' that is a roll-up (resp. drill-down, resp. exception) difference pair c, c' . q' is said to be a roll-up (resp. drill-down, resp. exception) difference query for q w.r.t. the pair c, c' .
The next operators detect, for a pair c, c' and a set of queries Q, which are the queries of Q that are roll-up (resp. drill-down, resp. exception) difference queries w.r.t. c, c' . Formally, rollupDifference(c, c’, Q) = {q ∈ Q | q is a roll-up difference query w.r.t. c, c' }, drilldownDifference(c, c’, Q) = {q ∈ Q | q is a drill-down difference query w.r.t. c, c' }, and exception(c, c’, Q) = {q ∈ Q | q is an exception difference query w.r.t. c, c' }.
Example 6. Continuing Example 4, q22 is a difference query, as is the current query q. Thus 2
2
q is a roll-up difference query for q, and a roll-up difference query for the difference pair cheese, 2007,Europe, 100 , cheese, 2008,Europe, 10 .
A most general difference query (mgdq) is a query that contains a most general difference pair.
Definition 7 (mgdq). Let q be a query, S be a set of pairs of cells and c, c' be a pair in S. q is a mgdq if it contains a pair of S that is a most general difference pair of S.
Example 7. Consider the set of queries of session 2 Q = {q12, . . . , 2 5
q }, and the difference
pair cheese, 2007, Europe, 100 , cheese, 2008, Europe, 10 . q22 is the mgdq of Q.
Query q42 is an exception difference query of 2 2
q .
ALGORITHMS FOR THE RECOMMENDER SYSTEM
This section introduces the algorithms underlying our approach.
Processing the log
We begin with the algorithm used to discover the various kinds of difference pairs from a log file and relate them together.
First, Algorithm 1 processes the log to discover the mgdq, their drill-down differences and exceptions. This algorithm outputs a set of what we call investigations, i.e., the various queries that investigated a particular difference pair. Note that one investigation is created per mgdp discovered in the log, provided this mgdp comes with some drill-down difference pairs or exception pairs.
Definition 8 (investigation). An investigation i for a log L is a tuple c, c’, M, D, E where
' , c
c is a most general difference pair appearing in L, M, D and E are subsets of queries(L),
M is the set of queries that contains c, c' , D is the set of drill-down difference queries w.r.t.
' , c
c , E is the set of exception difference queries w.r.t. c, c' , and at-least one of D, E is
non-empty.
Algorithm 1: discovering investigations
Input: A log L, a Boolean function fdp, a Boolean function r Output: A set I of investigations
I, DP, RDP, MP ← Ø // detect base difference pairs
foreach query q ∈ queries(L) do DP = DP U difference(fdp,q)
// detect all their roll-up difference pairs foreach pair p ∈ DP do
RDP = RDP U rollupDifferencePairs(p,queries(L),r)
// retain only the most general MDP = max <cells(RDP)
// detect drill-down difference queries and exception queries foreach m ∈ MDP do
M = {q ∈ queries(L) | m ∈ q }
D = drilldownDifference(m,queries(L)) E = exception(m,queries(L))
// update the set of investigations if D ≠ Ø or E ≠ Ø then I = I U <m,M,D,E>
To express the time complexity of this algorithm, we consider the number nc of cells
in the log file. Then Cn2cis the number of pairs in the log and 2 2 ) ( c n
C is the number of couples
of pairs in the log. To simplify, we use n=Cn2c=
2 ) 1 ( − × c c n n
. The time complexity is: n (for
detecting base difference pairs) + n² (for detecting the roll-up difference pairs) + n² (for computing the mgdp) + 2n² (for detecting drill-down difference queries and exception queries), and thus in O(n²).
Note that for a given investigation i, a query can be at the same time mgdq or down difference or exception. Thus the queries in i are labeled with their type (mgdq, drill-down difference or exception) and are associated with their pair of cells that is the drill-drill-down or exception pair w.r.t. the mgdp. In an investigation i =<m, M, D, E>, m is called the difference pair of the investigation. For a set of investigations I, mgdq(I) is the set of mgdq of
Example 8. Consider the log of Figure 1. Suppose the pair of cells t1 = cheese, 2007sem1,
France, 25 , cheese, 2008sem1, France, 1 is detected as a base difference pair for query
1 1
q . The pair t2 = cheese, 2007, all, 200 , cheese, 2008, all, 20 is detected as a roll-up
difference pair of t1. It is also an mgdp of this log. Thus query 2 2
q is a mgdq of the log, as well as query q23 since both queries contain t2. For these mgdq, queries
1 1 q , q12, q , 32 2 5 q are
drill-down difference queries and queries q , 32 2 4
q , q13 are exception queries. The following
investigation is created: <t2,{ 2 2 q , q23},{ 1 1 q , q12, 2 3 q , q },{52 2 3 q , q42, 3 1 q }>. Similarly, Algorithm 1 produces two other investigations corresponding to the mgdp milk, 2007sem2, France, 10 , cheese, 2008sem1, France, 1 and milk, 2008sem1, France, 10 , cheese, 2008sem1, France, 1 (see Figure 3).
Figure 3: Result of the processing of the log.
Computing recommendations
The Algorithms for computing recommendations are given below. In their simplest form, recommendations are sets of queries extracted from investigations. A more sophisticated form for presentation to the user is to arrange these queries into a graph for the user to navigate.
difference pair mgdq drill-down queries exceptions 〈cheese, 2007, all, 200〉 〈cheese, 2008, all, 20〉 {q22,q23} { 1 1 q , q12, 2 3 q , q52} { 2 3 q ,q42, 3 1 q } 〈milk, 2007sem2, France, 10〉
〈cheese,2008sem1,France,1〉 {q11} { 1 2
q } Ø
〈milk, 2008sem1, France, 10〉
〈cheese,2008sem1,France,1〉 {q11} { 1 2
q } Ø
Given a current session cs, a current query q and a set of investigations I, the recommender system first identifies in I the set of mgdp to which q can be related. For such an mgdp m, q can be either a drill-down difference query w.r.t. m, a roll-up difference query w.r.t. m, or an exception w.r.t. m. In each case a specific function is used to construct the recommendation from the investigation whose difference pair is m.
Algorithm 2: Recommendations for a current query
Input: A current query q, a set I of investigations, a Boolean function fdp Output: A graph G of recommended queries
G ← 〈 Ø,Ø 〉 M ← mgdq(I)
foreach difference pair 〈 c,c' 〉 of difference(q,fdp) do // first check if q is a drill-down difference
C ← rollupDifference(c,c',M) if C ≠ Ø then
G ← G U recommendDrilldown(c,c',q,C)
// then check if q is a roll-up difference
C ← drilldownDifference(c,c',M) if C ≠ Ø then
G ← G U recommendRollup(c,c',q,C)
// finally check if q is an exception to a difference
foreach difference pair ‹x,x'› of m ∈ M do C ← exceptions(x,x',{q}) if C ≠ Ø then G ← G U recommendException(c,c',q,C)
Function recommendDrilldown is given below. The idea is to recommend the queries of the investigations which mgdq is a roll-up difference query of the current query, with the queries of the session arranged in a given order (first the mgdq, then the drill-down differences of the current query, etc.). The recommendation is a navigation plan, i.e., a graph of queries rooted in the current query q. The other functions used in Algorithm 2 for
query q is detected as an exception of the mgdq of an investigation, then it makes sense to present first the exceptions of the mgdq that are the roll-up difference queries of q, and then the exceptions of the mgdq that are drill-down difference queries of q.
Function recommendDrilldown(c,c',q,C)
Input: A difference pair 〈 c,c' 〉 , a current query q, a set C of difference pairs Output: A graph G = 〈 V,E 〉 of queries
E ← Ø V ← Ø
foreach pair m
∈
C do// get the investigation having m as mgdp i ← 〈 m,M,D,X 〉
//create vertices
V ← V U M U D U X //create edges
// arrange the queries of i into a graph
let S1 = drilldownDifference(c,c',D) // the drill-down
differences of q
let S2 = exceptions(c,c',M) // the exceptions to q in M
let S3 = D-S1 // the drill-down diff. to m which are not drill-down diff. of q
let S4 = E-S2 // the exceptions to m which are not exceptions of q
// 1. Link q to the most general queries M E ← (q × M) U (M × M)
// 2. Link the most general queries to the drill-down diff. of q E ← E U (M × S1) U (S1 × S1)
// 3. Link the drill-down diff. of q to the exceptions to q E ← E U (S1 × S2) U (S2 × S2)
// 4. Link the exceptions of q to the drill-down diff. to m E ← E U (S2 × S3) U (S3 × S3)
// 5. Link the drill-down diff. of m to the exceptions to m E ← E U (S3 × S4) U (S4 × S4)
Example 9. Consider the log of Figure 1. The pair of cells t1 = cheese, 2007, Europe, 100 ,
cheese, 2008, Europe, 10 is detected as a difference pair for the current query. It is a drill-down pair of pair t2 = cheese, 2007, all, 200 , cheese, 2008, all, 20 that is one of the
most general difference pair detected in the log. Thus a recommendation for the current query will use the investigation <t2,{
2 2 q , q32},{ q11, q12, 2 3 q , q },{52 2 3 q , q42, 3 1
q }> whose queries will be arranged into a graph as depicted by Figure 4. Note that few links between queries inside S1
and S2 are missing to alleviate the schema. In this example, there is no recommendation
corresponding to the sets S3 and S4.
Figure 4: Navigation plan of Figure 1 resulting from recommender system
IMPLEMENTING THE FRAMEWORK
In this section we describe our implementation of Algorithms 1 and 2 that are at the core of our framework. We used Java and the Mondrian OLAP engine (Pentaho, 2009) to process and recommend MDX (Microsoft, 2008) queries.
In our implementation, the detection and construction of investigations is an offline process that reads a log file and resubmits the queries to detect difference pairs in their result. In the framework, the detection of base difference pairs relies on a function fdp used as a parameter of Algorithm 1. Our implementation proposes basic functions for this test relying
of two cells' measures with a given threshold
α
. Comparisons can be done for all pairs' , c
c of cells in a query result or only for all pairs c, c' along a particular dimension.
The implementation of the operators rollupDifferencePairs, drilldownDifferencePairs and exceptionPairs for detecting the various types of difference pairs relies on the RELAX and DIFF operators proposed by Sarawagi (Sarawagi, 1999; Sathe et al., 2001). We use the Java implementation named iCube that is freely available for download (Sarawagi, 2009). These operators have a built-in function r to detect if a pair’s difference is significant w.r.t. another given pair. It is to be noticed that, due to the lack of a standard Java API for OLAP, part of the implementation effort has been spent on the interoperability between Mondrian and iCube.
To implement the operators rollupDifference, drilldownDifference and exception from the RELAX and DIFF operators, a function is needed that detects if the results of these operators appears in a given set of queries. In our implementation, we use the function detect that, given a difference pair for a query q detects in a set Q if there are roll-up differences, drill-down differences or exceptions to the pair, with the operator op.
Function detect(q,c,c',op,Q)
Input: A query q, a pair of cells c, c' , an operator op, a set of queries Q Output: A set S of queries
foreach (x,x') ∈ op(q,c,c') do foreach query q' ∈ Q do if (x,x') ∈ q' then S ← S U {q'}
In a call to function detect, the op operator can be either DIFF or RELAX. For instance, if DIFF is used and Q is the server log, the call detect(q, c, c’, DIFF, Q) detects the queries of the log that are drill-down difference queries of q w.r.t. c, c' . As the result of the
RELAX operator contains both generalizations and exceptions to generalizations for a given pair of cells, it is used to detect both roll-up differences and exceptions. Thus the detection of exceptions to a pair c'' c, ' '' is done by calling detect(q, c, c’, RELAX, Q) where c, c' is a drill-down pair of c'' c, ' '' and by checking that the exception pairs obtained are indeed drill-down pairs of c'' c, ' '' .
EXPERIMENTS
In this section, we describe the experiments we conducted to illustrate the effectiveness of our approach. These tests consist essentially in a precision/recall analysis of the recommendations computed from a query log composed of several sessions. The sessions are synthetically generated sequences of MDX queries, produced with our log generator, over the Foodmart test database supplied with the Mondrian OLAP engine. We first describe the generator and then present the experiments.
The log generator
Our log generator is implemented in Java. It produces a log of X sessions, each of them consisting of at-most Y queries. To fit the context of discovery-driven analysis, each session simulates a discovery-driven analysis session by using whenever possible the icube operators DIFF or RELAX.
The Z parameter is a number that is used to play with the density of the log. It represents the number of dimensions (the Z first dimensions out of the total number of dimensions of the considered cube) that can be manipulated in a session to explore the cube. The higher this number, the higher the probability of exploring different parts of the cube, and hence the sparser the log.
Algorithm 3: log generator
Input: a number (X) of sessions, a maximal number (Y) of queries per session,
a number (Z) of dimensions in the pool, a function fdp for detecting difference pair Output: a log L
// create X sessions as follows: Repeat X times
// create the first query
Randomly select two dimensions d1, d2 among the Z dimensions
Create the first MDX query as:
SELECT d1.all.Children ON ROWS,
d2.all.Children ON COLUMNS
FROM Sales; // create subsequent queries
Let y be a random integer in [2,Y] Repeat y times
Let q be the query created previously
Randomly select a difference pair p in the result of q Randomly select op in {DIFF, RELAX}
Apply op on the pair p and get a set S of one member per dimension
// generate one query that contains one difference pair of the result of op If S ≠ Ø
For each member m of dimension d of S
Randomly choose M={m} or M={m.Parent.Children}
Modify q by substituting in q the members in dimension d by the members in M
If S = Ø
Randomly select among the Z dimensions a dimension d whose displayed level is all
Modify q by adding d.all.Children
The experiments
The experiments were conducted on a Xeon E5430 with 32 GB RAM, running Linux CentOS5. We used 5 generated log files of quite high density (5 dimensions out of the 13
dimensions available for the FoodMart cube). Four of them were processed for computing investigations. They contained 25 sessions (119 queries), 50 sessions (242 queries), 100 sessions (437 queries) and 200 sessions (936 queries) respectively.
The processing was done with Algorithm 1 and took from less than 1 hour to 24 hours depending on the size of the log file and the value used for detecting the difference pairs. The fifth log file contained 25 sessions and was only used for choosing the current queries for which recommendations were to be computed. For each session of size s, a random n in [1,s] is chosen, the final n queries of the session were removed and played the role of the expected queries. The (s-n)th query of the session played the role of a current query.
Our first experiments tested the parameter
α
used in the function that detects difference pairs by computing the ratio between two cells’ measures. This value should be small enough to be able to propose at-least one recommendation but also big enough not to overwhelm the user with recommendations. Ideally it should be such that the ratio) ( ) ( sessions of number ions investigat of number
is close to 1 if each session indeed investigates one particular
mgdp. For each log file, four values of
α
were tested: 2, 3, 5 and 7. For the log containing 25 sessions, 8 values were tested: 0.5, 2, 3, 5, 7, 10, 15 and 25. The results of these tests are depicted in Figure 5.
(c) (d) Figure 5: Assessing the value of α.
As expected, Figure 5 (a) shows that
α
directly influences the number of investigations detected in the log. More interestingly, Figure 5 (b) shows howα
relates to the number of investigations per session. Note that the evolution is similar whatever the size of the log. Thus in what follows, unless otherwise stated, a mean is computed over all log files. Figure 5 (c) shows that the mean number of recommended queries for variousα
is quite stable with a maximum forα
=3. Figure 5 (d) shows as expected, for the log of 25 sessions, that the less investigations, the more absences of recommendations. These tests suggest that for this dataset, a value forα
in [3,5] would be a good candidate, which was confirmed by our precision test (see below).We next evaluated the time taken to compute recommendations, focusing on the on-line phase. In this test, the time used to arrange the recommended queries into a graph is not taken into account. It means that we evaluated the time taken by Algorithm 2 but with functions recommendDrilldown, recommendRollup and recommendException simply delivering lists of recommended queries. Figures 6 and 7 show that whatever the value for
α
and the number of investigations or the log size (in terms of number of queries), this time does not exceed 72 ms, and seems to grow linearly with the number of investigations (resp., the log size). Note that, as expected, the higherα
, the more efficient the computation, sinceα
directly impacts the number of investigations to be searched to compute recommendations.Mean recommendation time by number of investigations for various alpha
0 15 30 45 60 75 0 150 300 450 600 750 Number of investigations M e a n T im e ( m s ) α = 2 α = 3 α = 5 α = 7
Figure 6: Mean recommendation time by number of investigations for various α.
Figure 7: Mean recommendation time by log size for various α.
Our final tests consisted in evaluating, for a set of 25 current queries, to what extent the recommended queries were relevant by a precision/recall analysis. Regular precision and recall would assess the fraction of the n removed queries found in the set of recommended queries. In our case, given that it is very unlikely to have in the log files the same query twice, precision and recall were computed w.r.t. the members found in the queries. Thus precision gives the number of members both expected and recommended divided by the number of members that are recommended, and recall gives the number of members both expected and recommended divided by the number of members that are expected. Figure 8 displays the
mean recall which is very low. The low recall is easily explained by the fact that the set of expected members (from the n removed queries of the chosen session) can be very large and can very seldom appear in the set of recommended members. Nevertheless, in these cases, the achieved precision is very satisfactory, showing that recommendations indeed focus on what is expected. Precision alone is given in Figure 8 (b) and (c) for various values of
α
. Figure 8 (b) takes into account the cases when no recommendation can be issued, with a precision only above average. However, when recommendations can be issued (Figure 8 (c)), the achieved precision is very high, demonstrating the effectiveness of the approach for logs of a rather high density.(a) (b)
(c)
Figure 8: Precision / Recall analysis.
In this section, we briefly comment the feasibility of our approach, beyond the prototypical implementation, to adapt it to real OLAP systems. Recall that in what we have presented so far, the approach is a two-step process. The first phase processes the log off-line to discover investigations. This phase is very time consuming since it has to resubmit the queries of the log and to pair cells of all the answers (Ordonez et al., 2009). The second phase computes recommendations by accessing investigations. Our tests showed that this phase can be implemented efficiently if the list of investigations is in main memory.
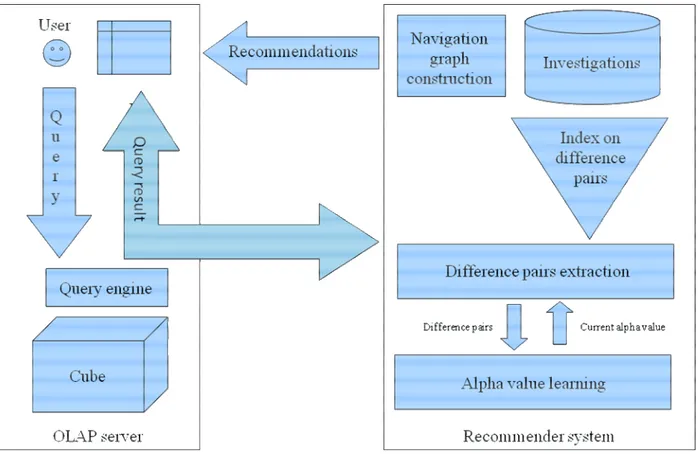
Figure 9: Architecture of a recommender system for discovery-driven analysis.
In a real setting, as illustrated in Figure 9, the off-line phase is purely suppressed. Instead, investigations are created and maintained on the fly during the current user analysis. To this end, a dedicated server for maintaining and searching investigations is needed. Each time a user (current) query arrives, it is passed to the OLAP query engine to be executed and once the result is known, it is passed to the recommender system to be analysed and to give
by their difference pairs. The list includes the investigations created for the current analysis session.
The recommender system analyses the current query result q using the following architecture (data structures needed are discussed in the next subsection). For each difference pair detected d in q, an index to access investigations is used to find the investigations to which d is either a rollup, a drilldown, or an exception. If no investigation is found, a new investigation with d as mgdp is created and the index is modified accordingly. Otherwise, for each investigation found, recommendations are generated using Algorithm 2. Then the investigation is modified (q is added w.r.t. its relation with the difference pair of the investigation), and so is the index, if d is the new difference pair of the investigation.
Data structure and organisation needed
With this setting, it is easy to see that the most time consuming phase is the first one, that raises the following problem: Given a pair of cells p, find the roll-up or drill-down pairs of cells of p. That is, given a cell reference, find all its ancestors or descendants.
To the best of our knowledge, no index mechanism exist in the literature that can help solving this particular problem efficiently (even though some storage techniques could be adapted, see e.g., Lakshmanan et al. 2003). We propose the following indexing mechanism that is basically a set of pairs, together with the dimension tables. Our index relies on the lattice of cuboids to store pairs of cells. It means that all the pairs having a given schema are stored altogether. For instance, consider the 2 pairs of cells: cheese, 2007, all, 200 , cheese, 2008, all, 20 and milk, 2008sem1, France, 10 , cheese, 2008sem1, France, 1 . These two pairs have the same schema and thus are stored together. Note that, by definition of investigation, we have to store only the most general difference pairs in the index. Each cuboid points to its direct ancestors and descendants.
To find all the ancestors or descendent of a pair p, the lattice of cuboids is used as a search structure. The schema of p is used to locate the cuboid it belongs to. If the pair already exists in the cuboid, corresponding investigations are accessed and recommendation can be computed. Otherwise, if the pair does not exist in the cuboid, all cuboids that are ancestors or descendants of the current cuboid are searched recursively for correspondence with p.
In addition to the dimension tables, in a given cuboid, an efficient data structure, like for instance a trie, is needed to search for an ancestor/descendant of a given cell. Once a difference pair is found that is an ancestor or a descendant of a given pair, a pointer is used to access its investigation.
This index is illustrated Figure 10, that partly displays the index for the investigations given Figure 3. Empty cuboids like the one for schema product, year, country will not be stored in practice.
Adjusting the value of the parameter α
Our approach heavily relies on the value of the α parameter that is used to detect if a pair of cells is indeed a difference pair. This value depends on the distribution of the measures in the cube and on the function fdp used to detect base difference pair. In the new setting that we are describing, the value for α could be learned by the system on the fly. Assume the recommender system maintains a value guessed from the analysis of the query result. Each time a current query is processed (i.e., the result is scanned for difference pairs), this result is used as a sample of the data of the cube. The recommender system then updates the value for α based on this sample of the data of the cube and on the fdp function. For instance, suppose that fdp compares the ratio of two cell measures with the value of α. To learn the value of α, the recommender systems records the mean µ and the standard deviation σ of these ratios, with no processing overhead since the ratios are computed to detect difference pairs. A naïve estimation for α can be for instance µ+σ. Note that the fact that a recommendation suggested by the system has been followed by the user can also be taken into account for adjusting the value of α.
CONCLUSION
In this paper we propose a framework for recommending queries to support OLAP discovery-driven analysis. The key idea is to infer from the log of the OLAP server what former users were investigating, and to use this information as a basis for helping the current user to navigate the cube. This framework is implemented with Java and the Mondrian OLAP
engine to recommend MDX queries. Our preliminary tests show that our system proposes recommendations of promising good precision.
Achieving a scalable, more efficient and effective implementation of the framework is the first of our future work. Increasing effectiveness can be done by recommending queries even when our approach fails in computing any. This can be done by incorporating other recommendation techniques such as the ones we have proposed in our earlier works. As for efficiency and scalability, the processing of the log can be replaced by an incremental approach, as presented in the previous section.
Our long-term goal is to provide OLAP users and administrators with a platform for computing various types of recommendations. This platform will integrate the present framework with our earlier work (Giacometti et al., 2008; Giacometti et al., 2009), and should also not be limited to discovery-driven analysis. It should include content-based techniques (Chatzopoulou et al., 2009) as well as context-aware methods combined with user profiles (Jerbi et al., 2009; Bellatreche et al., 2005; Golfarelli et al., 2009) to compute personalized recommendations, i.e., w.r.t. the user, in a multiple-user scenario. We are working in that direction.
In addition to this, we will conduct experimentations on real data sets with feedback from users. This will allow not only to improve the overall quality of the recommended queries but also to determine to which context a particular approach for computing recommendations is adapted. To this end we are currently working with IRSA (a French social security health examination centre) to analyze over 500.000 health care examination questionnaires.
Adomavicius, G., & Tuzhilin, A. (2005). Toward the next generation of recommender systems: A survey of the state-of-the-art and possible extensions. IEEE Trans. Knowl. Data
Eng., vol.17(6), pp. 734–749.
Bellatreche, L., Giacometti, A., Marcel, P., Mouloudi, H., & Laurent., D. (2005). A personalization framework for OLAP queries. In Proceedings of the 8th ACM International Workshop on Data Warehousing and OLAP (DOLAP 2005), pp 9–18, ACM.
Cariou, V., Cubillé, J., Derquenne, C., Goutier, S., Guisnel, F., & Klajnmic, H. (2007). Built-in Built-indicators to automatically detect Built-interestBuilt-ing cells Built-in a cube. In ProceedBuilt-ings of the 9th
International Conference on Data Warehousing and Knowledge Discovery (DaWaK 2007), pp 123–134, Springer.
Cariou, V., Cubillé, J., Derquenne, C., Goutier, S., Guisnel, F., & Klajnmic, H. (2008). Built-in Built-indicators to discover Built-interestBuilt-ing drill paths Built-in a cube. In ProceedBuilt-ings of the 10th
International Conference on Data Warehousing and Knowledge Discovery (DaWaK 2008), pp 33–44, Springer.
Chatzopoulou, G., Eirinaki, M., & Polyzotis, N. (2009). Query recommendations for interactive database exploration. In Proceedings of the 21st International Conference on Scientific and Statistical Database Management (SSDBM 2009), pp 3–18, IEEE Computer Society.
Downey, D., Dumais, S.T., Liebling, D.J., & Horvitz, E. (2008). Understanding the relationship between searchers’queries and information goals. In Proceedings of the ACM 17th Conference on Information and Knowledge Management (CIKM 2008), pp 449–458, ACM.
Giacometti, A., Marcel, P., & Negre, E. (2008). A framework for recommending OLAP queries. In Proceedings of the 11th ACM International Workshop on Data Warehousing and OLAP (DOLAP 2008), pp 73–80, ACM.
Giacometti, A., Marcel, P., & Negre, E. (2009a). Recommending multidimensional queries. In Proceedings of the 11th International Conference on Data Warehousing and Knowledge Discovery (DaWaK 2009), Springer.
Giacometti, A., Marcel, P., & Negre, E. (2009b). Query recommendation for OLAP discovery driven analysis. In Proceedings of the 12th ACM International Workshop on Data Warehousing and OLAP (DOLAP 2009), pp 81–88, ACM.
Golfarelli, M., & Rizzi, S. (2009). Expressing OLAP preferences. In Proceedings of the 22th
International Conference on Scientific and Statistical Database Management (SSDBM 2009), pp 83–91, IEEE Computer Society.
Gray, J., Chaudhuri, S., Bosworth, A., Layman, A., Reichart, D., Venkatrao, M., Pellow, F., & Pirahesh, H. (1997). Data cube: A relational aggregation operator generalizing group-by, cross-tab, and sub totals. Data Min. Knowl. Discov., vol.1(1), pp 29–53.