READ THESE TERMS AND CONDITIONS CAREFULLY BEFORE USING THIS WEBSITE. https://nrc-publications.canada.ca/eng/copyright
Vous avez des questions? Nous pouvons vous aider. Pour communiquer directement avec un auteur, consultez la première page de la revue dans laquelle son article a été publié afin de trouver ses coordonnées. Si vous n’arrivez pas à les repérer, communiquez avec nous à [email protected].
Questions? Contact the NRC Publications Archive team at
[email protected]. If you wish to email the authors directly, please see the first page of the publication for their contact information.
NRC Publications Archive
Archives des publications du CNRC
This publication could be one of several versions: author’s original, accepted manuscript or the publisher’s version. / La version de cette publication peut être l’une des suivantes : la version prépublication de l’auteur, la version acceptée du manuscrit ou la version de l’éditeur.
Access and use of this website and the material on it are subject to the Terms and Conditions set forth at
Analysis of errors due to edge heat loss in guarded hot plates
Woodside, W.
https://publications-cnrc.canada.ca/fra/droits
L’accès à ce site Web et l’utilisation de son contenu sont assujettis aux conditions présentées dans le site LISEZ CES CONDITIONS ATTENTIVEMENT AVANT D’UTILISER CE SITE WEB.
NRC Publications Record / Notice d'Archives des publications de CNRC:
https://nrc-publications.canada.ca/eng/view/object/?id=e351bcf6-7161-42fa-a324-f361907cdf42 https://publications-cnrc.canada.ca/fra/voir/objet/?id=e351bcf6-7161-42fa-a324-f361907cdf42
Ser
TH1
N21r2
no.
49
c. 2-
.:
i r 1 , 'NATIONAL
RESEARCH
COUNCIL
C A N A D A
DIVISION O F B U I L D I N G R E S E A R C H
-7..
\
N A T I O N A L RESEARCH COUNCIL:ANALYSIS OF ERRORS DUE TO EDGE HEAT LOSS
IN GUARDED HOT PLATES
BY
WILLIAM WOODSIDE
REPRINT FROM AMERICAN SOCIETY FOR TESTING MATERIALS SYMPOSIUM O N THERMAL CONDUCTIVITY MEASUREMENTS AND APPLICATIONS O F
THERMAL INSULATIONS. SPECIAL TECHNICAL PUBLICATION NO. 217. 1957. P. 4 9 - 6 2 . R E S E A R C H P A P E R N O . 49 O F T H E DIVISION OF B U I L D I N G R E S E A R C H O T T A W A F E B R U A R Y 1958 N R C 4451 P R I C E 2 5 C E N T S
This p u b l i c a t i o n i s being d i s t r i b u t e d by
t h e Division of Building Research of t h e National
Research Council a s a c o n t r i b u t i o n towards b e t t e r
b u i l d i n g i n Canada.
I t
should not be reproduced
i n whole o r i n p a r t , without permission o f t h e ori-
g i n a l p u b l i s h e r ,
The Division would be glad t o be
of a s s i s t a n c e i n o b t a i n i n g such p r m i s s i o n .
P u b l i c a t i o n s of t h e Division
o fBuilding
Research may be obtained by m a i l i n g the a p p r o p r i a t e
remittance,
( a Bank, Fxpress, o r Post Office Money
Order o r a cheque ma.de payable a t par i n Ottawa,
t o t h e Receiver General of Canada, c r e d i t National
Research c o u n c i l ) t o t h e N a t i o r a l Research Council,
Ottawa.
Stamps a r e not a ~ c e p t a b 1 . e ~
A
coupon system has been introduced t o
make payments
f o r p u b l i c a t ions r e l a t i v e l y simple,
Coupons a r e a v a i l a b l e i n denominations of
5,
25,
and
50c e n t s ,
and may be obtained by
making
a re-
mittance a s i n d i c a t e d above,
These coupons may be
used
f o r t h e purchase of a l l National Research
Council p u b l i c a t i o n s i n c l u d i n g s p e c i f i c a t i o n s of
t h e Canadian Government S p e c i f i c a t i o n s Board.
Authorized Reprint from the Copyrighted Symposium on Thermal Conductivity Measurements a n d
Applications of Thermal Insulations
Special Tecktrical Pwblicalion N o . 217
Published by the
AYERICAN SOCIETY FOR TESTING MATERIALS
1957
ANALYSIS O F E R R O R S D U E T O E D G E H E A T LOSS I N GUARDED H O T PLATES*
A concise, easily evaluated analytical expression for the error in thermal
conductivity measurement by the guarded hot plate, due to heat exchange with the ambient air, is derived assuming that the temperature distribution along the specimen edges may be represented by a mean temperature. This solution agrees closely with one presented by Somers and Cyphers for the special case of the specimen edges held a t the cold plate temperature.
The error is shown to depend upon three dimensionless parameters: ( a ) the ratio of guard ring width to specimen thickness; (b) the ratio of the length of side of the test area to specimen thickness; and ( c ) a number between zero and unity whose value is determined by the specimen-edge-temperature distribu- tion. The ASTM specimen thickness requirements3 are based only upon the first parameter. The approximate effect of the size of the test area upon the error is described.
A procedure is proposed for testing, when necessary, very thick specimens.
This involves the measurement of the specimen-edge-temperature distribu- tion during test (with or without edge insulation), calculation of the error, and correction of the measured conductivity.
The guarded hot plate method for de- termining the thermal conductivity of building and insulating materials as- sumes unidirectional heat conduction through the test specimens in the region
*
This paper is a contribution from the Divi- sion of Building Research, National Research Council of Canada and is published with the approval of the Director.1 Research Officer, Division of Building Re-
search, National Research Council of Canada, Ottawa, Canada.
3 The boldface numbers in parentheses refer
to the list of references appended to this paper, see 11. 63.
Method of Test for Thermal Conductivity of Materials by Means of the Guarded H o t Plate (C 177 - 45), 1955 Book of ASTM Stand- ards, Part 3, p. 1084.
of the central test area. This is equivalent to assuming t h a t the isothermals in the section of the specimens adjacent to the test area of the heater plate a r e planes parallel t o the hot and cold plate sur- faces. T h e accuracy of the method de- pends upon the validity of this assurnp- tion.
Distortion of the isothermals may be caused by small differences i n tempera- ture or unbalances between the test and guard areas of the heater plate. Errors resulting from this source are discussed in a companion paper (2). How- ever, even when the test area a n d guard ring are perfectly balanced, unidirec-
tional heat flow may not occur in the ,'*test section of the specimens if the width of the guard ring is insufficient for the thickness of specimen being tested. The edges of the test specimens and the edge of the guard ring lose or gain heat by exchange with the ambient air. This results in a non-linear temperature distribution along the edge of the specimen even when edge insulation is applied to reduce the magnitude of the edge heat losses. The resulting distortion
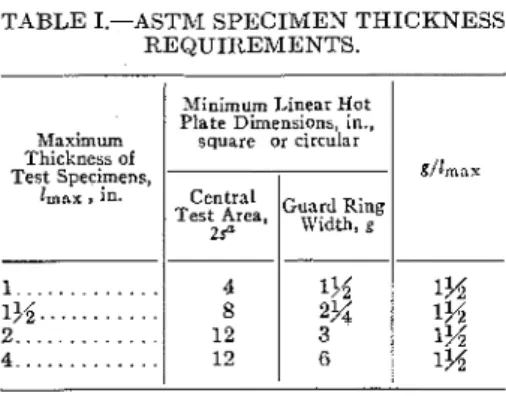
TABLE I.-ASTM SPECIMEN THICKNESS
REQUIREMENTS.
a Length of side of test area, in.
of the isothermals and heat flow lines may extend into the test section of the specimens and produce an error in the measured conductivity if the specimen thickness is too large or the guard ring width too small.
For this reason, maximum permissible
6/lmar
Maximum Thickness of Test Specimens,
lmnx '
British Standards Institution (BSI)' are based on values of 1.5 and 1.0 respec- tively for the lower limit of the ratio g/l. However the bases on which these minimum values of g/l were selected are not clear. The ASTM standard further specifies, apparently arbitrarily, mini- mum linear dimensions of test area for various thicknesses of test specimens. In addition to restricting specimen thick- nesses, the standard requires that the edges of the heater plate, test specimens, and cold plates be thermally insulated to reduce the net edge heat loss or gain, with edge insulation having a thermal resistance a t least twice that of the specimen. There does not appear to be any published information which gives the basis for these requirements.
PREVIOUS WORK
I n 1951, Somers and Cyphers (1) pre- sented a rigorous analytical solution which permitted the error in measured conductivity to be calculated from the known heater plate dimensions and the thickness of the specimens being tested. This solution assumed that the surface heat transfer coefficient h on the edges of the specimens approaches infinity (h -+ m), and that the ambient air tem-
perature equals the temperature of the cold plates. This was equivalent to assuming that the specimen edges are maintained a t a fixed temperature equal
Minimum Linear Hot Plate Dimensions, in., square or circular
specimen thicknesses for given heater Rkunion Internationale des Laboratoires plate dimensions have been specified by D'Essais et de Recherches sur les Matbriaux e t
les Constructions-International Assn. of Test- the ASTM3 and other organizations in ing and Researcl, ~ a b s . for ~ a t s . and Structures. their standard methods of test. Table 1 Btilletin, International Assn. of Testing and shows the
*sTBiI
maximum specimen Research Labs. for Mats. and Structures, No. 19, pp. 1-12 (1954). thickness requirements. From this table. Method of Test for Thermal ConductivitvT , " z F , " , L , ZP
it is evident that these requirements are based upon a lower limiting value of 1.5 for the ratio of guard ring width, g, to specimen thickness, I. The thickness requirements of RILEM" 6 * and the
Guard Ring Width, g
of Building Materials b y Means of the ~ u a r d e d Hot Plate, Laboratorio Nacional do Engenharia Civil, 13inisterio das Obras Publicas, Portugal. Definition of Heat Insulating Terms and Methods of Determin~ng Thermal Conductivity and Solar Reflectivity, Standard ATo. 874, Brit- ish Standards Inst~tution (1939).
to the cold plate temperature, which, of course, is not usually the case, and which results in much larger distortions of the isothermals and heat flow lines in the specimens than would normally occur. The errors predicted by Somers and Cyphers were thus much larger than the actual errors, but how much larger could not be determined. Furthermore, their solution involves the summation of a double infinite series that does not con-
Cold
and Cyphers, and by applying the re- laxation method to one speczc set of test conditions (given values of g, s, and I , ambient temperature and temperature difference between hot and cold plates) he obtained an error equal to one half of that predicted by Somers and Cyphers for the same conditions of g, s, and I.
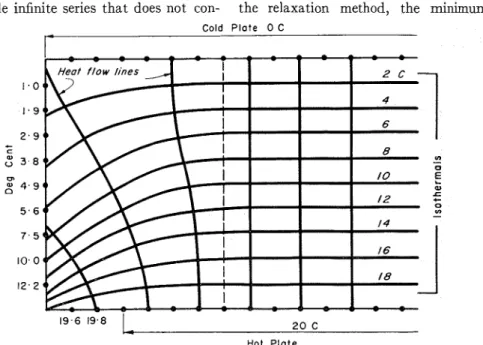
More recently Pascal (4) has investi- gated this problem. He determined, b y the relaxation method, the minimum
P l a t e 0 C
Hot P l a t e
FIG. 1.-Pascal's Measured Specimen-Edge-Temperature Distribution for a Thick Specimen Well Insulated Around its Edges, and the Heat Flow Lines and IsothermalsObtained by the Relaxa- tion Method.
verge rapidly and therefore is not simple to evaluate. They concluded that the maximum permissible thicknesses s~ecified bv ASTM could be more than doubled if an error of 5 per cent, as calcu- lated from their equation, were accepted. Dusinberre (3) . . in 1952 used the relaxa- tion technique to predict errors due to edge heat loss. By assuming a more re- alistic value of h / k B than did Somers
8 h = surface heat transfer coefficient for specimen or edge insulation. Btu per hr sq f t deg Fahr.
lz = thermal conductivity of test sgecimens, B t u in. per hr sq ft deg Fahr.
value of the ratio
gll,
guard ring width to specimen thickness, which would retain unidirectional heat flow in the test section of the specimens. The tem- perature distribution along the edges of specimens was obtained by measurement on actual specimens which were well insulated against edge heat loss to the ambient air. T h e result of Pascal's relaxa- tion solution is shown in Fig. 1 with the isothermals and heat Row lines. Beyond the dotted line, the isothermals are substantially parallel to the hot- and cold-plate surfaces. The dotted line repre-sents a value of g/l = 0.7 in contrast to the minimum permissible value specified by ASTM, g/l = 1.5. Two criticisms may be made of this solution. I t was assumed that the only parameter affecting edge heat loss errors was the ratio g/l, whereas, as will be shown later, the ratio s/l, the ratio of the test area dimension to speci- men thickness, is also an important parameter. Secondly, in performing the relaxation, two-dimensional flow was assumed. This assumption is incorrect since the area for lateral heat conduction
but which is more readily adaptable to realistic boundary conditions.
The following assumptions are made: 1. The hot and cold plate surfaces are isothermal. This assumption neglects the existence of the gap separating the central test area and the guard ring of the heater plate, and also presupposes that the test and guard areas are main- tained at the same temperature, that is, that the plate is perfectly "balanced."
2. The edges of specimens are main- tained a t a uniform temperature, this
i i
I
c o l d-
I
~ l a t e---
x.
-t Y
FIG. 2.-Diagram Representing Part of the Cross-Section Through the Hot Plate - Test-Speci- men - Cold Plate System at the Center Plane, Showing the Coordinate Axes and Boundary Condi- tions.
increases in proportion to the distance from the center of the test: area.
I t is thus apparent that the magnitude of errors in measured conductivity due to edge heat loss is not known with any degree of precision. I n this paper a theoretical solution to the problem is developed which agrees with that of Somers and Cyphers for the special
temperature being between the hot and cold plate temperatures. Thus if the cold plate temperature is taken as 6 = 0 and the hot plate temperature as
e
=e l ,
then the edges of the specimen are assumed to be uniformly a t a fixed tem- perature 6 = eel, where 0
<
e<
1. The solution obtained will therefore depend upon the value of e selected. Putting e = 0 gives the case of the edges being maintained a t the cold plate temperature, which was the assumption made by Somers and Cyphers. Thus the solution derived here will contain that of Somers and Cyphers as a special case.Figure 2 represents part of a cross-section through the hot plate - test speci- men - cold plate system a t the center plane. M represents the center of the test area, BC the guard ring width, and CD the specimen edge for a square heater plate. The cold plate DEF is a t temperature 0 = 0, the specimen edge CD a t temperature 0 = eel, and the hot plate AMBC a t temperature 0 =
e l .
D is chosen to be the origin of a Cartesian coordinate system.To determine the two-dimensional temperature distribution in the specimen under the above boundary conditions, Fig. 2 will be transformed by means of a Schwarz-Christoffel conformal transformation to Fig. 3 where the tempera- ture distribution is more easily determined. This distribution will then be transformed back to Fig. 2 using the inverse transformation. I n Fig. 2, A and F may be taken to be a t x =
+
a, since this will not affect the temperature dis- tribution in the region to the left of M ( x<
x,,,) which is the region of interest.The Schwarz-Christoffel transformation which transforms the w-plane (v
>
0) to the z-plane (AMBCDEF and the space enclosed) is given by:where C is a constant to be determined from the known boundary conditions. Integrating,
s = C ( cosh-'(2w
-
1)+
C')where C' is also a constant.
When z = 0, w = 0; therefore C' =
-ir.
Also when z =il,
w = +I.:.
il = - ixC, C = - I/*, andTransposing,
c0Sh-' (270 - 1) = ix - T E / ~
=
1
(1-
cosh xz/l) . . . , . (1) 2This is the transformation that transforms Fig. 2 to Fig. 3. Replacing w by (u
+
iv)
The problem is now to determine the temperature distribution in Fig. 3 above the u-axis, with AC a t temperature 8 = O1
,
CD at temperature 0 = eOl,
and DF a t tem- perature 8 = 0.According to Carslaw and Jaeger (s), in the half-plane v
>
0 with v = 0 main- tained a t temperature f(?c), the steady-state temperature distribution is given by:This result will now be applied to the w-plane in Fig. 3. I11 this figure the following
relations hold :
f ( l l f ) = 0 for -
<
rl'<
0,f(zcl) = eel for 0
<
11'<
1 , f ( 1 l ' ) = 81 for 1<
21'<
+
m .This is the temperature distribution in the w-plane. T o obtain the distribution in the z-plane, ZL and v are simply replaced by the values given by
Eq
2.7.c Ty
cosh -. cos -
+
1. . .
By differentiating Eq 4 with respect to y and then putting y = I , the temperature gradient a t the hot plate surface is found to be:
Therefore the heat flux out of the test area is:
where k is the thermal conductivity of the specimens. Under ideal conditions when there are no edge effects and no distortioil of the isothermals and heat flow lines, the heat flux would be simply k&/1 which is independent of x. This expression is modi- fied by the factor in braces which takes account of the distortion of the ideal tem- perature distribution by edge effects.
This factor has been derived for the t~ilo-dimensional case, that is, for a system having the same cross-section as is shown in Fig. 2 but extending to infinity in the two directions normal to the plane of the figure.
The product solution giving the variation of the heat flux q over the hot plate surface of a scjuare heater plate, that is, the three-dimensional case, is as follows:
1
(
' :;r)si+
(1 - e)(
])-f::is 1 . . . (6)cosh --
+
1 cosh - - 1where x' is the space variable corresponding to x in a direction normal to the plane of Fig. 2.
The total heat flow out of one face of the test area will therefore be:
o+s o+3
Q = 4
L o
L=.
qa s
ds' .Performing the integration the followiilg result is obtained: x ( s
+
s ). . . (7)
cosh -
+
1But if kc,, is the experimentally measured thermal conductivity under these boundary conditions, Q is also given by:
B y equating these two expressioils for Q, given by E q s 7 and 8, the relationship be- tween the "true" conductivity
k
and the experimentally determined conductivitykc,, is found to be:
This expression from which the error (k,,,/k - 1) in thermal conductivity due to edge heat losses may be calculated is, as would be expected, independent of the con- ductivity of the specimens being tested. The error depends only upon the two dimen- sionless parameters s/l and g/l and also upon e which in turn depends upon the edge temperature distribution. Also it satisfies the basic requirement that the error is zero for large values of g/l, for if g is large compared with I, then:
1 and cosh - = - exp
1 2
Thus the error predicted by Eq 9 does tend toward zero as g/l increases.
Several special cases having different specimen-edge-temperature distributions are presented :
Case I: e = 0
This is the case treated by Somers and Cyphers, where edges of the specimen are maintained at cold plate temperature.
When e = 0 is substituted into E q 9 the following expression is obtained:
"'\
cosh ~ g / l -11
This is to be compared with the expression of Somers and Cyphers which is given in terms of the two dimensionless parameters:
and is
where a = (2172
+
1) and b = (2n+
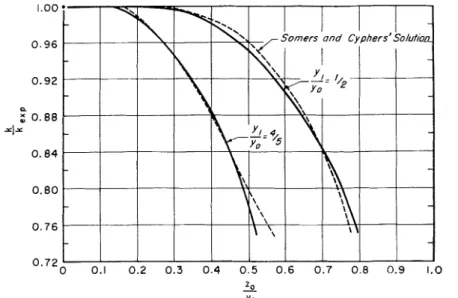
1).Somers and Cyphers presented their results graphically, plotting k/k,,, versus zo/yo for two values of the parameter yl/yo, namely 0.5 and 0.8. The evaluation of k/k,,, for any other value of yl/yo from their results would entail either a very rough estimate from their plotted results or further calculation on the basis of Eq 11.
the results of Somers and Cyphers are compared with those calculated from Eq 10 for the appropriate values of s/l and g/l.
Case 11: e = 1
I n this case, the edges of the specimens are maintained a t the hot plate tempera- ture. For this special case, Eq 9 becomes:
)
=,,,
(
cash r ( g + s ) / l +
cosh r g / l
+
1The errors calculated from this equation are similar in magnitude but of course opposite in sign (k
>
k,,,) to those calculated from E q 10.2 0
-
Yo
FIG. 4.-Comparison Between the Results of Somers and Cyphers and those Calculated from Eq 10.
Case 111: e = 0.5
This case assumes the specimen edges to be maintained a t a temperature equal to the mean of the hot and cold plate temperatures. Equation 9 now becomes:
lrs/l
' . . . . ' . . " . . . " . . . ' ' . . .
sinh ~ g / l
This equation predicts relatively small errors, since the boundary condition e = 0.5 is approximately representative of the ideal case where the temperature gradient along the edges of the specimen would be linear, as in the central part of the specimen. Equation 9 predicts accurately the error in measured conductivity for the special cases of the edges of specimens maintained a t any uniform temperature between the hot and cold plate temperatures. I n the following section, a method is proposed for the representation of actual specimen-edge-temperature distributions by a mean constant edge temperature and a corresponding value of e.
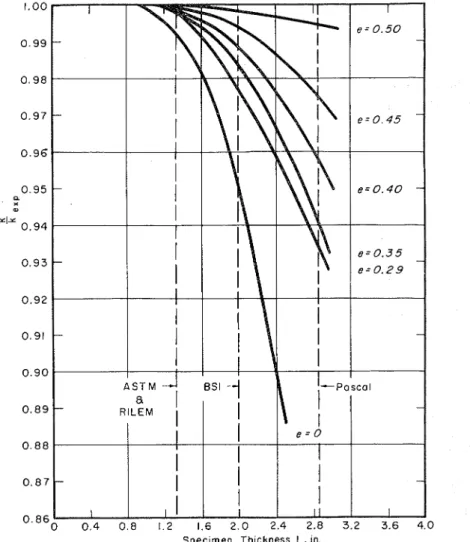
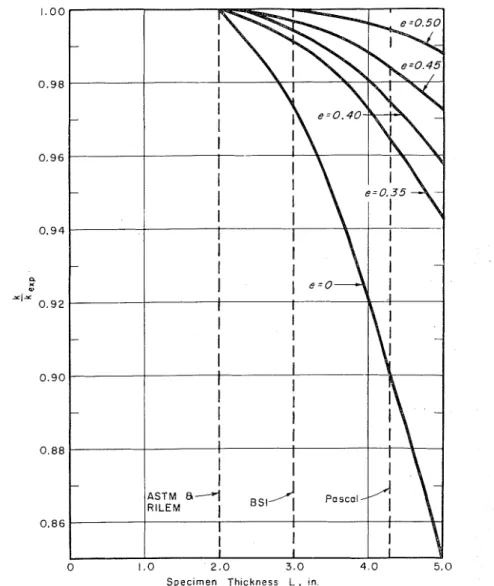
DISCUSSION lated around iLs edges. The method used Figure 5 shows k/k,, calculated from in arriving a t this value of e is described Eq 9 plotted against specimen thickness later. This value of e applies only to the
S p e c i m e n Thickness L , in
FIG. 5.-k/k,,p Calculated from Eq 9 Plotted Against Specimen Thickness ior an 8 by 8-in. Hot Plate Having s = g = 2 in. for Different Values of e.
I for an 8 by 8-in. hot plate having specimen thickness, edge insulation, s = g = 2 in., for different values of temperature conditions, etc., in the par- the parameter e = 0, 0.29, 0.35, 0.40, ticular test performed by Pascal, but is 0.45, and 0.50. The value e = 0.29 was plotted in Fig. 5 since it does represent calculated from the edge-temperature an actual measured edge temperature distribution (shown in Fig. 1) measured distribution. Figure 6 is a similar graph by Pascal on a thick specimen well insu- of k / k , , , versus specimen thickness for a
hot plate 18 by 18 in. having s = 6, ductivity. Curve c represents the average g = 3 in., for values of e = 0, 0.35, 0.40, or mean temperature of the specimen 0.45, and 0.50. edge for the linear distribution curve a
S p e c i m e n Thickness L , in.
FIG. 6 . - k l k , , , Calculated from Eq 9 Plotted Against Specimen Thickness for an 18 by 18-in. Hot Plate Having s = 6, g = 3 in. for Different Values of e.
I n Fig.
7,
which shows several hypo- and is approximated by a value for e of thetical specimen-edge-temperature dis- 0.5 (Eq 13). The calculated errors' for tributions, curve a represents the ideal e = 0.5 are non-zero for large specimen linear temperature distribution along thicknesses (see Figs. 5 and 6), but the the edge of the specimen from which no deviation froin zero, which is the true error would result in the measured con- error, is small. For example, in Fig. 5 fore = 0.5 and I as high as 3 in., the calcu- lated error is only 0.6 per cent.
This suggests that the actual meas- ured specimen-edge-temperature distri- bution may be approximately repre- sented by an average edge temperature for the purposes of error evaluation; this average edge temperature defines a corresponding value of e, and it appears that the error calculated from E q 9 with this value of e will differ only slightly from the true error. Suppose the meas-
Specimen Edge
FIG. 7.-Several Hypothetical Specimen- Edge-Temperature Distributions.
ured specimen-edge-temperature distri- bution is represented by curve b in Fig. 7. The mean edge temperature is then given by curve d, which is drawn in such a way that the shaded areas are equal. This defines an approximate value of e for such a distribution. Then using this value of e, together with the known values of g, s, and I for the test under consideration, the approximate error to be expected in the measured conductivity may be calcu- lated. This approximate error will be larger than the true error, since the assumption of a constant edge tempera- ture produces a still greater distortion of the heat flow lines. However, the differ- ence between the true and calculated
errors may only be an amount less than or equal to the amount b y which the calculated e = 0.5 error deviates from zero, which has already been shown to be small. This will require experimental verification.
Since the specimen-edge-temperature distribution depends upon the specimeil thickness, the correspondiilg value of e will also depend upon thickness. This means that an experimentally deter- mined curve of k/k,,, versus specimen thickness will not coincide with any of the calculated error curves obtained by assuming a constant value of e, such as those shown in Figs. 5 and 6.
A difficulty in measuring the specimen- edge-temperature distribution may be pointed out. If the hot plate apparatus is a horizontal one, that is with the plates and specimens stacked one above the other, the edge temperature distribution will be the same on all four edges of the specimen. If, however, the apparatus is arranged vertically, which is the most common arrangement, different edge temperature distributions will occur on the top, side, and bottom edges of the specimens. Such an arrangement would reauire the measurement of the edge diskbutions on all four edges, t i e average then being taken for the calcula- tion of e.
As has been pointed out, both ASTM and RILEM require g/l,,, = 1.5, whereas the BSI permits g/l,,, = 1.0. Pascal from his work concluded that g/l,,, = 0.7 would result in negligible errors when the edges of specimens are well insulated. For the heater plate con- sidered in Fig. 5, the maximum permis- sible thicknesses for test specimens according to these three requirements would be 1.33, 2.00, and 2.86 in. re- spectively. These are shown in Fig. 5, where it may be seen that, if e is assumed to be 0.29, specimens of these thicknesses
would result in errors of approximately 0.2, 2.3 and 6.6 per cent, respectively. Figure 5 suggests that the ASTM maximum specimen thickness require- ment is not too stringent for accurate test work with an 8 by 8-in. hot plate (s = g = 2 in.). Comparing Fig. 5 with Fig. 6, which is for an 18 by 18-in. hot plate, the error curves in Fig. 6 are dis- placed to the right (that is, the direction of increasing thickness) with respect to the ASTM maximum thickness limit. This suggests that thicker specimens than are allowed by the ASTM require-
ductivity, (1
-
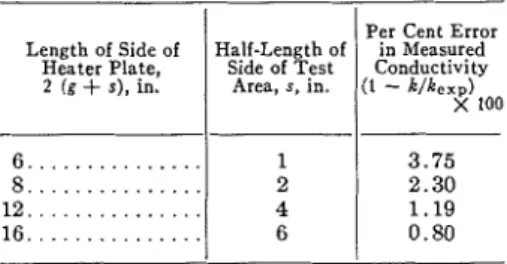
k/k,,) X 100, as calcu- lated from E q 9, is shown for heater plates having different sizes of test area. To determine the permissible variation of the ratio g / l m , with size of test area 2s, to keep errors in measured conduc- tivity below any desired limiting value (say 0.25 per cent), a series of experi- mental tests with different sizes of hot plate is required. If the difference be- tween the true error and that calculated from Eq 9 is found to be small, then to determine the error for any specific set of hot plate dimensions, all that would be required would be the measurement of TABLE 11.-EFFECT O F SIZE O F TEST the specimen-edge-temperature distri-IN MEASURED 'ON- bution under the test conditions. Such a DUCTIVITY.
e = 0.29. a = 1 = 2 in. series of tests is being planned in this Where e is a dimensionless numberrepresenta- laboratory with the three available sizes tive of specimen edge temperature distribution.
of hot plates.
ment might be tested in larger plates with the same accuracy, allowing the value of g / l m , to decrease as the plate size increases. At present the ASTM requirement specifies minimum linear dimensions of the test area for a given test specimen thickness (see Table I). A requirement which specified values of
g/lmaS for different sizes of test areas
would permit more flexibility in the design of heater plates than does the present requirement.
The effect of the size of the test area upon the error in measured conductivity is illustrated in Table 11, where, for a
Length of Side of
Heater Plate,
2 (1
+
s), in.guard ring width of 2 in., a specimen thickness of 2 in., and an edge-tempera- ture distribution represented by e = 0.29, the percentage error in measured con-
Half-Length of Side of Test
Area, s, in.
To reduce errors caused by edge heat loss to a minimum, the ASTM standard method of test requires that insulation be placed around the edges of the heater plate, test specimens, and cold plates, "of such a thickness that the resistance to edge losses shall be a t least twice and preferably three or more times the thermal resistance of the specimen in the direction of normal heat flow." There is no published information that provides the basis for this requirement. Also it is a blanket requirement for all tests, taking no account of varying test conditions. I t would be more satisfactory if the exact amount of edge insulation could be specified for any given set of test condi- tions. The more edge insulation applied, the closer will the specimen-edge-tem- perature distribution tend toward the ideal straight-line distribution for which there is no error. The error depends, however, upon other factors besides the thermal resistance to edge losses. I n the case of no edge insulation, the specimen- edge-temperature distribution, and hence the error, depend upon the conductivity, thickness, and surface heat transfer co-
Per Cent Error in Measured Conductivity (1
-
k / k e x p )efficient of the specimens, the ambient air temperature, t h e mean temperature and the hot plate - cold plate tempera- ture difference of the test. When edge insulation is applied, the specimen-edge- temperature distribution and the error depend upon the thickness and conduc- tivity of the edge insulation, as well as upon all the above factors. The orienta- tion of the apparatus, whether vertical or horizontal. will also be a factor for both cases. A limited testing program is being set up to determine the amount of edge insulation required for several test conditions, and, in this test series too, the analytical solution presented may prove to be of assistance.
The situation often arises where speci- mens must be tested whose thickness exceeds the maximum permissible in the available hot-plate apparatus. I n such a situation the error may be minimized by applying large amounts of edge insula- tion and keeping the ambient air tem- perature close to the mean temperature of test. Even when these precautions have been taken, the error in testing thick specimens may be large. If the specimen-edge temperature is measured during test, the appropriate value of e may be calculated, the approximate error determined from E q 9, and the measured conductivity corrected accord- ingly.
The following conclusions may be drawn from the analysis presented:
1. An analytical expression for the error in conductivity measurement by the guarded hot plate, due to edge heat exchange with the ambient air, has been obtained, assuming that the actual specimen-edge-temperature distribution may be represented by a uniform mean temperature. The solution agrees closely with that of Somers and Cyphers for the boundary conditions assumed by them and is much simpler to evaluate.
2. The ratio of the length of side of test area of the heater plate to the speci- men thickness is an important factor in determining the error, as well as the ratio of guard ring width to specimen thick- ness. I t is shown that for a prescribed guard ring width and acceptable error, the larger the test area, the thicker the specimens that may be tested.
3. Experimental data are needed to enable the establishment of maximum specimen thickness requirements and edge insulation requirements on a more rational basis. The analytical solution presented may perhaps be of assistance in this respect. Experimental data are also needed to test the applicability of the procedure suggested for testing very thick specimens, when necessary. Acknowledgments:
The author wishes to express his thanks to Mr. A. G. Wilson and Mr. D. G. Stephenson for many helpful dis- cussions and to Mr. N. B. Hutcheon for his continued encouragement.
(1) E. V. Somers and J. A. Cyphers, "Analysis of Errors in Measuring Thermal Conductivi- ties of Insulating Materials," Rmiew Scien- ti+ I~zstru?nents, Vol. 22, No. 8, pp. 583-585
(1951).
(2) W. Woodside and A. G. Wilson, "Unbalance Errors in Guarded Hot Plate Measure- ments," Symposium on Thermal Insulating Materials, Am. Soc. Testing Mats., p. 32 (1957). (Issued a s separate publication,
ASTM S T P No. 217.)
(3) G . M. Dusinberre, "Further Analysis of LENCES
Errors of the Guarded H o t Plate," Review
Scienti$c Instrz~nzeizts, Vol. 23, No. 11, p.
649 (1952).
(4) A. Pascal, "La Mesure de la Conduction Thermique des MatCriaus du Bgtiment,"
A~cnales de 1'I?~stit?d Tecl~~riq~le dz~ Bitifnent e/ des Tracaiix Pz~blics, NO. 90, pp. 583-598
(1955).
(5) H. S. Carslaw and J. C. Jaeger, "Conduction of Heat in Solids," Clarendon Press, Oxford, 386 pp., 1947.