HAL Id: hal-01634498
https://hal.archives-ouvertes.fr/hal-01634498
Submitted on 22 Nov 2017
HAL is a multi-disciplinary open access
archive for the deposit and dissemination of
sci-entific research documents, whether they are
pub-lished or not. The documents may come from
teaching and research institutions in France or
abroad, or from public or private research centers.
L’archive ouverte pluridisciplinaire HAL, est
destinée au dépôt et à la diffusion de documents
scientifiques de niveau recherche, publiés ou non,
émanant des établissements d’enseignement et de
recherche français ou étrangers, des laboratoires
publics ou privés.
Solidification sequence of Ni-Si-Cr 3wt% B brazing
alloys
Nathalie Siredey-Schwaller, Johann Hamel-Akré, Laurent Peltier, Alain
Hazotte, Philippe Bocher
To cite this version:
Nathalie Siredey-Schwaller, Johann Hamel-Akré, Laurent Peltier, Alain Hazotte, Philippe Bocher.
Solidification sequence of Ni-Si-Cr 3wt% B brazing alloys. Welding in the World, Springer, 2017, 61
(6), pp.1253-1265. �10.1007/s40194-017-0503-4�. �hal-01634498�
Science Arts & Métiers (SAM)
is an open access repository that collects the work of Arts et Métiers ParisTech
researchers and makes it freely available over the web where possible.
This is an author-deposited version published in: http://sam.ensam.eu
Handle ID: .http://hdl.handle.net/null
To cite this version :
Nathalie SIREDEY-SCHWALLER, Johann HAMEL-AKRÉ, Laurent PELTIER, Alain HAZOTTE, Philippe BOCHER - Solidification sequence of Ni-Si-Cr ~3wt% B brazing alloys - Welding in the World - Vol. 61, n°6, p.1253-1265 - 2017
Any correspondence concerning this service should be sent to the repository Administrator : [email protected]
Author's personal copy
Solidification sequence of Ni-Si-Cr ~3wt% B brazing alloys
N. Siredey-Schwaller1,2 & J. Hamel-Akré 3 & L. Peltier4 & A. Hazotte 1,2 & P. Bocher3
Received: 28 November 2016 / Accepted: 10 July 2017 / Published online: 9 August 2017
Abstract Various Ni-Si-Cr-B brazing alloys with a similar boron content (3 wt%) are investigated. Alloy compositions cover a section of the quaternary phase diagram that connects BNi-3 to BNi-9 ternary alloys for industrial use. Samples were melted and solidified at low cooling rate (1 K/min) under secondary vacuum to minimize oxidation and the metastable phase formation. Transformation temperatures, microstruc- tures, and chemical analyses are reported. Experimental con- ditions were found to play a significant role on the accuracy of obtained data. Thermodynamic data were collected upon heating. Before analyzing quaternary alloys, the results of in- vestigated ternary alloys were compared with the literature and discussed.
Keywords (IIW Thesaurus) TLP brazing . Ni-B-Si-Cr alloys . Solidification
1 Introduction
As indicated by Peaslee [1], brazing alloys containing Ni-Cr- Si-B are widely used for assembling high-temperature Ni- based components. The American Welding Society (AWS) A5.8 BNi-n specifications constitute the reference for these alloys [2]. They are known as BBNi-n alloys^ and may contain B, Si, Cr, Fe, or P as alloying elements. Industrial transient liquid phase (TLP) brazings are commonly performed with ternary Ni-Si-B fillers, whose compositions are close to that of BNi-3 (Table 1). In this alloy, Si and B act as melting point depressant elements, allowing the filler to melt at temperature below the base metal melting point prior to any major struc- tural changes. However, these alloys are very sensitive to re- sidual O2 content in the atmosphere during TLP. Ohsasa et al.
[3] mentioned that the ternary Ni-Cr-B fillers with a
Recommended for publication by Commission XVII - Brazing, Soldering and Diffusion Bonding
* N. Siredey-Schwaller [email protected] J. Hamel-Akré [email protected] L. Peltier [email protected] A. Hazotte [email protected] P. Bocher [email protected] 1
Laboratoire d’Étude des Microstructures et de Mécanique des Matériaux (LEM3), Université de Lorraine / CNRS, BP 15082, 7 rue Félix Savart, 57073 Metz, CEDEX 03, France
2
Laboratory of Excellence for Design of Alloy Metals for Low-mAss Structures (DAMAS), Université de Lorraine, Metz, France
3
École de Technologie Supérieure (ÉTS), Université du Québec, Montréal, Québec, Canada
4
École Nationale Supérieure des Arts et Métiers (ENSAM), Metz, France
Ni 81.39 84.78 86.71 88.25 89.17 92.11 suppressed the primary β2-Ni3Si domain, and enlarged Si 0 1.47 2.04 2.98 3.37 4.65 the γ-Ni5Si2 domain, rejecting Tokunaga’s propositions. Cr 14.66 10.03 7.75 5.28 4.02 0 The calculated phase diagram ends up being much
clos-Fe 0.09 0.09 0.08 0.09 0.09 0.09 er to the experimental results of Omori et al. and
B 3.64 3.43 3.22 3.22 3.16 2.98 Lebaili and Hamar-Thibault. For compositions close to
Residual elements 0.22 0.2 0.2 0.18 0.19 0.17 BNi-3 ternary alloys, they suggest that the probable
so-Mass Si/Cr ratio 0 0.146 0.263 0.563 0.839 ∞ lidification reaction path is L ➔ primary α ➔ α + Ni3B
➔ α + Ni3B + δ-Ni6Si2B in equilibrium conditions, or Table 1 Composition in mass% of the various alloys
BNi-9 M15 M26 M56 M84 BNi-3
Thibault [10], and Tokunaga [11]. Reviewing these data, Lebrun et al. have considerably reduced the domain of primary β3-Ni3Si into the equilibrium phase diagram,
Name of the alloy refers to the Si/Cr mass ratio
composition close to that of BNi-9 (Table 1) have been sought as an alternative for industrial brazing, as the addition of Cr prevents oxidation.
Using chromium addition, a higher corrosion resistance of the brazing joint can be obtained. The downside is an increase of the filler melting temperature, affecting microstructures in the base metal and its mechanical properties. A trade-off has been found by using quaternary Ni-Cr-Si-B fillers or even higher order alloys (with Fe). The usual amount of boron in these alloys remained around 3 wt%. These conventional al- loys led to improved joint properties while brazing various types of nickel-based superalloys. However, brittle chromium borides can precipitate under specific operating conditions. Aluru et al. [4] studied brazing of nickel-based superalloys with various brazing alloys including BNi-3. They noted the lack of β1-Ni3Si precipitation in the Ni-solid solution α phase
which could also be held responsible for the poor mechanical properties in the brazed zone.
In order to control process parameters and microstructures of TLP nickel-based alloys brazes, it appears necessary to increase the knowledge of the thermodynamic equilibrium and solidifi- cation sequences of filler alloys themselves. Specifically, the formation of chromium borides has to be better understood, given their influence on the melting temperatures of the filler and on final braze microstructures. Ruiz-Vargas et al. [5] point- ed out discrepancies between the thermodynamic modeling predictions using CALPHAD databases and the observed be- havior while brazing. It was, however, not clear whether dis- crepancies were due to poor thermodynamic data or to kinetic effects related to undercooling, leading to solidification condi- tions out of equilibrium practice.
Schuster and Du [6] extensively studied the Ni-Si-Cr phase diagram, providing data for CALPHAD modeling. Lebrun et al. [7] recently reviewed experimental and modeling data on the Ni-Si-B system. Concerning the liquidus surfaces and invariant reactions in the nickel- rich corner, these authors report numerous controversies and discrepancies among experimental results, in partic- ular calculated liquidus surfaces reported by Omori et al. [8], Jansson and Agren [9], Lebaili and
Hamar-L ➔ primary α ➔ α + Ni3B ➔ α+ Ni3B + β3-Ni3Si in
metastable conditions. Bondar [12] extensively reviewed the Ni-Cr-B ternary system. They proposed rejection of the liquidus surfaces calculated by Campbell et al. [13], which strongly disagree with the experimental data by Lugscheider et al. [14] and Omori et al. [15] in the nickel-rich corner. Concerning BNi-9 ternary alloys, Bondar [12] suggests the following solidification path at equilibrium: L ➔ primary α ➔ α + (Ni,Cr)3B ➔ α
+ (Ni,Cr)3B + CrB. Ohsasa et al. [3] studied transient
liquid phase (TLP) brazing of pure Ni with a filler composition close to that of BNi-9 (15.2 wt% Cr, 4 wt% B, versus 14.66 wt% Cr, 3.64 wt% B for BNi-9). Because of the TLP brazing process, the liquid remaining at the end of the solidification was depleted in B and slightly depleted in Cr. They found the same solidification sequence: primary α ➔ α + (Ni,Cr)3B ➔
α + (Ni,Cr)3B + CrB.
The present work dealt with providing original and valuable thermodynamic data on Ni-Si-Cr-B filler al- loys, in order to better understand and model the solid- ification sequences of Ni-Si-Cr-B brazing alloys. BNi-3 and BNi-9 were firstly investigated through slow differ- ential thermal analyzer (DTA) experiments, microstruc- ture observations, and chemical analyses. Results were compared with literature data, in particular, to evaluate their accuracy. Then different Ni-Si-Cr-B alloys were made by mixing the ternary alloys in various propor- tions (Table 1). As the amount of B varies only slightly in these two alloys, the level of B of in all mixtures was kept about constant, around 3 wt%. Microstructures and melting temperature variations as the Si/Cr ratio increases were documented and discussed.
2 Materials and methods
2.1 Materials and sample elaboration
Powders of the two ternary alloys BNi-3 and BNi-9 with cer- tified composition were provided by the Chpolansky compa- ny, with particle sizes ranging from 50 to 100 μm. These
Author's personal copy
x ð Þ T h e rm a l fl u x ( m W /m g ) T h e rm a l fl u x ( m W /m g )powders were mixed in different proportions, then homoge- nized for 24 h in a TURBULA® in order to prepare four Ni- Si-Cr-B alloys with near-constant boron amount (ranging from 2.98 to 3.64 mass%) and various Si/Cr ratios. Mass compositions of all alloys studied in the present work are given in Table 1. Note that the M26 alloy was prepared from variants of the BNi-3 and BNi-9 alloys, which means that its composition is only approximately a linear combination of the BNi-3 and BNi-9 alloys listed in Table 1.
Samples were melted and homogenized at 1150 °C (1423 K) for 3600 s in an alumina crucible under secondary vacuum conditions (10−2 Pa) to reduce oxidation. Heating rate was set to 10 K/min, whereas cooling rates were kept as low as 1 K/min. Ternary alloys were prepared in large cylindrical crucibles, 10 mm in diameter and about 5 mm in width. Bulk quaternary alloy samples were prepared in smaller quan- tities, directly in DTA crucibles. Differential weight losses were measured to be less than 2‰, suggesting that the alloy composition is not affected by the melting process. For each quaternary mixture, two samples were prepared from the pow- ders. One sample was used for metallographic observation, while transformation temperatures were recorded on the sec- ond sample, using a NETZSCH-Gerätebau GmbH DSC 404 equipment, which was used as a DTA.
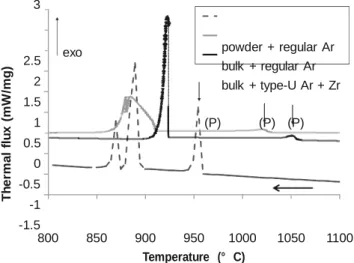
Preliminary experiments pointed out that microstruc- tures, phase fractions, and especially transformation tem- peratures were sensitive to the presence of residual oxygen in the melting atmospheres. As an example, Fig. 1 presents the cooling curves and the related transformation tempera- tures during solidification of BNi-3 alloy melted in the DTA furnace in three different atmospheric conditions. As the O2 amount in the atmosphere increases, transforma-
tion peaks shift towards lower values (these peaks are la- beled (P) in Fig. 1). Shifting reached up to 100 °C for the
3
formation of the primary phase, suggesting that the sample behavior during solidification may be affected by oxygen contamination into the melted metal. As a consequence, DTA analyses had to be performed under a flow of argon containing less than 100 ppb amount of O2 (BU type^). In
addition, a block of zirconium was inserted in the DTA furnace to serve as an oxygen getter. Further oxygen re- duction was obtained by melting powders into bulk sam- ples under secondary vacuum conditions.
2.2 DTA and microstructure characterization
DTA experiments were performed with a heating rate of 5 K/ min up to 1150 °C (1423 K), a 900 s isothermal step at 1150 °C, then a 10 K/min cooling down to ambient tempera- ture. Temperatures were estimated accurately only on heating curves, following a procedure described by Tokunaga et al. [11]. An example of transformation temperature record is il- lustrated in Fig. 2. Cooling curves are relevant to detect the successive reactions during solidification, which are well sep- arated and can be easily distinguished. However, these reac- tions do not appear at the equilibrium temperature. Thus, cooling curves were only used for qualitative analysis.
For metallographic observation, samples were etched in Kalling’s reagent (160 ml ethanol, 100 ml HCl, 5 g CuCl2)
for about 5 s. Quantitative characterization of phase amounts was performed by point counting method, using a light micro- scope Olympus™ BX61 assisted by the Analysis™ software. On 15 zones of about 0.06 mm2 (56,000 μm2), 140 points grids were analyzed for a total of n = 1200 analysis points. The volume fraction f of a phase is given with a 95% confi- dence range σf according to the formula
σ f ¼ 2 x
pffi
fffiffiffiffiffiffiffiffiffiffi1ffiffi−ffiffiffiffifffiffiffiffi=ffiffinffiffi
Images at higher magnification were obtained with a
scan-2.5 2 1.5 1 0.5 0
exo powder + regular Ar
bulk + regular Ar bulk + type-U Ar + Zr (P) (P) (P)
ning electron microscope (SEM) equipped with a field emission
0.1 0 -0.1 Solidus -0.2 -0.5 -1 -1.5 800 850 900 950 1000 1050 1100 Temperature (° C) -0.3 -0.4 -0.5 -0.6 exo Peak 1 Thermal event Liquidus
Fig. 1 DTA cooling curves of BNi-3 alloy obtained at 10 K/min after a melting step at 1150 °C under three different atmospheres: as-received powder sample in regular Argon (dotted line), bulk samples (prepared in a secondary-vacuum furnace) in regular argon (grey line), and bulk sample in type-U Argon (black line). Peaks (P) correspond to primary solidifica- tion (α dendrites)
900 920 940 960 980 1000 1020 1040 1060 1080 1100
Temperature (° C)
Fig. 2 Typical DTA heating curve showing the discontinuities allowing the determination of the main transformation temperatures (Solidus, Peak 1, and Liquidus). Present curve is M84 alloy curve with a heating rate of 5 K/min
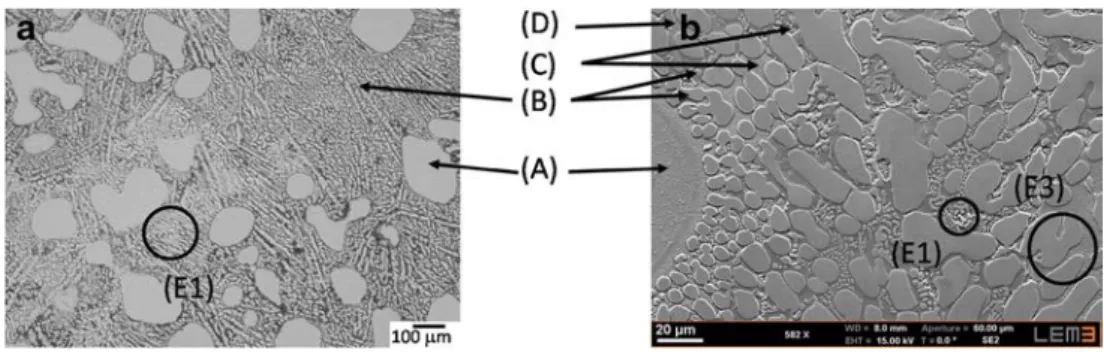
Fig. 3 BNi-3 alloy. Optical micrograph (a). SEM micrograph (b). Observed phases are (A) α Ni-solution dendrites; (B) Ni3B
borides; (C) α phase formed dur- ing eutectic solidification, which contains β1-Ni3Si precipitates;
and (D) nickel silicides. Eutectics are (E1) α + nickel borides + nickel silicides and (E3) α + nickel borides
electron gun (Zeiss™ Supra 40), which was used in secondary electrons (SE) observation mode and under a 15-kVacceleration voltage. For phases that were hard to distinguish in optical micrography, volume fraction measurements were performed from chemical mappings, on at least 10 zones separated by a distance of 0.5 mm each and corresponding to a total area of more than 0.6 mm2.
The chemical compositions of the different phases were an- alyzed by energy-dispersive X-ray spectroscopy (EDX) with an SDD detector, using the Bruker™ QUANTAX system and the SPIRIT1.9™ software. At least 15 spectra were recorded for each phase. They were analyzed according to the method de- scribed by Ruiz-Vargas et al. [16]. It was estimated that this method allows to get boron concentration with an error of less than ±5 at.% in nickel-rich alloys.
3 Results—ternary alloys
3.1 Ni-Si-B alloy BNi-3
The microstructure resulting from melting at 1150 °C then cooling at 1 K/min under secondary vacuum is presented in
Fig. 3a, b. Large dendrites of α-Ni solid solution for a total volume amount of 18%, and labeled (A), can be observed in Fig. 3a. No precipitate has been found inside them. Regarding their shape and size, it is clear that these α dendrites were first to solidify. Composition measurements reveal that this initial α phase is slightly enriched in silicon compared to the nomi- nal composition of the alloy: 9.4 versus 8.2 at.%. The two- phase eutectic mixture (E3) identified in Fig. 3a, b consists in α-Ni solid solution phase (C) and nickel borides (B). In the former, fine β1-Ni3Si precipitates are evident, which are likely
formed by solid-state transformation due to Si supersaturation. Under measurement uncertainties, composition of nickel bo- rides corresponds to Ni3B. Three size classes of nickel borides
were observed. Elongated nickel borides are visible even in the optical images at low magnification, e.g., Fig. 3a. In Fig.
3b, a medium size class (5–50 μm) of spheroidal nickel bo- rides is revealed, as well as small borides (1.5–5 μm) in the smallest size class. Chemical analyses revealed that the invari- ant final mixture (E1) was formed by β3-Ni3Si nickel silicide
(D), very small size nickel borides, and α.
Composition and phase fractions of the various phases are given in Table 2. To calculate mass fractions, for comparison with Thermo-Calc® simulations, densities were taken from
Table 2 Composition (at.%), volume, and mass fraction (%) of the different phases in BNi-3
Composition (at.%) B Si Volume fraction Mass fraction
Thermo-Calc® with the TTNi7
database mass fraction (Fig. 7)
Nominal BNi-3 compo- sition
13.7 8.23
α dendrites 0 9.4 ± 0.3 18 ± 2 19 ± 2 5.5
Other α phase 0 18 ± 2 n/a n/a 18.8
Nickel boride 18 ± 5 0 60 ± 4 58 ± 4 56.7
Including small size borides
3.5 ± 1 3.4 ± 1 16.6
Final nickel silicide 0 22 ± 1.5 n/a n/a 19
Amount of final nickel silicide has not been determined due to excessive difficulty in bringing out the phase either on optical micrographs and on chemical mappings for quantitative statistical measurement
n/a not available
Normal script refers to experimental results found in this study. Italic script refers to calculated results obtained from TTNi7 and ThermoCalc simulation. The calculated results are put in the table for sake of comparison
T h e m a l fl u x ( m W /m g ) 3 2.5 2 1.5 1 exo (A c) (Bc) Heating v=5 K/min Cooling v=10 K/min
1 K/min is shown in Fig. 5a, b. As for the BNi-3 alloy, the solidification starts with α-Ni solid solution phase with a dendritic morphology (A). A two-phase α + nickel boride mixture (E3) was also observed, as well as a com- plex eutectic (E2) with α, nickel borides and chromium borides labeled (E). Compositions and phase fractions of
0.5 0 -0.5
(Ah) (Bh) Liquidus the various constituents are listed in Table 3.
Results reveal that the initial α phase is enriched in chromium compared to the nominal composition of the
900 920 940 960 980 1000 1020 1040 1060 1080 1100
Temperature (°C)
Fig. 4 DTA curves of BNi-3 alloy. Event (A) was attributed to the melt- ing of three-phase mixture (E1) α + Ni3B + β3-Ni3Si. Event (B) is attrib-
uted to the melting of two-phase α + Ni3B eutectic (E3). Indexes refer to
heating (h) and cooling (c)
Ruiz-Vargas [5] as 8.2 g/cm3 for nickel boride and 8.9 g/cm3 for the other phases. Chemical analyses revealed residual amounts of oxygen, up to roughly 8 at.%, in the eutectic α phase and the final nickel silicide phase, confirming that this alloy is very sensitive to contamination, even in secondary vacuum conditions.
DTA curves presented on Fig. 4 show that three events took place during heating. These transitions are more clearly visible on cooling curves. However, for the multiphase transforma- tions, undercooling offsets up to more than 70 °C were observed.
Combining DTA results with microstructural observations, it is possible to devise a solidification sequence as follows: solidification started with formation of primary α phase at 1059 °C, followed by a path in the two-phase eutectic valley with simultaneous solidification of the (E3) nickel boride Ni3B and α phase mixture. Invariant reaction may have taken
place as the liquid transformed to (E1) α + Ni3B + β3-Ni3Si
mixture at 992 °C.
3.2 Ni-Cr-B alloy BNi-9
The microstructure found in the BNi-9 alloy solidified from 1150 °C under secondary vacuum conditions at
alloy: 21.4 versus 14.05 at.%. The two-phase eutectic (E3) comprising α phase and nickel borides was present as a lamellar structure which spreads from the crystallite center, forming quasi-spherical shaped grains, as shown in Fig. 5b. Dendrite arms may serve as nucleation site for the crystallization of such grains. The nickel borides contain some chromium and are of (Ni,Cr)3B type.
Three-phase eutectic (E2) corresponds to the final solid- ification product. It is composed of α phase, (Ni,Cr)3B
and chromium borides of CrB type. As presented in Fig. 5b, the CrB phase shape is granular or needle shaped. The needles may cross either the α phase or the nickel borides, suggesting that further chromium bo- ride precipitation took place in the solid state, i.e., after final solidification.
The DTA curves in Fig. 6 show at least three events occurring during heating, The first event, labeled (Ah) and
beginning at 1053 °C, corresponds to the melting of the three-phase mixture (E2) α + (Ni,Cr)3B + CrB. At
1059 °C, a slope change, labeled (Bh) can be related to
the melting of the two-phase (E3) α + (Ni,Cr)3B eutectic.
Liquidus temperature was reached at 1087.5 °C. These events are clearly visible on the cooling curves but showed large undercoolings when compared to heating curves.
3.3 Discussion about ternary alloys
From literature review, it should be noticed that little consen- sus exists about temperatures and the solidification sequence of these two ternary alloys.
Fig. 5 BNi-9 alloy. Optical micrograph (a). SEM micrograph (b). Observed phases are (A) α Ni-solution dendrites, (B) (Ni,Cr)3B borides, (C) α phase
formed during eutectic solidifica- tion, and (E) CrB borides. Eutectics are (E2) α + nickel borides + CrB borides and (E3) α + nickel borides
Author's personal copy
T h e rm a l fl u x ( m W /m g ) M as s f rac ti o nTable 3 Composition (at.%), volume, and mass fraction (%) of the different phases in BNi-9
Composition (at.%)
Ni B Cr
Volume Mass Thermo-Calc® with the fraction fraction TTNi7 database mass
fraction (Fig. 8) Nominal BNi-9 composition α dendrites base 16.78 base 0 14.05 21.4 ± 0.4 9.2 ± 1 9.8 ± 1 57 Other α phase base 0 20.4 ± 0.7 37.8 ± 6 45.4 ± 6 Nickel borides base 25.5 ± 5 8.2 ± 0.6 46.5 ± 2 40.1 ± 2 21.3 Chromium
borides
1.5 ± 1 53 ± 5 45.5 ± 1.3 6.5 ± 3 4.7 ± 3 21.7
The other α phase fraction was measured by difference
Normal script refers to experimental results found in this study. Italic script refers to calculated results obtained from TTNi7 and ThermoCalc simulation. The calculated results are put in the table for sake of comparison
3.3.1 BNi-3 alloy
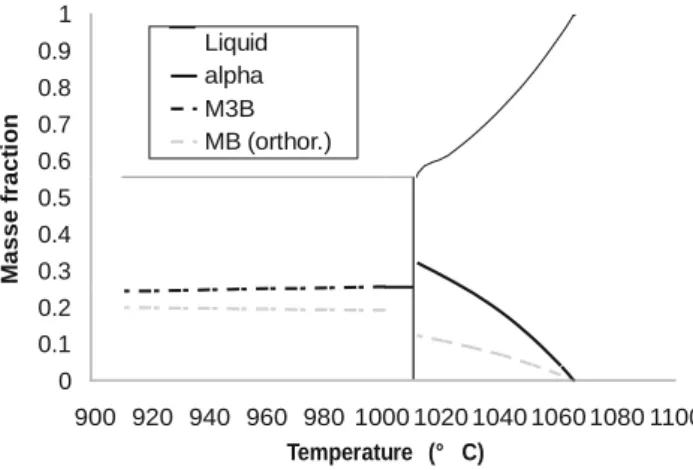
According to Lebrun et al. [7], the controversies regarding alloys of compositions close to BNi-3 were satisfactorily settled. The equilibrium sequence calculated with Thermo-Calc® using the TTNi7 database, as presented in Fig. 7 and Table 2, predicts that the phase forming at the invariant point will be the metastable β3-Ni3Si phase.
Table 4 summarizes the experimentally observed or cal- culated solidifications temperatures found in literature. The terminal invariant equilibrium point is L + α+ Ni3B
+ δ-Ni6S2B. The metastable equilibrium corresponds to
the point L + α+ Ni3B + β3-Ni3Si. Very close to the
invariant terminal eutectic equilibrium in the Ni-Si-B phase diagram, Lebailli and Hamar-Thibault [10] pointed out the existence of a four-phase peritectic equilibrium L + γ-Ni5Si2 ➔ α + δ-Ni6Si2B.
Experimental BNi-3 solidification sequences depicted in the present paper are in good agreement with reported experimental data and solidification sequences. Slight dif- ferences in the liquidus temperatures among previously
1.5
reported and present data can be explained by composi- tional differences. The decomposition of the α solid solu- tion in eutectic mixtures with formation of β1-Ni3Si of
characteristic shapes agrees with findings of Lebaili and Hamar-Thibault [10]. The reported δ-Ni6Si2B was not ob-
served in the terminal mixture of the present samples but a nickel silicide phase with composition closer to β3-
Ni3Si. The terminal point measured here is thus likely to
be the invariant point reported by Omori et al. [8] and considered to be metastable by Jansson et al. [9].
Mass fraction of primary α solid was 19 ± 2% in the pres- ent experiments whereas, according to the Thermo-Calc® cal- culation presented in Fig. 7, less than 6% was expected. Most likely, this discrepancy cannot be explained by some undercooling effect. Another sample, elaborated from the same BNi-3 powder and solidified at a rate of 10 K/min, shows an α pro-eutectic fraction equal to 14 ± 2%. The full Ni3B weight fraction observed at room temperature agreed
well with Thermo-Calc® calculation. However Thermo- Calc® calculated that 60% would form at the invariant tem- perature, which completely disagrees with the observations, as most of the observed borides are rather coarse and, thus, likely formed at higher temperatures.
1 0.5 0 -0.5 -1 -1.5 exo Heating v=5 K/min Cooling v=10 K/min (Ac) (Ah) (Bh) (Bc) Liquidus 1 0.9 0.8 0.7 0.6 0.5 0.4 0.3 0.2 liquid alpha Ni3B Ni3Si 900 920 940 960 980 1000 1020 1040 1060 1080 1100 Temperature (°C)
Fig. 6 DTA curves of BNi-9 alloy. Event (A) was attributed to the for- mation of a three-phase mixture (E2) α + (Ni,Cr)3B + CrB. Event (B) was
attributed to the formation of two-phase (E2) α + (Ni,Cr)3B eutectic.
Indexes refer to heating (h) or cooling (c)
0.1 0
900 920 940 960 980 1000 1020 1040 1060 1080 1100
Temperature (° C)
Fig. 7 BNi-3 alloy. Mass phase fraction versus temperature, calculated at equilibrium by Thermo-Calc®, with the TTNi7 database
M ass e f rac ti o n Table 4 Transformation
temperatures (°C) of BNi-3 ac- Our Omori Jansson and Lebaili and Hamar- Thermo-Calc® with the cording to literature experiments et al. [8] Agren [9] Thibault [10] TTNi7 database
Liquidus 1059 Solidus 992b T ≤ 1050 993b ≈1062 998a 1050 < T < 1100 985a 1085 988b
a Stable invariant point L + α + Ni
3B + δ-Ni6S2B b Metastable invariant point L + α + Ni
3B + β3-Ni3Si
3.3.2 BNi-9 alloy
According to Thermo-Calc® calculations with the TTNI7 da- tabase reported in Fig. 8 and Table 5, solidification at equilib- rium starts with a CrB + α mixture and ends with the three- phase eutectic CrB + α + (Ni,Cr)3B. This sequence is not the
one expected from Lugscheider et al. [14], Omori [15], and Bondar [12], leading to controversies. An agreement is found for the liquidus temperature of BNi-9 (formation of the prima- ry α phase) at a value lower than 1127 °C, as presented in Table 5. Lugscheider et al., Omori, and Bondar all agree that the three-phase eutectic α+ (Ni,Cr)3B + CrB forms at
1050 °C, whereas a TTNi7-Thermo-Calc® calculation yields 1011 °C as the terminal eutectic temperature, and Ohsasa et al. [3] found it at 997 °C.
form of dendrites. Then, a two-phase eutectic reaction occurs: L ➔ α + (Ni,Cr)3B. Solidification ends at the terminal invariant
point: L ➔ α + (Ni,Cr)3B + CrB. The measured temperature of
this point agrees well with value found by Omori et al. [15]. Liquidus surfaces calculated by Bondar as well as experimental results of Omori et al. agree with our results to a large extent.
From the results on ternary alloys, it can be concluded that, in the present methodology, the cooling rate was adequate and vacuum quality was good enough to ensure that the solidifi- cation processes can be considered to be at thermodynamic equilibrium. Quaternary alloys will now be analyzed using the same procedures and keeping in mind the existence of undercooling effects following the primary phase crystalliza- tion and the possible occurrence of metastable reactions in later stage solidification of silicon rich alloys.
1 0.9 0.8 0.7 0.6 0.5 0.4 0.3 0.2 0.1 0 Liquid alpha M3B MB (orthor.)
900 920 940 960 980 1000 1020 1040 1060 1080 1100 Temperature (° C)
4 Results—quaternary Ni-Cr-Si-B alloys
4.1 Solidification sequences and reactions 4.1.1 M15 alloy
Microstructure as well as DTA curves for the M15 sample differed from the other quaternary alloys and will be treated separately. Its microstructure is presented in Fig. 9a, b. On a low-magnification micrograph of Fig. 9a and because of the chosen etchant, it was not possible to distinguish chromium borides. On the SEM micrograph of Fig. 9b, it is possible to
Fig. 8 BNi-9 alloy. Mass phase fraction versus temperature, calculated at equilibrium from Thermo-Calc® and the TTNi7 database
The observed solidification path depicted in the present paper closely followed the one proposed by Bondar [12] and Ohsasa et al. [3]. The primary phase is an α Ni-rich solid solution in the
observe α dendrites, some two-phase eutectic α + (Ni,Cr)3B,
and some CrB borides. The latter have been detected embed- ded in the two-phase eutectic α + (Ni,Cr)3B. These chromium
borides are likely to be formed during the reaction L ➔ α + (Ni,Cr)3B + CrB, i.e., similar to the terminal eutectic (E2) in
BNi-9. No β1-Ni3Si precipitates resulting from the solid-state
transformation could be detected in the α phase.
Table 5 Transformation
temperatures (°C) of BNi-9 ac- Our experiments Omori et al. [15] Bondar [12] Thermo-Calc® with the TTNi7 database cording to literature
Liquidus 1087.5 <1127 <1127 1060–1064
Author's personal copy
Fig. 9 M15 alloy. Opticalmicrograph (a). SEM micrograph (b). Observed phases are (A) α Ni-solution dendrites; (B) (Ni,Cr)3B borides; (C) α phase
formed during eutectic solidification, which does not contain β1-Ni3Si precipitates; and
(E) CrB borides
The DTA heating curve presented in Fig. 10c has a similar shape to that of BNi-9 alloy. The observed slight departure from baseline at 1026 °C was attributed to the melting of a three- phase eutectic mixture (E2) α + (Ni,Cr)3B + CrB. A slope
change was then observed at 1045 °C and is attributed to the melting of two-phase eutectic (E3) α + (Ni,Cr)3B. The pro-
eutectic α phase melting peak was easier to place at 1074 °C.
4.1.2 M26 alloy
The M26 alloy presents another phase that does not appear in the M15 alloy: nickel silicides with composition β3-Ni3Si. As
presented in Fig. 11a, large α dendrites and some two-phase (E3) eutectic α + (Ni,Cr)3B were found in the microstructure.
As their volume fraction is low, nickel silicides cannot be seen on the optical micrographs. Only SEM images, such as Fig.
11b, were able to provide information on all the existing phases. SEM micrograph reveals the existence of nickel sili- cides and chromium borides in the alloy. The latter were found associated with nickel silicides. From this microstructure, the existence of the three-phase eutectic (E1) α + (Ni,Cr)3B + β3-
Ni3Si can be deduced. A four-phase mixture (E4) α +
(Ni,Cr)3B + β3-Ni3Si + CrB also exists, as presented in Fig.
12. While α dendrites do not include β1-Ni3Si solid-state
precipitates, eutectic α phase may contain some.
The DTA heating curve (Fig. 10b) shows melting of the various mixtures. Since the volume fraction of the terminal mixture is low, the corresponding peak on DTA curve is weak, and the melting temperature is given with large uncertainty, at 940 °C. The peak corresponding to the three-phase eutectic has a same similar shape than that found in M56 and M84 alloys and can be well defined, starting at 975 °C. The initial temperature for melting of two-phase eutectic is more subject to discussion, especially because of the uncertainty about baseline definition and is proposed to be at 1022 °C. The liquidus stands at 1063 °C. As already mentioned, which can be seen in Table 1, the amount of boron for this alloy does not follow the same linear combination of BNi-3 and BNi-9 powders as for the other alloys. As it is known that melting temperature is strongly dependent on the boron content, the
M26 liquidus temperature will not be discussed together with those of the other alloys.
4.1.3 Other quaternary alloys: M56 and M84 alloys
M56 and M84 samples have a more complex but otherwise similar microstructure. As presented on Figs. 13a, b and 14a, b, large α dendrites without β1-Ni3Si precipitates, a two-phase
α + nickel boride (E3) mixture, and a three-phase or maybe a four-phase mixture (E1) α + nickel boride + nickel silicide(s) were found in the microstructure: the latter were hard to dis- tinguish on optical micrographs, appearing as colored (blue, green, or yellow) phase(s).
Within α dendrites, nickel borides needles were observed in both alloys. The shape of these nickel borides suggests that they formed within the already solidified dendrites. The two- phase eutectic (E3) α + (Ni,Cr)3B may be found as a combi-
nation of a lamellar and quasi-divorced rod-like eutectics. The latter eutectics form quasi-spherical grain structures as shown in Figs. 13b and 14b. The interlamellar spacing increases from the center to the periphery, probably due to the increasing role played by short circuit diffusion in the liquid as temperature decreases during solidification. Low fractions of the four- phase mixture, detailed in Fig. 15, were found in both alloys surrounding the two-phase eutectic grains. Together with α phase and nickel borides, two nickel silicides, without B, can be reported. Cr amount is measured less than 0.6 at.%. One of the silicides has a 26 ± 1 at.% Si content, whereas the other only has 23 ± 1 at.%. Residual oxygen was detected in these phases, leading to uncertainties in determining exact compositions. These phases could correspond to γ-Ni5Si2
and to β3-Ni3Si phases, respectively. The morphology of this
mixture suggests that the reaction could occur on β3, probably
inherited from the three-phase metastable eutectic: L ➔ α+ (Ni,Cr)3B + β3-Ni3Si, where metastable β3 is substituted for
δ-Ni6Si2B or γ-Ni5Si2. β3 will subsequently partially trans-
form into γ-Ni5Si2.
As presented in Fig. 10a, the DTA curves of M56 and M84 alloys were quite similar. At least three thermal major events can be distinguished.
Fig. 10 Five Kelvin per minute DTA heating curve of (a) BNi-3, M56, and M84 alloys; (b) M26 alloy; and (c) BNi-9 and Cr-rich M15 alloys. The (E1) point is attributed to the melting of the eutectic α + nickel borides + nickel silicides, (E2) point to the melting of the eutectic α + nickel borides + CrB borides, (E3) point to the start of the melting of the two-phase eutectic α + nickel borides, and (E4) point to the melting of the four-phase eutectic α + nickel borides + nickel silicide + CrB borides
4.2 Microstructural and thermal trends
Volume fractions of the various phases and mixture, transfor- mation temperatures, and compositions are summarized as follows and analyzed in order to link better the new results displayed previously.
4.2.1 Volume fractions of phases
Volume fractions of the various phases and mixture are sum- marized in Table 6. The fraction of the pro-eutectic α dendritic primary phase decreases as the Si/Cr ratio increases in quater- nary alloys. However, the pro-eutectic α fractions in two ter- nary alloys do not follow the same trend. Nickel boride vol- ume fractions for quaternary alloy are similar if one considers the magnitude of sampling uncertainties.
4.2.2 Transformation temperatures
Similarly, the transformation temperatures measured from heating curves are reported in Table 7.
4.2.3 Phase compositions
The compositions of the pro-eutectic dendritic α phase are displayed in Table 8. It can be pointed out that this phase is enriched in Si and Cr above the overall composition of the alloy. Partition ratios ki corresponding to the ratio between
solidus composition csi and liquidus composition cli are found
to be kCr = 1.71 ± 0.11 and kSi = 1.32 ± 0.15.
Keeping in mind that a linear variation on boron amount exists within the alloys (except the M26 alloy), the pseudo- liquidus curve on the section at 3 wt% B can be deduced. In these alloys, a solidus curve for the formation of the α phase, deduced from experimental data presented on Table 8, can be well modeled by a simple linear regression:
T s ¼ 1108−0:9579 x ðat:%Crα Þ−5:2127 x ðat:%Siα Þ;
where Ts is the temperature in degrees celsius and at.%Crα
and at.%Siα are the pro-eutectic α compositions in atomic percents.
To take into account the small variations in boron content existing in the studied alloys and the relationship existing between compositions of the pro-eutectic α phase and nomi- nal alloy compositions, liquidus curve is tentatively modeled by the following relationship:
T l ¼ 1455−0:04189 x ðat:%CrÞ2−0:86064 x ðat:%CrÞ
þ 0:02304 x ðat:%SiÞ2−6:1285 x ðat:%SiÞ þ 1:5125 x ðat:%BÞ2−46:0558 x ðat:%BÞ−0:12 x ðat:%CrÞ x ðat:%SiÞ:
Tl is the liquidus temperature (°C), and at.%Si, at.%Cr, and
at.%B are the nominal compositions in atomic percents. Two-phase eutectic α + (Ni,Cr)3B When liquid composition
Author's personal copy
Fig. 11 M26 alloy. Optical micrograph (a). SEM micrograph (b). Observed phases are (A) α Ni-solution dendrites; (B) (Ni,Cr)3B borides;
(C) α phase formed during eutectic solidification, which may contains
β1-Ni3Si precipitates; (D) nickel silicides; and (E) CrB borides. Eutectics
are (E1) α + nickel borides + nickel silicides, (E3) α + nickel borides, and (E4) α + nickel borides + nickel silicides + CrB borides
Fig. 12 Detail of the M26 microstructure showing the final four-phase mixture
stops and the two-phase eutectic (Ni,Cr)3B/α can form. The
compositions of each phase constituting this eutectic are re- ported as follows.
• α phase
During the eutectic reaction, the composition of the solid formed is controlled by the eutectic valley position and chang- es as the temperature evolves. BNi-3 alloy as well as quater- nary alloys exhibit strong variation of α phase composition in term of silicon and chromium contents (the latter for quater- nary alloys). Variations as large as 5 at.% were reported for either Cr or Si. On the other hand, the α phase composition of the eutectic found in BNi-9 varies very little and remains close to the Cr amount found in α dendrites. As a general comment,
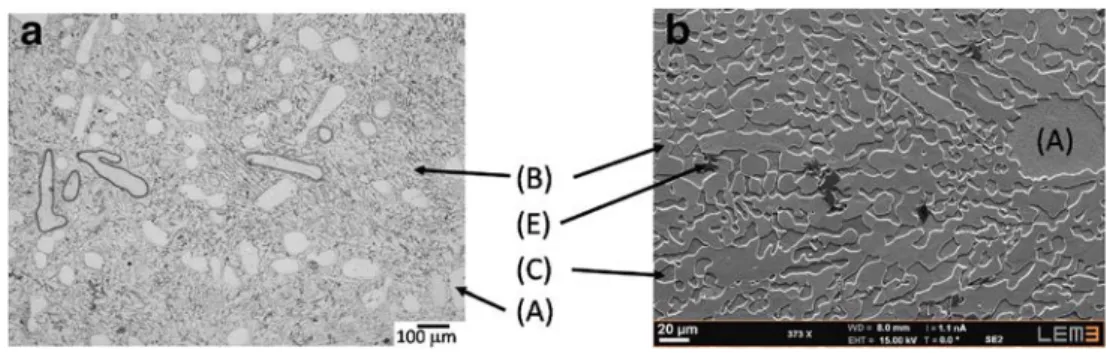
Fig. 13 M56 alloy. Optical micrograph (a). SEM micrograph (b). Observed phases are (A) α Ni-solution dendrites; (B) (Ni,Cr)3B borides; (C) α phase
formed during eutectic solidifica- tion, which contains β1-Ni3Si
precipitates; and (D) nickel sili- cides. Eutectics are (E1) α + nickel borides + nickel silicides and (E3) α + nickel borides
Fig. 14 M84 alloy. Optical micrograph (a). SEM micrograph (b). Observed phases are (A) α Ni-solution dendrites; (B) (Ni,Cr)3B borides; (C) α phase
formed during eutectic solidifica- tion, which contains β1-Ni3Si
precipitates; and (D) nickel sili- cides. Eutectics are (E1) α + nickel borides + nickel silicides and (E3) α + nickel borides
Fig. 15 Detail of the M84 microstructure showing the final four-phase mixture. Chemical analysis tends to indicate that the Si-rich phase (1) is closest to the β3-Ni3Si and Si-rich phase (2) closest to γ-Ni5Si2
whether it forms dendrites or is embedded in the eutectic mix- ture, α contains no boron and is always enriched in Si and Cr above the overall composition of the alloy.
• Nickel boride phase
Even when accounting for wider confidence ranges in measuring boron content, all nickel boride were found to be of the (Ni,Cr)3B type. For a given alloy, no significant
variation in chromium content was found in the composi- tion of either the two-phase or the three-phase eutectic
Table 6 Volume fraction of the
different phases measured from BNi-9 M15 M26 M56 M84 BNi-3
image analysis
Si/Cr atomic ratio 0 0.271 0.487 1.043 1.551 ∞
Volume fraction (%) α Dendritic primary 9.2 ± 1 19.8 ± 3 14.1 ± 1.5 9.2 ± 2 4.3 ± 1 18 ± 2 In eutectics 37.8 ± 6 22.8 ± 3 27.6 ± 5 34.2 ± 2 33.4 ± 2 n/a Total 47.0 ± 7 42.6 ± 6 41.7 ± 7.5 43.4 ± 4 37.7 ± 3 n/a Nickel boride 46.5 ± 2 52.6 ± 3 54.8 ± 1.5 50.8 ± 2 55.7 ± 2 60 ± 4 Chromium boride 6.5 ± 3 4.8 ± 3 0.5 0 0 0
Final nickel silicide 0 0 3 ± 2 5.5 ± 2 6.6 ± 1 n/a
In BNi-3, nickel silicide in the final solidification reaction volume fraction cannot be measured (n/a). Solid-state precipitation of β1-Ni3Si occurring in α phase found in eutectic grains was not taken into account in the volume
fraction count of Ni3Si
Table 7 Transformation
temperatures (°C) extracted from BNi-9 M15 M26 M56 M84 BNi-3
DTA heating curves
Liquidus 1087.5 1074 1062.9 1064 1061.8 1059
(α dendrites)
Melting of the (E3) two-phase eutectic 1059 1045 1022 n/a n/a 1025
(E2) Eutectic 1053 1026 – – – –
(E1) Eutectic – – 975 982 980 992
(E4) Eutectic – – 940 – – –
Temperature of melting start of (E3) the two-phase eutectic cannot be measured from heating curves for M56 and M84 alloys. Please note that in the M26 alloy, boron amount does not follow the same variation than in the other alloys. As (E4) volume fraction is low, (E4) peak is weak and (E4) temperature is not well defined
Table 8 Composition of α
dendrites and related liquidus BNi-9 M15 M26 M56 M84 BNi-3
temperatures
Si/Cr atomic ratio 0 0.271 0.487 1.043 1.551 ∞
Nominal Cr (at.%) 14.05 9.60 7.44 5.05 3.85 0 Nominal Si (at.%) 0 2.60 3.62 5.27 5.97 8.23 Nominal B (at.%) 16.78 15.80 14.81 14.81 14.54 13.70 T liquidus (°C) 1087.5 1074 1063 1064 1062 1059 Crα (at.%) 21.4 ± 0.4 16.2 ± 0.2 12.6 ± 0.1 9.0 ± 0.2 7.1 ± 0.2 0 Siα (at.%) 0 3.6 ± 0.2 5.4 ± 0.4 6.6 ± 0.6 7.6 ± 0.7 9.4 ± 0.3
Author's personal copy
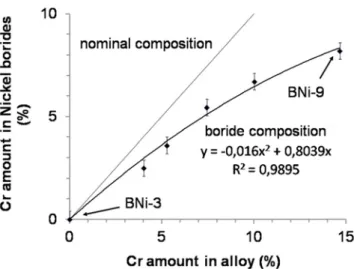
Fig. 16 Amount of Cr in nickel borides compared to amount of chromium in alloy
nickel borides. As the eutectic reaction progresses, the composition of nickel borides stays the same. The high diffusion coefficient of boron could lead to the fast com- position homogenization of the nickel boride. Chromium amounts in nickel boride were found to increase in an ap- proximately linear way with the overall Cr content of the alloy (Fig. 16). It was also found that the chromium amount in nickel borides is less than the alloy nominal content.
Final reaction Final phases in low Si alloys (M15 and BNi-9) were significantly different from the other alloys. In BNi-9 and M15 alloys, solidification ends with formation of the three-phase eutectic α + (Ni,Cr)3B + CrB and no Si-rich phase
has been observed. The M26 alloy is the only one among the studied alloys that exhibits a four-phase mixture α + (Ni,Cr)3B + Ni3Si + CrB. The Ni3Si phase in the M26 alloy
contains 1 ± 0.3 at.% Cr. In all these alloys, CrB borides contain an amount of about 2 at.% Ni.
M84 and M56 alloys end their solidification with the four- phase mixture α, (Ni,Cr)3B and two kinds of nickel silicides.
No boron can be detected in these phases. Composition vari- ations in silicides can tentatively be assigned to the formation of two different phases: β3-Ni3Si and γ-Ni5Si2.
Metallographic observations confirm that the solid-state β1
-Ni3Si precipitation in the α eutectic phase only occurs in alloys
undergoing formation of β3-Ni3Si in final solidification mixture.
5 Conclusions
• Six Ni-Cr-Si-B alloys, of composition ranging from BNi- 9 to BNi-3, have been investigated. All had a boron amount around 3 wt% close to commercial formulations. Alloys were found to be very sensitive to the oxygen at- mospheric level.
• The solidification sequence of all the alloys studied is the formation of α Ni-solid solution, followed by formation of a two-phase eutectic constituted of an α phase and a (Ni,Cr)3B phase. Final reaction differs according to the
alloy. Solidification of Cr-rich alloys ends with the reac-tion L ➔ α + (Ni,Cr)3B + CrB, while solidification of the
other alloys ends with L ➔ α + (Ni,(Cr))3B + β3-Ni3Si
reaction. The alloy with an atomic Si/Cr ratio of 0.487 ends the solidification sequence with a four-phase eutectic L ➔ α + (Ni,Cr)3B + β3-Ni3Si + CrB.
• For the formation of the first α solid, it is observed that the Cr and Si partition ratios k = Cs/Cl are kCr = 1.71 ± 0.11
and kSi = 1.32 ± 0.15. Multivariate regressions for pseudo-
solidus and pseudo-liquidus curves of the α phase are proposed.
• Study of the eutectic emphasizes that:
• The α eutectic phase exhibits large variations in compo- sition but is always enriched in Si and Cr content com- pared to the nominal composition of the alloy.
• Nickel borides contain no Si amount and a Cr amount less than the nominal one. There is an approximately linear relationship between Cr amounts in nickel boride and the overall Cr content. The nickel boride composition was found to be constant for a given alloy. The volume fraction of nickel borides was approximately constant in all the quaternary alloy.
Acknowledgments The authors thank Etablissements Chpolansky, Marcoussis, France, which kindly provided the certified commercial brazing alloys. Dr. J. Zollinger calculated the equilibrium ternary alloy phase diagrams with Thermo-Calc® and the TTNi7 database. M. Bertrand, master student, also contributed to this study. Finally Dr. L. Peltier and P. Charbonnier realized a secondary vacuum furnace which allowed melting of these alloys. The authors thank NSERC and CRIAQ for their indirect financial support on related projects.
References
1. Peaslee RL (2003) Brazing footprints. s.l.: Wall Colmonoy Corporation, pp. 196–198. ISBN: 0–9724479–0-3, S
2. American Welding Society Technical Activities Committee (2011) Specification for filler metals for brazing and braze welding. American Welding Society Doral, Florida. isbn:978-0-87171-790-0 3. Ohsasa K, Shinmura T, Narita T (1999) Numerical modeling of the
transient liquid phase bonding process of Ni using Ni-B-Cr ternary filler metal. Journal of Phase Equilibria 20(3):199–206
4. Aluru R, Gale WF, Chitti SV, Sofyan N, Love RD, Fergus JW (2008) Transient liquid phase bonding of dissimilar nickel base superalloys—wettability, microstructure and mechanical proper- ties. Mater Sci Technol 24(5):517–528
5. Ruiz-Vargas J, Siredey-Schwaller N, Gey N, Bocher P, Hazotte A (2013) Microstructure development during isothermal brazing of Ni/BNi-2 couples. J Mater Process Technol 213:20–29
6. Schuster JC, Du Y (2000) Experimental investigation and thermo- dynamic modeling of the Cr-Ni-Si system. Metall Mater Trans A 31A:1795–1803
7. Lebrun N, Perrot P, Serbruyns A, Tedenac JC (2010) Boron–nick-el–silicon in refractory metal systems. Springer, Berlin Heidelberg, pp 133–152
8. Omori S, Hashimoto Y, Shoji K, Hidaka K, Kohira Y (1972) Liquidus surfaces of ternary Ni-B-Si alloys for use as infiltrants. (in Japanese), J Japan Soc Powder Met 18(8):316–320
9. Jansson B, Agren J (1984) A thermochemical assessment of liquid- solid equilibria in nickel-rich Ni-Si-B alloys. Mater Sci Eng 63:51–60 10. Lebaili S, Hamar-Thibault S (1987) Equilibres liquide-solide dans
le système Ni-B-Si dans la région riche en nickel. Acta Metall 35: 701–710
11. Tokunaga T, Nishio K, Ohtani H, Hasebe M (2003) Phase equilibria in the Ni–Si–B system. Mater Trans 44(9):1651–1654
12. Bondar A (2006) Boron–chromium–nickel, Landolt-Boernstein nu- merical data and functional relationships. Science and Technology (New Series). Group IV: Physical Chemistry, 11, 153–167. Ed: W. Springer, Martissen
13. Campbell CE, Kattner UR (2002) Assessment of the Cr-B system and extrapolation to the Ni-Al-Cr-B quaternary system. Calphad 26(3):477–490
14. Lugscheider E, Knotek O, Reimann H (1974) The ternary system Nickel-Chrom-Bor (in German). Monatsh Chem 105(1):80–90
15. Omori S, Koyama K, Hashimoto Y, Yamada K (1985) Liquidus surface of B-Cr-Ni system (in Japanese). J Japan Inst Met 49(11):935–939 16. Ruiz-Vargas J, Siredey-Schwaller N, Noyrez P, Mathieu S, Bocher
P, Gey N (2014) Potential and limitations of microanalysis SEM techniques to characterize borides in brazed Ni-based superalloys. Mater Charact 94:46–57