HAL Id: hal-00297784
https://hal.archives-ouvertes.fr/hal-00297784
Submitted on 20 Dec 2004HAL is a multi-disciplinary open access
archive for the deposit and dissemination of sci-entific research documents, whether they are pub-lished or not. The documents may come from teaching and research institutions in France or abroad, or from public or private research centers.
L’archive ouverte pluridisciplinaire HAL, est destinée au dépôt et à la diffusion de documents scientifiques de niveau recherche, publiés ou non, émanant des établissements d’enseignement et de recherche français ou étrangers, des laboratoires publics ou privés.
Protein analysis in dissolved organic matter: what free
proteins from soil leachate and surface water can tell
us ? a perspective
W. Schulze
To cite this version:
W. Schulze. Protein analysis in dissolved organic matter: what free proteins from soil leachate and surface water can tell us ? a perspective. Biogeosciences Discussions, European Geosciences Union, 2004, 1 (1), pp.825-853. �hal-00297784�
BGD
1, 825–853, 2004 Protein analysis in dissolved organic matter W. Schulze Title Page Abstract Introduction Conclusions References Tables Figures J I J I Back CloseFull Screen / Esc
Print Version Interactive Discussion EGU Biogeosciences Discussions, 1, 825–853, 2004 www.biogeosciences.net/bgd/1/825/ SRef-ID: 1810-6285/bgd/2004-1-825 European Geosciences Union
Biogeosciences Discussions
Biogeosciences Discussions is the access reviewed discussion forum of Biogeosciences
Protein analysis in dissolved organic
matter: what free proteins from soil
leachate and surface water can tell us
– a perspective
W. Schulze
Center for Experimental Bioinformatics, University of Southern Denmark, Campusvej 55, 5230 Odense, Denmark
Received: 15 November 2004 – Accepted: 13 December 2004 – Published: 20 December 2004
Correspondence to: W. Schulze ([email protected])
BGD
1, 825–853, 2004 Protein analysis in dissolved organic matter W. Schulze Title Page Abstract Introduction Conclusions References Tables Figures J I J I Back CloseFull Screen / Esc
Print Version Interactive Discussion
EGU
Abstract
Mass spectrometry based analysis of proteins is widely used to study cellular pro-cesses in model organisms. However, it has not yet routinely been applied in envi-ronmental research. Based on observations that protein can readily be detected as a component of dissolved organic matter (DOM), this article gives an example about 5
the possible use of protein analysis in ecology and environmental sciences focusing on different terrestrial ecosystems. At this stage, there are two areas of interest: (1) the identification of phylogenetic groups contributing to the DOM protein pool, and (2) iden-tification of the organismic origin of specific enzymes that are important for ecosystem processes. In this paper, mass spectrometric protein analysis was applied to identify 10
proteins from DOM and organism-free surface water samples derived from different environments. It is concluded, that mass spectrometric protein analysis is capable of distinguishing phylogenetic origin of proteins from leachates of different soil horizons, and from various sources of terrestrial surface water. Current limitation is imposed by the limited knowledge of complete genomes of soil organisms. The protein analy-15
sis allows to relate protein presence to biogeochemical processes, and to identify the source organisms for specific active enzymes. Further applications, such as in pollu-tion research are conceivable. In summary, the analysis of proteins opens a new area of research between the fields of microbiology and biogeochemistry.
1. Introduction
20
Dissolved organic matter (DOM) plays an important role in the carbon biogeochem-istry coupling terrestrial and aquatic carbon pools. These pools of dissolved organic nitrogen and carbon are significant for C and N cycles of terrestrial ecosystems and undergo variations in season and depth profile. The composition and origin of DOM may depend on the organisms living in a given environment (Michalzik and Matzner, 25
BGD
1, 825–853, 2004 Protein analysis in dissolved organic matter W. Schulze Title Page Abstract Introduction Conclusions References Tables Figures J I J I Back CloseFull Screen / Esc
Print Version Interactive Discussion
EGU
respect to their δ13C and δ15N origin and their basic chemical structure (Michalzik and Matzner, 1999; Gleixner et al., 2001; Kaiser et al., 2001). 15N NMR analysis has demonstrated that a significant amount of nitrogen is present in amide form (Almen-dros et al., 1991), and thus possibly as protein. Recent NRM analyses of DOM in wetlands indicate that protein-like components are produced in situ and can contribute 5
up to 30% in total DOM (Lu et al., 2003). Characterization of different molecular weight fractions of dissolved organic matter using fluorescence detections also clearly indi-cate the presence of proteins (Her et al., 2003). However, not much is actually known about this protein component of DOM. Analysis of these proteins, i.e. characterization of their identity, their phylogenetic origin, their functions, and spatial distribution could 10
link ecosystem biology to biogeochemical processes. The analysis of proteins in en-vironmental samples so far has mainly been pursued in marine biology involving the detection of specific proteins by immunological techniques, and N-terminal sequenc-ing of isolated proteins (Keil and Kirchman, 1993; Tanoue, 1996; Tanoue et al., 1996; Suzuki et al., 1997; Yamada and Tanoue, 2003). However, protein from terrestrial 15
sources of DOM so far have not been considered for in-depth analyses.
Protein mass spectrometry is one of the fastest developing research areas, and con-tributes substantially to our understanding of organisms at the cellular level (Aebersold and Mann, 2003; Tyers and Mann, 2003). Recently there have been considerable ef-forts to extend genomic and proteomic analyses beyond the boundary of organisms. 20
These approaches were termed meta-genomics or meta-proteomics. They involve iso-lation and sequencing of random DNA samples extracted from environments, such as oceans and soil (Tyson et al., 2004; Venter et al., 2004), as well as characterizations of proteins from bacterial communities in waste water sludges (Wilmes and Bond, 2004). In contrast to DNA and RNA, proteins combine information about the taxonomy of the 25
active pool of organisms with a catalytic function. By directly analyzing the protein component of organic matter, we can conclude about the identity of the organisms contributing to the DOM pool, and at the same time also understand the functional contribution of certain proteins to biogeochemical processes. In a pioneer study, the
BGD
1, 825–853, 2004 Protein analysis in dissolved organic matter W. Schulze Title Page Abstract Introduction Conclusions References Tables Figures J I J I Back CloseFull Screen / Esc
Print Version Interactive Discussion
EGU
protein composition of DOM from different soil layers and from organic soil particles was analyzed. There it was shown that a large number of proteins is present in soil leachates, and that they can mirror the phylogenetic groups present in ecosystems. Thus, the approach has been referred to as ‘proteomic fingerprinting’ (Schulze et al., 2004).
5
By further pursuing the analysis of ‘proteomic fingerprints’, this paper presents tax-onomic and functional information of the protein component of DOM from contrasting environmental sources. The paper focuses on (i) analysis of organisms contributing to decomposition of plant material, (ii) a comparison of taxonomic units present in dif-ferent surface waters, and (iii) comparison taxonomic units of DOM from leachates of 10
different soil types. Furthermore, functional information was exploited by classifying identified proteins according to (iv) size and (v) cellular function. It is concluded that routine analysis of proteins from DOM has the potential to develop into a novel field of ecological and environmental research.
2. Methods
15
2.1. Sampling sites
In order to validate the ‘proteomic fingerprint’ method of taxonomic and functional clas-sification, sampling sites were chosen from arctic and temperate regions comprising different soil types and surface waters.
20
Surface water sources
Filtered and freeze-dried samples from different terrestrial surface water sources were analyzed: (i) Lake Hohloh is a brown water peat pond (pH 3.4) in a natural preservation area at the top of a mountain (1000 m above sea level) in the Black 25
BGD
1, 825–853, 2004 Protein analysis in dissolved organic matter W. Schulze Title Page Abstract Introduction Conclusions References Tables Figures J I J I Back CloseFull Screen / Esc
Print Version Interactive Discussion
EGU
controlled by natural outflow. The mean DOC of the lake water was 25.6±3.2 mg L−1 (Kracht and Gleixner, 2000). (ii) An acidic creek was sampled at the Waldstein, site K ¨oherloh, Germany. It is a drainage creek to a peatland with organic substrate of 30 to 40 cm thickness. (iii) a stream was sampled in a watershed located on the western edge of a continuous permafrost distribution near Tura, Central Siberia (64◦150N, 5
100◦130E). Two samples were obtained, one during early summer baseflow (“low wa-ter”) and one during a midsummer stormflow (“high wawa-ter”). (iv) rain water collected in dark rain collectors at 1 m above ground at the Waldstein, site Coulissenhieb, Germany.
Soil leachates
10
DOM of leachates at 5 cm depth from different soil types from temperate and arctic regions were investigated: (i) Leachate from a cambisol was taken form the unman-aged beech forest of the National Park Hainich, Germany, at 430 m elevation. At the sampling site, total carbon reached 58 mg g−1 in the 5 to 10 cm horizon. Soil humus 15
was of mull type and carbon mineralization reached a maximum of 123 g C m−2 a−1 in the top mineral soil, indicating high soil microbial activity. (ii) Leachate from dystric cambisol was taken from the Waldstein, site Coulissenhieb, Germany, a managed spruce forest growing at an elevation of 750 m. Soil carbon concentration reached 80 mg g−1. The organic layer was of mor type. (iii) A sample from arenosol was 20
obtained from a 160 year-old Pinus sylvestris forest near Seybothenreuth, Germany at 490 m above sea level. Total soil carbon concentration was 377 mg g−1. (iv) Leachate from a histosol was sampled, from a Sphagnum bog with Betula at the Waldstein, site K ¨ohlerloh, Germany and (v) leachate form gelic podzol was obtained from a Siberian larch forest. Total soil carbon concentration was 55 mg g−1 and soil humus was of 25
mor type. Equal amounts (10 mg) of freeze-dried DOM were analyzed as described in Sect. 2.2.
BGD
1, 825–853, 2004 Protein analysis in dissolved organic matter W. Schulze Title Page Abstract Introduction Conclusions References Tables Figures J I J I Back CloseFull Screen / Esc
Print Version Interactive Discussion
EGU
Proteins were extracted from three independent samples collected from four di ffer-ent stages of organic matter decomposition on a permafrost soil near Tura, Cffer-entral Siberia. The sampling site was of pale-yellow soils with vegetation dominated by feather mosses. Along a soil depth profile an area of 10×10 cm was sampled. Vege-5
tation was separated into green and brown parts, and material from litter horizon and FH horizon was subsequently processed as described in Sect. 2.3. From this sampling site in Siberia, soil leachate and stream water was collected.
2.2. Collection of DOM from surface water and soil leachates
The methods described here focus on the analysis of free proteins in organism-free 10
dissolved organic matter. Protein contents are very low, thus pre-concentration of the samples is necessary. Surface water samples were collected, filtered through 0.2 µm, and freeze-dried. Percolating soil water leachate was obtained using glass ceramic suction plates. Plates were installed at 5 cm soil depth. Water was collected every fortnight and filtered through a 0.2 µm acetate filter prior to freeze-drying. Prior to 15
analysis, samples were re-hydrated using 500 µL of 50 mM Tris-HCl, pH 8.
2.3. Protein extraction from material of decomposition line
Plant material and detritus was dried and pulverized. Equal amounts (20 mg) of powder was extracted using 50 mM Tris-HCl, pH 8, 150 mM NaCl, 1% Nonident P-40 under heavy mixing for 10 min. Extracts were then processed as described in Sect. 2.4. 20
2.4. Sample preparation and analysis by LC-MS
Humic acids, phenolic compounds, and other small molecules were removed from the DOM solution by size exclusion gel filtration over Sepharose 4B. Protein containing fractions were combined, protein was concentrated by Ethanol precipitation, and sep-arated via SDS-polyacrylamide gel electrophoresis. After silver staining, each lane 25
BGD
1, 825–853, 2004 Protein analysis in dissolved organic matter W. Schulze Title Page Abstract Introduction Conclusions References Tables Figures J I J I Back CloseFull Screen / Esc
Print Version Interactive Discussion
EGU
was cut into slices of approximately equal protein content and proteins in the slices were in-gel digested using trypsin (Shevchenko et al., 1996). Tryptic peptides were ex-tracted from the gel particles with acetonitrile, and desalted using C18-based STAGE-tips (Rappsilber et al., 2003).
Mixtures of tryptic peptides were separated by nanoflow liquid chromatography (Ishi-5
hama et al., 2002) prior to analysis by high mass-accuracy tandem mass spectrom-etry (LC MS/MS) on a QSTAR pulsar quadrupole time-of-flight hybrid mass spec-trometer. Sequences of tryptic peptides were derived by information-dependent ac-quisition of fragmentation spectra of multiple-charged peptides (Rappsilber et al., 2002). Acquired spectra were searched against the NCBI protein database (http:
10
//www.ncbi.nlm.nih.gov/) using the Mascot search algorithm (Perkins et al., 1999). The following search parameters were applied: maximum of one missed trypsin cleavage, cysteine carbamidomethylation, methionine oxidation, and a maximum 0.2 Da error tolerance in both the MS and MS/MS data (40 ppm after dynamic recalibration). Only fully tryptic peptides were considered and all sequences were manually verified against 15
the raw mass spectrometric data using accepted rules for peptide fragmentation in a quadrupole-TOF hybrid mass spectrometer (Roepstorff and Fohlman, 1984). On aver-age, 30% of the proteins were identified by a single tryptic peptide.
2.5. Taxonomic and functional classification
The protein sequence derived from MS/MS spectra of tryptic peptides bears taxonomic 20
information of the organism of origin. In most cases, the sequences obtained from tryptic peptides were unique to a specific group of organisms or even single species (Shevchenko et al., 2001; Rappsilber and Mann, 2002). Since full sequence informa-tion is available only for a limited number of organisms, the identified proteins were grouped according to broader taxonomic levels following the nomenclature of the NCBI 25
taxonomy browser (http://www.ncbi.nlm.nih.gov/Taxonomy/taxonomyhome.html/). Es-pecially for bacteria, vast genomic information is available which readily allows to dis-tinguish finer categories. This was carried out in one example. For the aim of this study,
BGD
1, 825–853, 2004 Protein analysis in dissolved organic matter W. Schulze Title Page Abstract Introduction Conclusions References Tables Figures J I J I Back CloseFull Screen / Esc
Print Version Interactive Discussion
EGU
it is not necessary to recover a full proteome for any organism, rather it is sufficient to recover one protein per organism that contains species specific information.
For taxonomic classification, proteins originating from bacteria, archaea, and viruses were not separated into further subgroups. Proteins from eukaryotes were sorted by their origin from green plants, metazoa, fungi, and ‘unicellular eukaryota’ containing 5
all those taxa that do not belong to the three major groups of eukaryota. Proteins from plants were further grouped into ‘algae’ and ‘vascular plants’. Proteins from meta-zoans were classified into platyhelminthes, protostomia (annelid worms, insects, and mollusks), nematoda, and vertebrata (mammals, birds, reptiles amphibians, fish). In some cases, tryptic peptides identified regions of proteins which are highly conserved 10
among organisms from different taxonomic groups. These proteins were designated as ‘not classified’. Protein sequences were analyzed for redundancy by pairwise align-ment of all identified protein sequences. Sequences with an identity greater than 95% were considered identical. The functional attributes of the identified proteins were as-signed following the Enzyme Commission Classification Scheme.
15
2.6. Statistical analysis
Taxonomic protein distributions were compared using a Chi-Squared test. The taxo-nomic distribution of protein entries in the NCBI database were used as a reference.
3. Results
4. Analysis of organisms contributing to decomposition of plant material
20
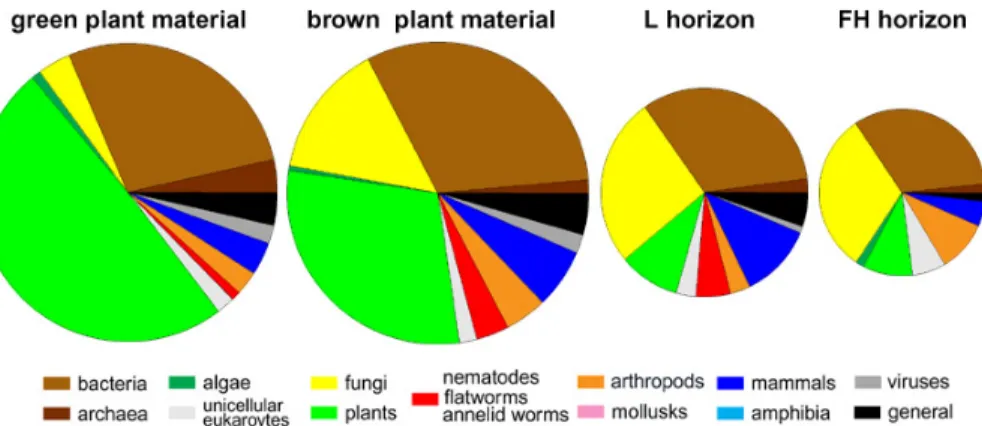
Proteins were extracted from four different stages of organic matter decomposition, such as green plant material, brown plant material, litter horizon, and FH horizon. As expected, plant proteins were found to make up the largest fraction in extracts from green layers, but the second largest fraction of proteins is bacterial proteins (Fig. 1).
BGD
1, 825–853, 2004 Protein analysis in dissolved organic matter W. Schulze Title Page Abstract Introduction Conclusions References Tables Figures J I J I Back CloseFull Screen / Esc
Print Version Interactive Discussion
EGU
Among the plant proteins, a high number of proteins specific to mosses were identi-fied, such as moss-specific isoforms of RubisCO, ATP-synthase, and glyceraldehyde-3-phosphate-dehydrogenase (data not shown).
The fraction of plant proteins decreased with decomposition, while the fraction of fungal proteins increased in deeper litter layers. In the L and FH horizons, fungi and 5
bacteria were the dominating taxonomic origins of proteins. Among the fungal proteins, proteins from basidiomycetes were only detected in the L and FH layers, while the vast majority of fungal proteins was from ascomycetes. With increasing decomposition, the total number of identified proteins decreases and drops to 30% in the FH horizon compared to the total number of proteins identified in the green moss layer.
10
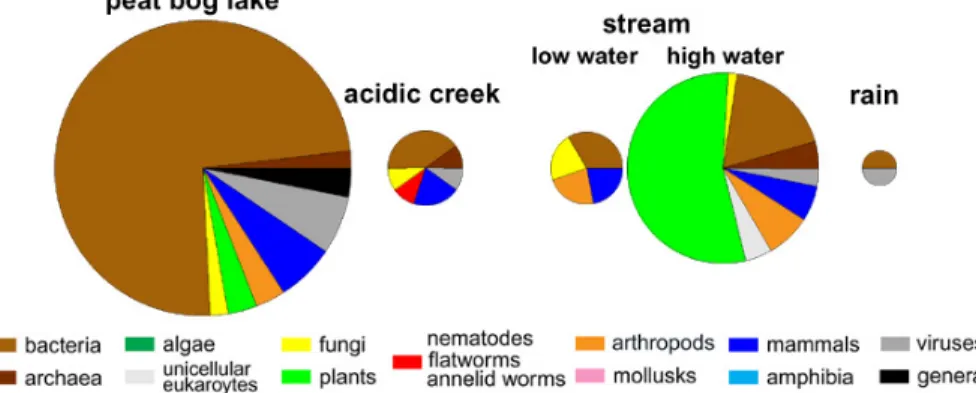
4.1. Protein origin in surface waters
The different surface water samples show a vast diversity of protein origin (Fig. 2). A peat bog lake was dominated by bacterial proteins, with only 22% of proteins originating from other organisms, mainly viruses, vertebrates, and protostomia. In total, proteins from seven phylogenetic groups were distinguished.
15
An acidic creek flowing through a bog also showed a high fraction of bacterial pro-teins. In contrast, the pattern of protein origin and protein amount of a small stream in the forest tundra of Siberia was dependent on water flow levels. At low baseflow, only small amount of protein was detected, and these originated only from four different phylogenetic groups. In contrast, after a summer stormflow, the number of detected 20
proteins increased by factor 7. The soluble proteins in the DOM of the stream wa-ter at stormflow were dominated by plant proteins, and proteins from a total of eight other phylogenetic groups were identified. The observed increase in protein abun-dance was accompanied by an increase in DOC from 16.9 mg C L−1 at low flow levels to 23.3 mg C L−1at the intense stormflow.
25
Finally, rain water contained only very few proteins originating from bacteria and viruses. These examples show that there is a strong variation in the phylogenetic origin of proteins as well as total number of proteins contributing to DOM of different
BGD
1, 825–853, 2004 Protein analysis in dissolved organic matter W. Schulze Title Page Abstract Introduction Conclusions References Tables Figures J I J I Back CloseFull Screen / Esc
Print Version Interactive Discussion
EGU
surface waters at different seasons.
4.2. Protein origin in DOM of soil leachates
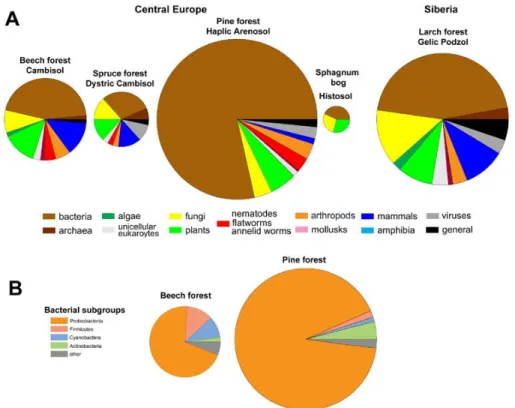
Total protein content of the different soil types was highest in the arenosol, whereas lowest protein amounts were found in leachates of the dystric cambisol of sub-monatane central European spruce forest and the histosol of a Sphagnum bog 5
(Fig. 3a). Bacterial proteins made up the highest fraction in all investigated soil leachates and reached 80% in leachates of the arenosol. In the other soil leachates, the fraction of bacterial proteins ranged from 30% to 45%. In leachates of cambisol and dystric cambisol a significant fraction of proteins originated from fungi and plants. Nematodal proteins were only found in leachates of temperate forests. Thus, the total 10
protein content and taxonomic distribution of protein in DOM of soil leachates varies depending on climatic region and soil type. In addition, seasonal variations have previ-ously been described (Schulze et al., 2004).
Bacterial proteins were analyzed in more detail for the samples of the pine for-est (arenosol) and beech forfor-est (cambisol) by distinguishing the bacterial taxonomic 15
classes proteobacteria, actinobacteria, firmicutes, cyanobacteria, and “others”. The results show that the leachates of the two soil types are significantly different with re-spect to the bacterial species contributing to the DOM protein pool (Fig. 3b). Although proteobacteria were the largest group of bacteria in both environments, the beech for-est soil leachate contained higher percentages of proteins from cyanobacteria and fir-20
micutes compared to the pine forest on sandy soils. This demonstrates that the protein analysis is suitable of displaying composition of the microbial communities contribut-ing to DOM protein also at finer taxonomic resolution (Fig. 3b), but at the same time covering information about the whole spectrum of organism groups (Fig. 3a).
BGD
1, 825–853, 2004 Protein analysis in dissolved organic matter W. Schulze Title Page Abstract Introduction Conclusions References Tables Figures J I J I Back CloseFull Screen / Esc
Print Version Interactive Discussion
EGU
4.3. Reproducibility of the ‘proteomic fingerprint’
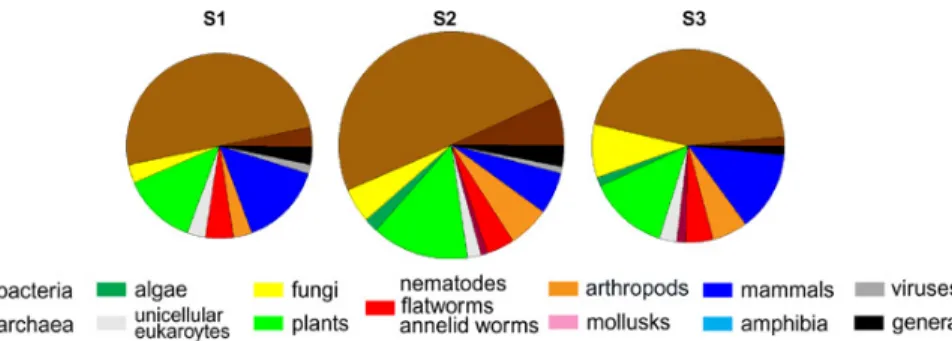
The protein analysis of environmental samples will be subject to variations between sampling sites and sampling times. In order to be able to interpret the taxonomic distribution of proteins from DOM, the sample-to-sample variability was analyzed. In-dependent samples from a central European beech forest (cambisol, beech forest on 5
limestone in the Hainich, Germany, see Fig. 2) were taken at the same time from three different sampling sites in a line 25 m apart from each other (Fig. 4). Although 30% more proteins were detected at site 2 compared to the other two sites, the pattern of taxonomic origin of proteins showed no significant differences between sampling sites (chi-squared test), indicating that the result of the protein analysis, the identification and 10
classification is reproducible. Also the ‘proteomic fingerprint’ of decomposing material (Fig. 1) was reproduced from three independent samples with no significant differences in the taxonomic distribution of protein origin between them (data not shown). In ad-dition, all taxonomic distributions presented in Figs. 1 to 4 were significantly different (chi-squared test) from a random distribution of taxonomic units as derived from the all 15
protein entries into the NCBI-protein database. 4.4. Phylogenetic groups and protein amount
The ‘proteomic fingerprint’ of DOM is based on the classification of proteins into their taxonomic groups of origin. In the present study, only 12 different taxonomic categories were distinguished (see Sect. 2.5). In samples with 20 or more proteins identified the 20
number of distinguished taxonomic groups ranged from 6 to 10 independent of protein number (Fig. 5). Only in one case (sample S2 in Fig. 4), all 12 distinguished taxonomic units were recognized. The taxonomic classification taken here is rather broad, as the genomic sequence information available in databases is still limiting.
BGD
1, 825–853, 2004 Protein analysis in dissolved organic matter W. Schulze Title Page Abstract Introduction Conclusions References Tables Figures J I J I Back CloseFull Screen / Esc
Print Version Interactive Discussion
EGU
4.5. Protein size distribution and protein function
The size distribution of proteins identified from DOM peaks at about 40 kDa (Fig. 6) and was independent of soil depth and season. The size distribution found here is in agreement with calculated average protein sizes for E.coli of 35 kDa and 51.8 kDa for human (Cagney et al., 2003).
5
The bacterial proteins identified in this study were classified according to their cellular function. Most proteins identified were ribosomal proteins, followed by an additional large group of metabolic enzymes (Fig. 7). The apparent changes in the abundance of ribosomal proteins that can be observed between DOM samples from summer and winter cannot readily be explained and needs further investigation.
10
Protein synthesis (i.e. ribosomes) and energy metabolism (i.e. metabolic enzymes) are also the two most abundant categories of protein function in living organisms (The Arabidopsis Genome Initiative, 2000), indicating that the DOM protein analysis indeed reflects the protein composition of cells from contributing organisms. Among the bacterial membrane proteins identified in this study, porin, subunits of ABC type 15
branched chain amino acid transport systems, and subunits of the ATP-synthase were the most common. This is in agreement with recent immunochemical studies of dis-solved proteins in ocean waters (Yamada and Tanoue, 2003) and a two-dimensional gel electrophoresis/MALDI-TOF analysis of bacterial communities on activated waste water sludge (Wilmes and Bond, 2004). In both studies, also porins were identified as 20
the most abundant membrane proteins.
5. Discussion
This study focuses on a ‘survey’ analysis of the protein component of DOM with respect to taxonomic and functional classification. Therefore, samples from regions displaying vast differences in ecosystem biology with respect to climatic region and soil type were 25
clas-BGD
1, 825–853, 2004 Protein analysis in dissolved organic matter W. Schulze Title Page Abstract Introduction Conclusions References Tables Figures J I J I Back CloseFull Screen / Esc
Print Version Interactive Discussion
EGU
sification, but also contributes to a chemical characterization of DOM. 5.1. Interpretation of the ‘proteomic fingerprint’
Although most of the result presented here are not unexpected, the analysis of proteins at different stages of decomposing plant material (Fig. 1) is especially well suited to validate the methodology of protein detection and classification of taxonomic origin. 5
The high fraction of bacterial proteins in protein extracts of green plant material is not surprising as bacteria are expected to be present in all environmental samples. A thorough analysis of microbial biomass (gC 100 g−1soi l) suggested a ratio of bacteria to fungi of 35% to 65% the FH layer in a natural beech forest (Ellenberg et al., 1986). The protein analysis revealed equal amounts of bacterial and fungal proteins in the FH 10
layer.
However, the protein analysis is not a direct measure of biomass but rather it empha-sizes the actual turnover and metabolic activity of the respective phylogenetic group. This is concluded from differences in ribosomal protein abundance in samples from different seasons. As ribosomes are essential components of the protein synthesis 15
machinery in a cell, their abundance correlates with the metabolic or growth activity of cells (Gao et al., 1994). Therefore, low abundance of ribosomal proteins in winter DOM samples, may indicate a lower activity and turnover of bacteria in winter. Thus, the functional classification of proteins may possibly be an indicator of organism activity in a given ecosystem.
20
Detailed interpretation of every difference between the ‘proteomic fingerprints’ of various water sources and soil leachates is not possible at this stage. The analysis clearly shows that each environment has its ‘fingerprint’, which can be meaningful on a broader scale. For example the drastic increase in plant proteins in stream water after a stormflow can be interpreted by the accumulation of fresh plant material in the 25
flood. Furthermore, the low amount of protein in the Siberian stream at low water level could indicate that in-situ geochemical processes influence the protein composition: At the Siberian sampling site, water percolates from the organic layer (shown in Fig. 1)
BGD
1, 825–853, 2004 Protein analysis in dissolved organic matter W. Schulze Title Page Abstract Introduction Conclusions References Tables Figures J I J I Back CloseFull Screen / Esc
Print Version Interactive Discussion
EGU
through the mineral soil (shown in Fig. 3) until it appears in the stream (shown in Fig. 2). Along this path, plant proteins from the organic moss layer disappear and proteins from other organisms emerge.
5.2. Enzymes in DOC
A key question remains as to whether any of the proteins with enzymatic function identi-5
fied in DOM is actually functional and thus involved in geochemical processes. Enzyme activity tests have so far been mainly applied to characterize microbial communities, of-ten without separating bulk soil from dissolved organic matter (Lee et al., 2004; Singh and Rai, 2004). Enzyme activities associated with particulate organic matter have been well studied (Stemmer et al., 1998; Sessitsch et al., 2001; Misic et al., 2002).
10
In contrast, activities of free enzymes in dissolved organic matter are rarely as-sessed, and focus mainly on the pollution through sewage work outlets (Chappell and Goulder, 1994). None of the enzymes identified from DOM in this study were true extracellular enzymes, but laccase protein sequences were identified by mass spec-trometry as being bound to organic particles in soils, but not in free DOM (Schulze et 15
al., 2004). Moreover, the high proportion of ribosomal proteins and membrane proteins among the identified proteins, as well as the protein size distribution indicate that most of the proteins in DOM are products of natural cell lysis as it occurs when cells and organisms die.
5.3. Taxonomic distribution and ecosystem biology 20
It becomes apparent from this study that the protein components of DOM from different ecosystems clearly differ in taxonomic composition. Since the protein size distribution in DOM is not different from that of living cells (Cagney et al., 2003), degradation and adsorption of proteins to mineral particles is assumed not to depend on protein size. Sample preparation and mass spectrometric analysis does not seem to introduce a 25
BGD
1, 825–853, 2004 Protein analysis in dissolved organic matter W. Schulze Title Page Abstract Introduction Conclusions References Tables Figures J I J I Back CloseFull Screen / Esc
Print Version Interactive Discussion
EGU
well with analyses of dissolved organic matter as a function of molecular weight using fluorescence spectrometry. There, protein specific fluorescence peaked around 30 kDa (Her et al., 2003). In addition, the functional classification of DOM proteins reflects the functional distribution of proteins in cells (Fig. 7). Thus, size and functional distribu-tion of identified proteins indicate that the protein analysis of DOM indeed provides 5
a measure of relative abundance of proteins originating from organisms of different phylogenetic groups. This interpretation is highly supported by the analysis of protein extracts from different layers of decomposing plant material (Fig. 1), which show the expected gradual increase in bacterial and fungal protein fractions, while the fraction of plant proteins decreases.
10
Previous analyses of particulate proteins in Pacific surface waters by fluorescence and SDS-PAGE show higher total protein presence in water samples from produc-tive regions (Equatorial regions, and North Pacific) compared to oligotrophic regions (Tanoue, 1996). Thus, the total protein amounts determined in this study may reflect total biological activity of the ecosystem, while the taxonomic distribution reflects the 15
contribution of different organisms to this activity. 5.4. ‘Poteomic fingerprint’ and alternative approaches
The analysis of species distribution and abundance in ecosystems has been of interest for ecologists for a long time, and remains important even today when characterizing different ecosystem communities (Ellenberg et al., 1986; Ellwood and Foster, 2004). 20
In a thorough analysis of all animal and plant species distributions, an ‘inventory’ of organisms was carried out in a beech forest over 20 years of investigation (Ellenberg et al., 1986). Today, phospholipid fatty acid analysis, community level physiological profiles, or analysis of fatty methyl esters are established tools to study dynamics of soil microbial communities in response to environmental changes (Priha et al., 1999; 25
Rich et al., 2003; Steger et al., 2003; Leckie et al., 2004). PCR analysis of bacterial communities has a high resolution of species identification, but is limited to the analysis of one single taxonomic group, i.e. bacteria or fungi (Liston et al., 1996; Ritchie et al.,
BGD
1, 825–853, 2004 Protein analysis in dissolved organic matter W. Schulze Title Page Abstract Introduction Conclusions References Tables Figures J I J I Back CloseFull Screen / Esc
Print Version Interactive Discussion
EGU
2000; Williamson et al., 2000; Lipson et al., 2002). The ‘proteomic fingerprint’ method described here is a rapid and powerful approach to resolve taxonomic identity up to the genus or species level, and it represents all taxonomic units from prokaryotes to eukaryotes. In that respect it is distinct from most other approaches, which focus on specific groups of organisms but seldom obtain a global view of diversity across all taxa 5
in the give ecosystem compartment.
Thus, the protein analysis of DOM described here is an important additional and new way of displaying contribution of different organisms to an ecosystem. The envi-ronmental protein analysis has the potential to picture the taxonomic information of the complete organismic food web, but may be biased towards emphasis of metabolically 10
active organisms with a high cellular turnover rate (i.e. bacteria). With improving sen-sitivity of protein mass spectrometry, and increasing efficiency of unambiguous protein identification, an even more detailed picture will emerge in future (Aebersold and Mann, 2003; Olsen et al., 2004).
5.5. Limitations of the ‘proteomic fingerprint’ 15
One limiting factor of the DOM protein analysis currently lies in the incomplete ge-nomic sequence information form many taxoge-nomic groups. Current efforts of sequenc-ing DNA samples extracted from environments (Venter et al., 2004) are encouragsequenc-ing and will provide a basis for more accurate protein identifications and possibly will allow finer distinction of organisms in future. It could be demonstrated using an experimen-20
tal dataset that cross-species protein identification by mass spectrometry successfully identifies over 80% of the proteins by sequence similarity searches, because ortho-logue proteins share sufficient sequence identity (Habermann et al., 2004). Never-theless, there are indications that diversity of larger taxonomic entities correlates with species diversity (B ´aldi, 2003), supporting that the broad taxonomic classification ap-25
plied here can well represent the organismic structure of the given ecosystem con-tributing to the DOM pools.
BGD
1, 825–853, 2004 Protein analysis in dissolved organic matter W. Schulze Title Page Abstract Introduction Conclusions References Tables Figures J I J I Back CloseFull Screen / Esc
Print Version Interactive Discussion
EGU
more detail in future. Currently, it is not clear, whether specific proteins are resistant to degradation due to their protein structure, as has been suggested for bacterial porin proteins (Yamada and Tanoue, 2003). The size distribution and functional protein clas-sification obtained in this study strongly suggests that porins are frequently detected in DOM samples because they are highly abundant in the bacterial membranes, and that 5
degradation of protein occurs at random. However, initial experiments with synthetic proteins confirm that glycosylated proteins degrade more slowly than protein or sug-ars alone, possibly due to their increased sorption to soil particles and thus decreased accessibility by degrading enzymes (Keil and Kirchman, 1993).
Although protein numbers and distribution of phylogenetic origin of samples taken 10
from the same environment and soil type are non-random and reproducible, care needs to be taken when protein amounts between different soil substrates are compared (see Figs. 2 and 3). In this study, samples were analyzed based on equal mass of freeze-dried DOM. Depending on soil type and matrix, the inorganic salt content may vary and have direct impact on the mass of actual organic substance subjected to the analysis. 15
In-depth analysis of matrix effects and sample size needs to be considered in future.
6. Conclusions
The method of ‘proteomic fingerprinting’ of DOM has the potential to become a rapid approach to compare organism presence in environments and their seasonal changes. Most importantly, proteins mirror the catalytically active component of dissolved organic 20
matter. Thus, analysis of protein identity can improve our understanding of soil organic chemistry. Although in the examples analyzed here, detection of biodegradative en-zymes seems like searching a needle in the haystack, combination of mass spectro-metric protein identification with immunprecipitation or affinity purifications can serve as future tools to study specific enzymes of interest.
25
In conclusion, despite the current limitations, mass spectrometric analysis of proteins in DOM opens a new way of describing the biological origin of this yet fairly
uncharac-BGD
1, 825–853, 2004 Protein analysis in dissolved organic matter W. Schulze Title Page Abstract Introduction Conclusions References Tables Figures J I J I Back CloseFull Screen / Esc
Print Version Interactive Discussion
EGU
terized component of DOM. Although the approach in this study has been applied to natural or semi-natural ecosystems, it is obvious, that the methodology may be very powerful to characterize effects of management on biological communities, as pio-neered in a characterization of DOM protein of a healthy and girdled forest (Schulze et al., 2004). The methodology may also have a potential in identifying novel uncultured 5
organisms which can be important in bio-degradation of environmental spills.
Acknowledgements. I would like to thank G. Gleixner, K. Kaiser, A. Prokushkin, and K. Kalbitz
for donating DOM samples, and I am very grateful to E.-D. Schulze for critical comments on the manuscript.
References
10
Aebersold, R. and Mann, M.: Mass spectrometry-based proteomics, Nature, 422, 198–207, 2003.
Almendros, G., Frund, R., Gonzalez-Vila, F. J., Haider, K. M., Knicker, H., and Ludemann, H. D.: Analysis of 13C and 15N CPMAS NMR-spectra of soil organic matter and composts, FEBS Lett., 282, 119–121, 1991.
15
B ´aldi, A.: Using higher taxa as surrogates of species richness: a study based on 3700 Coleoptera, Diptera and Acri in Central-Hungarian reserves, Basic and Applied Ecology, 4, 589–593, 2003.
Cagney, G., Amiri, S., Premawaraadena, T., Lindo, M., and Emili, M.: In silico proteome analysis to facilitate proteomics experiments using mass spectrometry, Proteome Science, 1, 1–15,
20
2003.
Chappell, K. R. and Goulder, R.: Enzymes as river pollutants and the response of native epilithic extracellular-enzyme activity, Environmental Pollution, 86, 161–169, 1994.
Ellenberg, H., Mayer, R., and Schauermann, J.: Okosystemforschung – Ergebnisse des¨ Sollingprojekts, Stuttgart, Ulmer Verlag, 1986.
25
Ellwood, M. D. F. and Foster, W. A.: Doubling the estimate of invertebrate biomass in a rainforest canopy, Nature, 429, 459–551, 2004.
Gao, J., Kim, S.-R., Chung, Y.-Y., Lee, J. M., and An, G.: Developmental and environmental regulation of two ribosomal protein genes in tobacco, Plant Mol. Biol., 25, 761–770, 1994.
BGD
1, 825–853, 2004 Protein analysis in dissolved organic matter W. Schulze Title Page Abstract Introduction Conclusions References Tables Figures J I J I Back CloseFull Screen / Esc
Print Version Interactive Discussion
EGU
Gleixner, G., Czimczik, C., Kramer, C., L ¨uhker, B., and Schmidt, M. W. I.: Plant compounds and their turnover and stability as soil orgainc matter, In: Global Biogeochemical cycles in the climate system, edited by: Schulze, E. D., Heimann, M., Harrison, S., Holland, E., Lloyd, L., Prentice, I. C., and Schimel, D., San Diego, Academic Press, 201–216, 2001.
Habermann, B., Oegerma, J., Sunyaev, S., and Shevchenko, A.: The power and the
limita-5
tions of cross-species protein identification by mass spectrometry-driven sequence similarity searches, Mol. Cell. Proteomics, 3, 238–249, 2004.
Her, N., Amy, G., McKnight, D., Sohn, J., and Yoon, Y.: Characterization of DOM as a function of MW by fluorescence EEM and HPLC-SEC using UVA, DOC, and fluorescence detection, Water Research, 2003, 17, 4295–4303, 2003.
10
Ishihama, Y., Rappsilber, J., Andersen, J. S., and Mann, M.: Microcolumns with self-assembled particle frits for proteomics, J. Chromatogr. A, 979, 233–239, 2002.
Kaiser, K., Guggenberger, G., Haumaer, L., and Zech, W.: Seasonal variations in the chemical composition of dissolved organic matter in organic forest floor layer leachates of old-growth Scots pine (Pinus sylvestris L.) and European beech (Fags sylvatica L.) stands in
northeast-15
ern Bavaria, Germany, Biogeochem., 55, 103–143, 2001.
Keil, R. and Kirchman, D. L.: Dissolved combined amino acids: Chemical form and utilization by marine bacteria, Limnology and Oceanography, 38, 1256–1270, 1993.
Kracht, O. and Gleixner, G.: Isotope analysis of pyrolysis products from Sphagnum peat and dissolved organic matter from bog water, Organic Geochemistry, 31, 645–654, 2000.
20
Leckie, S. E., Prescott, C. E., Grayston, S. J., Neufeld, J. D., and Mohn, W. W.: Characterization of humus microbial communities in adjacent forest types that differ in nitrogen availability, Microb. Ecol., 48, 29–40, 2004.
Lee, J. J., Park, R. D., Kim, Y. W., Shim, J. H., Chae, D. H., Rim, Y. S., Sohn, B. K., Kim, T. H., and Kim, K. Y.: Effect of food waste compost on microbial population, soil enzyme activity
25
and lettuce growth, Bioresour. Technol., 93, 21–28, 2004.
Lipson, D. A., Schadt, C. W., and Schmidt, S. K.: Changes in soil microbial community structure and function in an alpine dry meadow following spring snow melt, Microb. Ecol., 43, 307–314, 2002.
Liston, A., Robinson, W. A., and Oliphant, J. M.: Length variation in the nuclear ribosomal
30
DNA internal transcribed spacer region of non-flowering seed plants, Systematic Botany, 21, 109–120, 1996.
BGD
1, 825–853, 2004 Protein analysis in dissolved organic matter W. Schulze Title Page Abstract Introduction Conclusions References Tables Figures J I J I Back CloseFull Screen / Esc
Print Version Interactive Discussion
EGU
broiler litter with reference to the microbial composition as assessed by using 16S rRNA and functional gene markers, Apppl. Environ. Microbiol., 62, 901–908, 2003.
Michalzik, B. and Matzner, E.: Dynamics of dissolved organic nitrogen and carbon in a Central European Norway spruce ecosystem, Eur. J. Soil Sci., 50, 579–590, 1999.
Misic, C., Povero, P., and Fabiano, M.: Ectoenzymatic ratios in relation to particulate organic
5
matter distribution (Ross Sea, Antarctica), Microb. Ecol., 44, 224–234, 2002.
Olsen, J. V., Ong, S.-E., and Mann, M.: Trypsin cleaves exclusively C-terminal to arginine and lysine residues, Mol. Cell. Proteomics, 3, 608–614, 2004.
Perkins, D. N., Pappin, D. J. C., Creasy, D. M., and Cottrell, J. S.: Probability-based protein iden-tification by searching sequence databases using mass spectrometry data, Electrophoresis,
10
20, 3551–3567, 1999.
Priha, O., Grayston, S. J., Pennanen, T., and Smolander, A.: Microbial activities related to C and N cycling and microbial community structure in the rhizospheres of Pinus sylvestris, Picea abies and Betula pendula seedlings in an organic and mineral soil, FEMS Microbiol. Lett., 30, 187–199, 1999.
15
Rappsilber, J. and Mann, M.: What does it mean to identify a protein in proteomics, Trends Biochem. Sci., 27, 74–78, 2002.
Rappsilber, J., Ryder, U., Lamon, A. I., and Mann, M.: Large-scale proteomic analysis of the human spliceosome, Genome Res., 12, 1231–1245, 2002.
Rappsilber, J., Ishihama, Y., and Mann, M.: Stop and go extraction tips for matrix-ssisted laser
20
desorption/ionization, nanoelectrospray, and LC/MS sample pretreatment in proteomics, Anal. Chem., 75, 663–670, 2003.
Rich, J. J., Heichen, R. S., Bottomley, P. J., Cromack, K., and Myrold, D. D.: Community compo-sition and functioning of denitrifying bacteria from adjacent meadow and forest soils, Apppl. Environ. Microbiol., 69, 5974–5982, 2003.
25
Ritchie, N. J., Schutter, M. E., Dick, R. P., and Myrold, D. D.: Use of length heterogeneity PCR and fatty acid methyl ester profiles to characterize microbial communities in soil, Apppl. Environ. Microbiol., 66, 1668–1675, 2000.
Roepstorff, P. and Fohlman, J.: Proposal for a common nomenclature for sequence ions in mass spectra of peptides, Biomed. Mass Spectrom., 11, 601, 1984.
30
Schulze, W., Gleixner, G., Kaiser, K., Guggenberger, G., Mann, M., and Schulze, E. D.: A proteomic fingerprint of dissolved organic carbon and soil particles, Oecologia, in press, doi:10.1007/s00442-004-1698-9, 2004.
BGD
1, 825–853, 2004 Protein analysis in dissolved organic matter W. Schulze Title Page Abstract Introduction Conclusions References Tables Figures J I J I Back CloseFull Screen / Esc
Print Version Interactive Discussion
EGU
Sessitsch, A., Weilharter, A., Gerzabek, M. H., Kirchmann, H., and Kandeler, E.: Microbial population structures in soil particle size fractions of a long-term fertilizer field experiment, Apppl. Environ. Microbiol., 67, 4215–4224, 2001.
Shevchenko, A., Wilm, M., Vorm, O., and Mann, M.: Mass spectrometric sequencing of proteins silver-stained polyacrylamide gels, Anal. Chem., 68, 850–858, 1996.
5
Shevchenko, A., Sunyaev, S., Loboda, A., Shevchenko, A., Bork, P., Ens, W., and Standing, K. G.: Charting the proteomes of organisms with unsequenced genomes by MALDI-quadrupole time-of-flight mass spectrometry and BLAST homology searching, Anal. Chem., 73, 1917– 1926, 2001.
Singh, S. K. and Rai, J. P.: Soil microbial population and enzyme activity related to grazing
10
pressure in alpine meadows of Nanda Devi Biosphere Reserve, J. Environ. Biol., 25, 103– 107, 2004.
Steger, K., Jarvis, A., Smars, S., and Sundh, I.: Comparison of signaturelipid methods to de-termine microbial community structure in compost, J. Microbiol. Meth., 55, 371–382, 2003. Stemmer, M., Gerzabek, M. H., and Kandeler, E.: Organc matter and enzyme activity in
15
particle-size fractions of soils obtained after low-energy sonication, Soil Biol. Biochem., 30, 9–17, 1998.
Suzuki, S., Kogure, K., and Tanoue, E.: Immunochemical detection of dissolved proteins and their source bacteria in marine environments, Marine Ecology Progress Series, 158, 1–9, 1997.
20
Tanoue, E.: Characterization of the particulate protein in Pacific surface waters, J. Marine Res., 54, 967–990, 1996.
Tanoue, E., Ishii, M., and Midorikawa, T.: Discrete dissolved and particulate proteins in oceanic waters, Limnology and Oceanography, 41, 1334–1343, 1996.
The Arabidopsis Genome Initiative: Analysis of the genome sequence of the flowering plant
25
Arabidopsis thaliana, Nature, 408, 796–816, 2000.
Tyers, M. and Mann, M.: From genomics to proteomics, Nature, 422, 193–197, 2003.
Tyson, G. W., Chapman, J., Hugenholtz, P., Allen, E. E., Ram, R. J., Richardson, P. M., Solovyev, V. V., Rubin, E. M., Rokhsar, D. S., and Banfield, J. F.: Community structure and metabolism through reconstruction of microbial genomes from the environment, Nature, 428,
30
37–43, 2004.
Venter, J. C., Remington, K., Heidelberg, J. F., Halpern, A. L., Rusch, D. B., Eisen, J. A., Wu, D., Paulsen, I., Nelson, K. E., Nelson, W., Fouts, D. E., Levy, S., Knap, A. H., Lomas, M. W.,
BGD
1, 825–853, 2004 Protein analysis in dissolved organic matter W. Schulze Title Page Abstract Introduction Conclusions References Tables Figures J I J I Back CloseFull Screen / Esc
Print Version Interactive Discussion
EGU
Nealson, K., White, O., Peterson, J., Hoffman, J., Parson, R., Baden-Tillson, H., Pfannkoch, C., Rogers, Y.-H., and Smith, H. O.: Environmental genome shotgun sequencing of the Sargasso Sea, Science, 304, 66–74, 2004.
Williamson, N., Biran, P., and Wellington, E. M.: Molecular detection of bacterial and strepto-mycete chitinases in the environment, Antonie Van Leeuwenhook, 78, 315–321, 2000.
5
Wilmes, P. and Bond, P. L.: The application of two-dimensional polyacrylamide gel elec-trophoresis and downstream analyses to a mixed community fo prokaryotic microorganisms, Env. Microbiol., 6, 911–920, 2004.
Yamada, N. and Tanoue, E.: Detection and partial characterization of dissolved glycoproteins in oceanic waters, Limnology and Oceanography, 48, 1037–1048, 2003.
BGD
1, 825–853, 2004 Protein analysis in dissolved organic matter W. Schulze Title Page Abstract Introduction Conclusions References Tables Figures J I J I Back CloseFull Screen / Esc
Print Version Interactive Discussion
EGU
List of Figures:
Figure 1: Phylogenetic distribution of proteins extracted from decomposing plant material
at different layers ranging from a green moss layer to the FH horizon. Areas of the pie
charts represent the number of proteins identified.
Figure 2: Phylogenetic distribution of proteins identified in different sources of surface
water, such as a peat bog lake, a creek in a bog area, a stream at low and high water and
rain collected in a rain collector. Areas of the pie charts represent the number of proteins
identified.
18
Fig. 1. Phylogenetic distribution of proteins extracted from decomposing plant material at differ-ent layers ranging from a green moss layer to the FH horizon. Areas of the pie charts represffer-ent the number of proteins identified.
BGD
1, 825–853, 2004 Protein analysis in dissolved organic matter W. Schulze Title Page Abstract Introduction Conclusions References Tables Figures J I J I Back CloseFull Screen / Esc
Print Version Interactive Discussion
EGU
List of Figures:
Figure 1: Phylogenetic distribution of proteins extracted from decomposing plant material
at different layers ranging from a green moss layer to the FH horizon. Areas of the pie
charts represent the number of proteins identified.
Figure 2: Phylogenetic distribution of proteins identified in different sources of surface
water, such as a peat bog lake, a creek in a bog area, a stream at low and high water and
rain collected in a rain collector. Areas of the pie charts represent the number of proteins
identified.
18
Fig. 2. Phylogenetic distribution of proteins identified in different sources of surface water, suchas a peat bog lake, a creek in a bog area, a stream at low and high water and rain collected in a rain collector. Areas of the pie charts represent the number of proteins identified.
BGD
1, 825–853, 2004 Protein analysis in dissolved organic matter W. Schulze Title Page Abstract Introduction Conclusions References Tables Figures J I J I Back CloseFull Screen / Esc
Print Version Interactive Discussion
EGU
Figure 3: (A) Phylogenetic distribution of proteins identified from DOM leachates of
different soil types. (B) Detailed taxonomic view of the bacterial proteins of in DOM of the
beech forest (cambisol) and pine forest (arenosol). Areas of the pie charts represent the
number of proteins identified.
Figure 4: Phylogenetic distribution of proteins identified from soil leachates along a
transect in a beech forest on cambisolic soil. The distance between two samples was 25
m. Areas of the pie charts represent the number of proteins identified.
19
Fig. 3. (A) Phylogenetic distribution of proteins identified from DOM leachates of different soiltypes. (B) Detailed taxonomic view of the bacterial proteins of in DOM of the beech forest
(cambisol) and pine forest (arenosol). Areas of the pie charts represent the number of proteins identified.
BGD
1, 825–853, 2004 Protein analysis in dissolved organic matter W. Schulze Title Page Abstract Introduction Conclusions References Tables Figures J I J I Back CloseFull Screen / Esc
Print Version Interactive Discussion
EGU
Figure 3: (A) Phylogenetic distribution of proteins identified from DOM leachates of
different soil types. (B) Detailed taxonomic view of the bacterial proteins of in DOM of the
beech forest (cambisol) and pine forest (arenosol). Areas of the pie charts represent the
number of proteins identified.
Figure 4: Phylogenetic distribution of proteins identified from soil leachates along a
transect in a beech forest on cambisolic soil. The distance between two samples was 25
m. Areas of the pie charts represent the number of proteins identified.
19
Fig. 4. Phylogenetic distribution of proteins identified from soil leachates along a transect in abeech forest on cambisolic soil. The distance between two samples was 25 m. Areas of the pie charts represent the number of proteins identified.
BGD
1, 825–853, 2004 Protein analysis in dissolved organic matter W. Schulze Title Page Abstract Introduction Conclusions References Tables Figures J I J I Back CloseFull Screen / Esc
Print Version Interactive Discussion
EGU
Figure 5: The number of phylogenetic groups distinguished and the number of total
proteins identified for each sample analyzed. The number of phylogenetic groups
distinguished does not depend on the number of proteins identified.
Figure 6: Size distribution of identified proteins from DOM leachates of a beech forest on
rendzic leptosol. Size distributions are shown for two different soil depths (5 cm and 90
cm) and seasons (summer and winter). Proteins from all organisms were included in the
size distribution.
20
Fig. 5. The number of phylogenetic groups distinguished and the number of total proteinsidentified for each sample analyzed. The number of phylogenetic groups distinguished does not depend on the number of proteins identified.
BGD
1, 825–853, 2004 Protein analysis in dissolved organic matter W. Schulze Title Page Abstract Introduction Conclusions References Tables Figures J I J I Back CloseFull Screen / Esc
Print Version Interactive Discussion
EGU
Figure 5: The number of phylogenetic groups distinguished and the number of total
proteins identified for each sample analyzed. The number of phylogenetic groups
distinguished does not depend on the number of proteins identified.
Figure 6: Size distribution of identified proteins from DOM leachates of a beech forest on
rendzic leptosol. Size distributions are shown for two different soil depths (5 cm and 90
cm) and seasons (summer and winter). Proteins from all organisms were included in the
size distribution.
20
Fig. 6. Size distribution of identified proteins from DOM leachates of a beech forest on rendzicleptosol. Size distributions are shown for two different soil depths (5 cm and 90 cm) and seasons (summer and winter). Proteins from all organisms were included in the size distribution.
BGD
1, 825–853, 2004 Protein analysis in dissolved organic matter W. Schulze Title Page Abstract Introduction Conclusions References Tables Figures J I J I Back CloseFull Screen / Esc
Print Version Interactive Discussion
EGU Figure 7: Functional classification of the bacterial proteins identified from leachates of a
beech forest on rendzic leptosol for two different soil depths (5 cm and 90 cm) and seasons (summer and winter).
21
Fig. 7. Functional classification of the bacterial proteins identified from leachates of a beech
forest on rendzic leptosol for two different soil depths (5 cm and 90 cm) and seasons (summer and winter).