HAL Id: hal-00303964
https://hal.archives-ouvertes.fr/hal-00303964
Submitted on 8 Feb 2008HAL is a multi-disciplinary open access
archive for the deposit and dissemination of sci-entific research documents, whether they are pub-lished or not. The documents may come from teaching and research institutions in France or abroad, or from public or private research centers.
L’archive ouverte pluridisciplinaire HAL, est destinée au dépôt et à la diffusion de documents scientifiques de niveau recherche, publiés ou non, émanant des établissements d’enseignement et de recherche français ou étrangers, des laboratoires publics ou privés.
Spectral UV measurements in Austria from 1994 to
2006: investigations of short- and long-term changes
S. Simic, P. Weihs, A. Vacek, H. Kromp-Kolb, M. Fitzka
To cite this version:
S. Simic, P. Weihs, A. Vacek, H. Kromp-Kolb, M. Fitzka. Spectral UV measurements in Austria from 1994 to 2006: investigations of short- and long-term changes. Atmospheric Chemistry and Physics Discussions, European Geosciences Union, 2008, 8 (1), pp.2403-2428. �hal-00303964�
ACPD
8, 2403–2428, 2008 SUV Austria S. Simic et al. Title Page Abstract Introduction Conclusions References Tables Figures ◭ ◮ ◭ ◮ Back CloseFull Screen / Esc
Printer-friendly Version Interactive Discussion
Atmos. Chem. Phys. Discuss., 8, 2403–2428, 2008 www.atmos-chem-phys-discuss.net/8/2403/2008/ © Author(s) 2008. This work is distributed under the Creative Commons Attribution 3.0 License.
Atmospheric Chemistry and Physics Discussions
Spectral UV measurements in Austria
from 1994 to 2006: investigations of
short- and long-term changes
S. Simic, P. Weihs, A. Vacek, H. Kromp-Kolb, and M. Fitzka
Institute of Meteorology, University of Natural Resources and Applied Life Sciences (BOKU), Vienna, Austria
Received: 3 January 2008 – Accepted: 6 January 2008 – Published: 8 February 2008 Correspondence to: S. Simic ([email protected])
ACPD
8, 2403–2428, 2008 SUV Austria S. Simic et al. Title Page Abstract Introduction Conclusions References Tables Figures ◭ ◮ ◭ ◮ Back CloseFull Screen / Esc
Printer-friendly Version Interactive Discussion
Abstract
Influences of atmospheric variability on short- and long-term changes of spectral UV irradiance measured at the Sonnblick observatory (47.03 N, 12.57 E, 3106 m) during the period from 1994 to 2006 is studied. Measurements are performed with a Brewer ozone single spectrophotometer and with a Bentham DM150 spectroradiometer
(dou-5
ble monochromator).
The influence of ozone, albedo and clouds on UV variability is evaluated separately using 10-year climatology. It is found that the effect of total ozone on short-term vari-ability of UV irradiance at 305 nm can be more than 200% and on average more than 50%. Clouds can cause variability of 150% or more and on average 35%. Variability
10
caused by albedo is maximum 32%. Long-term trends are investigated for the time period from 1994 to 2006 using the non-parametric Mann-Kendall trend test. Signifi-cant downwards trends (99% confidence level) were found for solar zenith angle 55◦at wavelengths from 305 nm to 324 nm and CIE.
1 Introduction
15
The intensity of UV radiation reaching the earth’s surface is influenced by the concen-tration of stratospheric ozone as well as by further atmospheric parameters, such as clouds, aerosols and surface albedo. Knowledge of spectral UV irradiance and its de-pendence on these parameters, which may change in the future, are prerequisites to quantitatively understand and estimate future UV radiation.
20
Increase of UV radiation during the last decades is reported where a decrease of stratospheric ozone has been observed (Kerr and McElroy, 1993; Zerefos et al., 1997, 2001; Bartlett and Web, 2000). The magnitude of this change and their causes are, however uncertain calling for more detailed investigations of the influence of clouds, albedo, and other atmospheric parameters on UV radiation (Kerr et al., 2003; Bais et
25
ACPD
8, 2403–2428, 2008 SUV Austria S. Simic et al. Title Page Abstract Introduction Conclusions References Tables Figures ◭ ◮ ◭ ◮ Back CloseFull Screen / Esc
Printer-friendly Version Interactive Discussion
Several publications focus on the detection of long-term changes in UV doses (Her-man et al., 1996; Seckmeyer et al., 1997; Weatherhead et al., 1997; Lindfors et al., 2003). The first spectrally resolved routine measurements started in the 1990s, and studies on long-term changes in spectral UV irradiance are hampered by the limited number of years of available data (Zerefos et al., 1997; Lakkala et al., 2003; Glandorf
5
et al., 2005).
Clouds can cause strong variability of UV radiation and limit the detectability of ozone-induced trends in UV radiation (Glandorf et al., 2005; den Outer et al., 2005). Change of cloud cover caused by change of global climate is especially important for estimation of future UV radiation. Reuder et al. (2001) show that reduced cloud cover
10
during summer can increase UV radiation up to 15%.
Albedo is of great importance, especially in snow-covered mountainous regions. UV-irradiance is strongly enhanced with snow covered ground due to multiple reflections between ground and atmosphere, even more under overcast-sky conditions because of increased atmospheric backscattering through clouds. McKenzie et al. (1998) showed
15
that, due to snow, UV-B increased by about 30% under clear sky and about 70% under cloudy sky conditions at Lauder, New Zealand. Kylling and Mayer (2001a) investigated the influence of the snowline on UV-irradiance at 340 nm, studying snow-free conditions and then moving the snowline from 1000 to 0 m. With decreasing snowline, enhance-ment in UV of 23–27% for cloudless sky was obtained, while for overcast conditions
20
the enhancement was around 40–60%.
Different methods are available in the literature that separate the different influencing factors causing short– and long-term changes in UV radiation (Fioletov et al., 2001; Kylling et al., 2001b; Arola et al., 2003). Earlier investigations show the effect of ozone on UV radiation, whereas analyzing the influence of clouds and albedo is more difficult.
25
Clouds show strong variability, and measurements of albedo which may be used as model input data are hardly available.
In this study, the influence of clouds, ozone, and surface albedo on spectral UV ra-diation at the Sonnblick observatory (3106 m) is investigated using continuous spectral
ACPD
8, 2403–2428, 2008 SUV Austria S. Simic et al. Title Page Abstract Introduction Conclusions References Tables Figures ◭ ◮ ◭ ◮ Back CloseFull Screen / Esc
Printer-friendly Version Interactive Discussion
UV-irradiance measurements and model calculations. The influence of the different factors on short-term UV variability is shown using the available UV data sets. The method to separate the effects of clouds, ozone, and surface albedo is adapted from Arola et al. (2003) who used this method to analyse measurements at two stations, at Sodankyl ¨a, Finland (67◦N) and at Thessaloniki, Greece (40◦N). Spectral UV irradiance
5
time series are analyzed for possible trends. Measurements at Sonnblick observatory starting 1994 represent the longest time series of spectral UV irradiance data in Aus-tria.
2 Method
Monitoring of spectral UV radiation and total ozone at Sonnblick observatory in Austria
10
is performed since 1993. The Sonnblick observatory (47.05◦N, 12.95◦E) is in south-west Austria at the border between Salzburg and Carinthia on a mountain top at 3106 m altitude. It is surrounded by rock faces on the northern side and by a glacier on the southeastern side. The area shows a very pronounced topography. The valley ad-jacent to Sonnblick is 1300 m lower than the summit. Nearby summits in this region
15
are at approximately the same altitude. 16% of the surrounding area is covered with glaciers and in winter 88% of the surface is covered with snow under the assumption that no snow covers the rock faces.
The Sonnblick observatory is a station of the Austrian Weather Office that monitors synoptic and climatological meteorological data. They also record the cloud and ground
20
surface conditions. The cloud fraction above and below the observatory as well as the cloud type are visually observed six times a day. The snowfall and the depth of the snow cover are measured once a day and the snowline is observed, and these data are used in this study.
ACPD
8, 2403–2428, 2008 SUV Austria S. Simic et al. Title Page Abstract Introduction Conclusions References Tables Figures ◭ ◮ ◭ ◮ Back CloseFull Screen / Esc
Printer-friendly Version Interactive Discussion
2.1 Instrumentation and measurements
Spectral UV measurements at Sonnblick observatory have been performed with a Brewer spectrophotometer (single monochromator) since 1993 and a Bentham DM150 spectroradiometer (double monochromator) since 1997. The Brewer is used to mea-sure global UV irradiance in the spectral range from 290–325 nm using a step width of
5
0.5 nm and total column ozone. Two independent calibrations are performed on a reg-ular basis (1–2 months) with a portable 50 W lamp obtained from SCI-TEC company and with a self-built portable 1000 W lamp-assembly which is calibrated with another NIST (National Institute of Standards and Technology) calibrated 1000 W lamp in our laboratory. The Bentham spectroradiometer is used to measure global UV irradiance
10
in the spectral range 280–500 nm with a step width of 0.5 nm. It is calibrated regularly with the self-built 1000 W lamp-assembly, a NIST calibrated 1000 W lamp and a PTB (Physikalisch-Technische Bundesanstalt, Germany) calibrated 1000 W lamp.
2.2 Short-term changes in UV-B irradiances
The analysis is based on UV irradiance measurements, and the radiative transfer
15
model is a tool to estimate the effects of the contributing factors on the observed vari-ability of UV irradiance. Simulations were carried out with the radiative transfer model SDISORT developed by Stamnes et al. (1988) to divide the influence of ozone, surface albedo, aerosols and clouds on UV variability. In a first step, model calculations of the actual input data solar zenith angle, total column ozone, surface albedo, clouds and
20
aerosols are performed to reconstruct the actually measured data of the Brewer. Cal-culations are performed for constant solar zenith angle 63±2◦for the entire period from 1994 to 2003. Then model calculations using climatological input data of the same period are performed. The daily climatology of each input variable is estimated on the basis of the 10-year data.
25
The influence of a specific parameter X on the variability of UV radiation is then estimated as the quotient of the modelled radiation using the actual value of parameter
ACPD
8, 2403–2428, 2008 SUV Austria S. Simic et al. Title Page Abstract Introduction Conclusions References Tables Figures ◭ ◮ ◭ ◮ Back CloseFull Screen / Esc
Printer-friendly Version Interactive Discussion
X and climatological data of the remaining variables and the modelled radiation using climatic data of all variables, including parameter X. The amplitude of each parameter is calculated using Eq. (1)
Ampl. = monthly max. of all years−monthly min. of all years
monthly mean over all years (1)
With this definition, the amplitude can be regarded as the maximum possible
vari-5
ability caused by the parameter X. This determining quantity is computed for each influencing parameter. The standard deviation is calculated and regarded the repre-sentative quantity for the mean variability.
2.2.1 Model input data
Ozone
10
Daily mean of total column ozone from Brewer measurements are input data to reconstruct the measured UV data. The daily climatology of ozone is calculated as the average of the ozone measurements from 1994 to 2003. To further reduce the high variability in the daily mean values, a moving-average filter with 13 day period (day±6)
15
is applied.
Albedo
An algorithm is introduced that uses routine observations of snow condition (snow
20
height, time since last snowfall) and snow line from the Austrian Weather Service to estimate the effective surface albedo in the UV range on a daily basis.
Figure 1 shows the average enhancements of irradiance at 305 nm with decreasing snowline for clear-sky and overcast conditions. The ordinate shows the quotient of the irradiance at different snowlines and the mean irradiance at a snowline of 3000 m. For
ACPD
8, 2403–2428, 2008 SUV Austria S. Simic et al. Title Page Abstract Introduction Conclusions References Tables Figures ◭ ◮ ◭ ◮ Back CloseFull Screen / Esc
Printer-friendly Version Interactive Discussion
clear sky conditions and at snowline of 800 m this quotient is 1.24 (±0.04) and at snow-line 1500 m it is 1.14 (±0.03). Cloudiness enhances the influence of the albedo due to multiple reflections between surface and lower bond of the clouds. 600 measurements with 8/8 cloud cover are included in Fig. 1 to represent overcast conditions. Under 8/8 cloud cover, UV irradiance at 305 nm is enhanced by a factor of 1.7 when the snowline
5
is 800 m instead of 3000 m.
The “effective” albedo that affects the surface UV irradiance is an averaged albedo of the surrounding area. Regression analysis delivered parameterisation of the “effective” albedo, A according to Eq. (2)
A=0.659−2.04·10−4
·G+4.97·10−3·N −3.23·10−3·T (2)
10
In Eq. (2), G is the snow line (in m), N is the depth of the fresh fallen snow (in cm) and T is the time since the last snowfall (in days). Fresh fallen snow increases the effective albedo whereas the albedo decreases with increasing snowline and days after the snowfall. 500 cases are included developing regression Eq. (2). The explained variance of this parameterisation is 70%, and the effective albedo varies
15
from 0.02 to 0.89. Figure 2 shows calculated values of the effective albedo at Sonnblick observatory. Climatological mean values of the albedo determined for the 10 year period are 0.3–0.6 during winter and spring and 0.09–0.25 during summer. Effective albedo of 0.63–0.78 determined for snowline 800 m is comparable to the model calculations presented by Weihs et al. (2000). Rengarajan et al. (2000) measured the
20
albedo at the Sonnblick observatory in winter. Their experimentally determined values in the range from 0.73 to 0.78 are well comparable to the albedo values determined in this study at low snow line 800 m.
Aerosols
25
Observations of the direct solar radiation with Brewer spectrophotometer at five channels 306.3 nm, 310.1 nm, 313.5 nm, 316.8 nm and 320.1 nm were used for the aerosol optical depth (AOD) calculation. Figure 3 shows monthly means of the aerosol
ACPD
8, 2403–2428, 2008 SUV Austria S. Simic et al. Title Page Abstract Introduction Conclusions References Tables Figures ◭ ◮ ◭ ◮ Back CloseFull Screen / Esc
Printer-friendly Version Interactive Discussion
optical depth at 306.3 nm in the period from 1997 to 2002. Optical depths of aerosols at the Sonnblick are 0.03–0.08. Using this range, the calculated variation of UV irradiation is about 3% at 305 nm (Weihs et al., 1999). These results underline the fact that aerosols have a small influence on UV irradiance in high mountainous regions.
5
Clouds
Model calculations in presence of clouds use the actually observed cloud cover. Cloud transmission data measured with Bentham DM150 spectrometer and cloud observations are used in the analysis. Ratios of measured UV intensities and modelled
10
clear sky values (i.e. the cloud modification factor) for the actual zenith angle and ozone amount are used to analyze the dependence of some defined UV-B and UV-A wavelength intervals on cloud amount. The study delivers dependencies of the cloud modification factor on total cloud amount, cloud type, wavelength, solar zenith angle and ground albedo, which are used in the present investigation (Simic et al., 2006).
15
2.2.2 Comparison of measured and calculated absolute UV levels
Calculations of the UV irradiation are performed to test whether they can reproduce the actual irradiance measurements under clear sky condition. In Fig. 4 the ratios of measured and modelled UV irradiation at 305 nm and solar zenith angle 63◦are shown for the time period 1994–2003. In 95% of the investigated cases in the time period from
20
1994 to 2003, the calculated UV irradiations are maximum 12% higher and 8% lower than actually measured irradiations.
2.3 Long-term changes
Long-term changes are calculated for different wavelengths (305 nm, 310 nm, 315 nm, 324 nm and CIE) and solar zenith angles (45◦, 55◦ and 65◦). Monthly mean values
25
pe-ACPD
8, 2403–2428, 2008 SUV Austria S. Simic et al. Title Page Abstract Introduction Conclusions References Tables Figures ◭ ◮ ◭ ◮ Back CloseFull Screen / Esc
Printer-friendly Version Interactive Discussion
riod from January 1994 to December 2006 except for months with too few data or too high cloud cover. The monthly climatological mean values where obtained by aver-aging every month over the period of investigation. The relative departures from the long-term mean values where computed by comparing monthly mean values to the climatological mean values of the respective month. The time series were checked for
5
the existence of trends using the non-parametric Mann-Kendall (MK) trend-test (Mann, 1945; Kendall, 1975). The results of the MK test were tested against the hypothesis of no detectable trend, i.e. the data being normally distributed. This was done at several significance levels from α=0.1 down to α=0.001, where α is the probability of reject-ing the alternative hypothesis erroneously. The magnitudes of the underlyreject-ing trends
10
were estimated using two methods of linear regression: the least-square method and the non-parametric Theil-Sen slope estimate (Hollander and Wolfe, 1999), the latter being less sensitive to outliers and missing values, which may occur in periods of in-strument maintenance and calibration and harsh environmental conditions. The results are shown in percent per decade.
15
To complement the spectra and to enable data filtering for various atmospheric pa-rameters and conditions, detailed 3-hourly cloud and snow observations from the Aus-trian Weather Service at Sonnblick observatory were included and appended to the appropriate UV-measurements. All spectra were checked and corrected with the SHI-Crivm algorithm by Slaper (2002). Additionally, the spectrums were CIE-weighted and
20
integrated.
It was decided to check for trends in clear-sky spectra only, which means that situa-tions with total cloud cover greater than three eighths were omitted. Further reducing the maximum allowed cloud cover would have considerably lessened the number of available data-sets. Due to the decreased variability in clear-sky irradiances as
op-25
posed to all-sky conditions, significant trends are supposed to be more easily detected in relatively short time series, as proposed by Glandorf et al. (2005).
ACPD
8, 2403–2428, 2008 SUV Austria S. Simic et al. Title Page Abstract Introduction Conclusions References Tables Figures ◭ ◮ ◭ ◮ Back CloseFull Screen / Esc
Printer-friendly Version Interactive Discussion
3 Results and discussion
3.1 Short-term changes
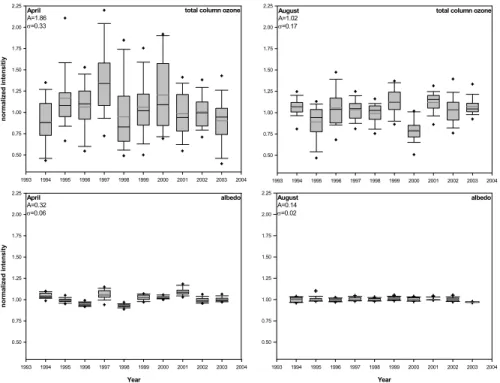
The influences of total column ozone and albedo on 305 nm irradiance during the pe-riod 1994–2003 is shown in Fig. 5 for April (left column) and August (right column). The ordinate shows the ratio of actual data and daily climatological data. All calculations are
5
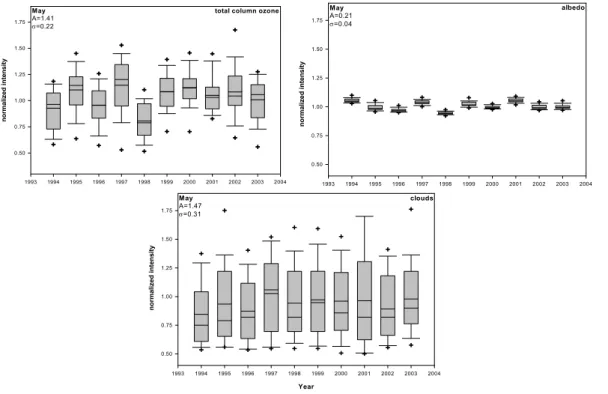
performed for a constant solar zenith angle of 63±2◦for the whole period from 1994 to 2003. Amplitude and standard deviation, as described above, are included. Maximum effect of total ozone on short-term variability of UV radiation at 305 nm is 186% in April and 102% in August. Albedo induced maximum variability is 32% in April and 14% in August. Figure 6 shows the evaluation for May, additionally considering the effects of
10
changing cloud cover. On a short time scale, clouds can affect the irradiance at 305 nm by maximum 147%.
Model calculations are performed for each month. Table 1 summarizes the results obtained at 305 nm for the amplitude representing maximum variability and for standard deviation representing mean variability: Ozone can affect UV-irradiance on a short
15
time scale by up to about 200% (mean variability up to about 50%). Clouds can cause variability of UV irradiance by up to about 150% (typical mean variability of about 30%). Aledo has the greatest influence on the variability of UV irradiance in April. During summer, clouds contribute to the major part of variability whilst ozone dominates during spring. This is explained by strong variability of total column ozone during winter and
20
spring and enhanced cumulus convection during summer.
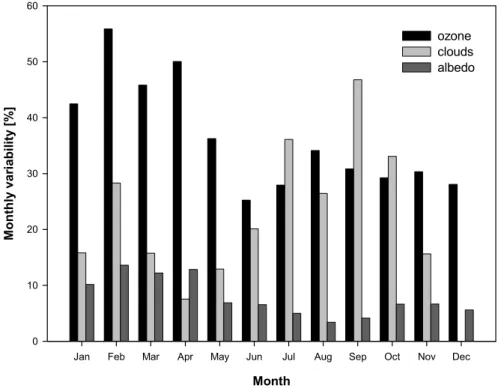
Figure 7 shows the maximum variability in monthly mean values of 305 nm irradiance caused by total column ozone, clouds and albedo. The effect of ozone on short-term variability of monthly mean irradiance can be more than 50% in spring whereas the effect of clouds is largest during summer and early autumn. Variability caused by
25
albedo ranges from 3% to 13%. Investigations of Arola et al, 2003 show for the station Sodankyl ¨a (67◦N) in Finland that the effect of total ozone on short-term variability of monthly mean UV irradiance at 305 nm can be almost 100%. The greater effect of
ACPD
8, 2403–2428, 2008 SUV Austria S. Simic et al. Title Page Abstract Introduction Conclusions References Tables Figures ◭ ◮ ◭ ◮ Back CloseFull Screen / Esc
Printer-friendly Version Interactive Discussion
ozon found in arctic station Sodankyl ¨a may be expected due to the strong interannual ozon variability. Variability caused by albedo in May in Sodankyl ¨a is 21% (average at monthly level 7%) and 32% (average at monthly level 6%) is found at the Sonnblick observatory. Thus variability caused by albedo at both stations is in the same range.
3.2 Long-term changes
5
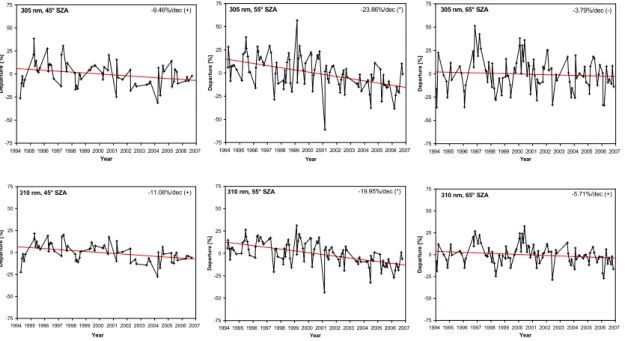
Figure 8 show relative departures of UV radiance from climatological monthly mean values. Wavelengths of 305 nm, 310 nm, 324 nm and CIE and solar zenith angles of 45◦, 55◦ and 65◦ are shown for the time period from 1994 to 2006. Data are approx-imated with linear regression lines, and the results are shown in percent per decade. Trends given in the upper right corner are calculated with the Theil-Sen method.
Sym-10
bols in parenthesis indicate the significance of the trend [(−): insignificant (α>0.1), (+): significant (α≤0.1), (*): highly significant (α≤0.01)]. In Table 2, the results of the evalu-ations are summarized. Calculevalu-ations are also performed with the least-square method, and the obtained results coincide well in cases with highly significant trends.
For wavelength 305 nm, downward trend of −9%/dec at solar zenith angle 45◦(90%
15
confidence level) and −24%/dec at 55◦ (99% confidence level) are determined for the period from 1994–2006. The trend is highly significant for solar zenith angle 55◦, where the largest data set is available. Analysis of 310 nm, 315 nm and 324 nm basically delivers a comparable behaviour, however the trends are somewhat smaller, i.e. the regression-line slopes becoming less negative as the wavelength increases. Trends
20
found in CIE integrated monthly mean values consequently show to be less negative than those found at 305 nm but steeper than those at 315 nm and 324 nm.
Decrease of UV irradiance at low wavelength would suggest an increase of strato-spheric ozone during the investigated time period from 1994 to 2006. Total ozone measurements with the Brewer spectrophotometer at the Sonnblick observatory
how-25
ever do not show this trend. In Sodnakyl ¨a, Finland spectral irradiance at 305 nm in April decreases when the time period from 1993 to 2001 is investigated whereas it increases considering the period from 1990 to 1997 (Lakkala et al., 2003).
Investi-ACPD
8, 2403–2428, 2008 SUV Austria S. Simic et al. Title Page Abstract Introduction Conclusions References Tables Figures ◭ ◮ ◭ ◮ Back CloseFull Screen / Esc
Printer-friendly Version Interactive Discussion
gations of long-term variability of monthly mean solar spectral irradiance at 305 nm and 324 nm in Thessaloniki, Greece show positive trends at both wavelengths for the period 1990–2006 (Bais et al., 2007). The investigated time period has a strong in-fluence on the calculated long-term change of spectral UV irradiance at Sonnblick observatory. When spectra measured during the time period from 1994 to 2001 are
5
analysed, mainly positive trends are found for different wavelengths and solar zenith angles (Simic, 2005). Glandorf et al. (2005) evaluated several wavelengths and solar zenith angles of the longest spectral UV irradiance measurements in Europe, in Thes-saloniki and Sodnakyl ¨a. They conclude that even the longest series are too short to show distinct trends due to the large variability of UV irradiance.
10
4 Summary
The influence of ozone, clouds, and surface albedo on spectral UV radiation at the Sonnblick observatory (3106 m) is investigated using continuous spectral UV-irradiance measurements and model calculations. Measurements at Sonnblick observatory start-ing 1994 represent the longest time series of spectral UV irradiance data in Austria and
15
are used in the present investigation.
1. UV irradiance at wavelength 305 nm under clear sky condition is calculated and compared with the actual measurements. In 95% of the investigated cases in the time period from 1994 to 2003, the calculated UV irradiations are maximum 12% higher and 8% lower than actually measured irradiations. Essential for a good
20
correlation of measurement and model is the determination of an effective albeo at the observatory. Determination of an effective albedo uses the snow line, the depth of the fresh fallen snow and the time since the last snowfall.
2. Measurements at Sonnblick observatory at 305 nm show a pronounced influence of snowline on the UV irradiance. Decreasing the snowline from 3000 m to 800 m
ACPD
8, 2403–2428, 2008 SUV Austria S. Simic et al. Title Page Abstract Introduction Conclusions References Tables Figures ◭ ◮ ◭ ◮ Back CloseFull Screen / Esc
Printer-friendly Version Interactive Discussion
enhances the UV irradiance by factor 1.24 for clear sky conditions and by factor 1.7 for 8/8 cloud cover.
3. The effect of total ozone on short-term variability of UV irradiance at 305 nm can be more than 200% (average more than 50%). Clouds can cause variability of 150% or more (average 35%). Maximum variability caused by albedo is 32% in
5
April (average 6%) and 12–15% in the summer moths (average 3%). In sum-mer and autumn, total ozone and clouds strongly influence the variability of UV radiation, whereas in winter and spring ozone has the more pronounced effect. 4. Spectral UV irradiance at 305 nm, 310 nm, 324 nm and CIE and solar zenith
an-gles of 45◦, 55◦ and 65◦ from 1994–2006 is analyzed for possible trends.
Signifi-10
cant downwards trends (99% confidence level) were found for solar zenith angle 55◦ at all wavelengths. At solar zenith angles of 45◦ and 65◦, downwards trends of UV irradiance were found for several wavelengths (90% confidence level).
Acknowledgements. This work has been funded by the Austrian Ministry for Environment and
by the Commission of the European Communities, project “Stratosphere-Climate Links with
15
Emphasis on the UTLS, Scout-03”.
References
Arola, A., Lakkala, K., Bais, A., Kaurola, J., Meleti, C., and Taalas, P.: Factors affecting short-and long-term changes of spectral UV irradiance at two European stations, J. Geophys. Res. D. Atmospheres, 108 (17), 9, 1–11, 2003.
20
Bais, A., Lubin, D., Arola, A., Bernhard, G., Blumthaler, M., Chubarova, N., Erlick, C., Gies, H., Krotkov, N., Lamtz, K., Mayer, B., McKenzie, R., Piacentini, R., Seckmeyer, G., Slusser, J., Zerefos, C., Feister, U., Fioletov, V., Gr ¨obner, J., Kyr ¨o, E., and Slaper, H.: Surface ultraviolet radiation: past, present and future, Scientific assessment of ozone depletion: 2006, 7, 21, 2007.
ACPD
8, 2403–2428, 2008 SUV Austria S. Simic et al. Title Page Abstract Introduction Conclusions References Tables Figures ◭ ◮ ◭ ◮ Back CloseFull Screen / Esc
Printer-friendly Version Interactive Discussion
Bartlett L. M. and Webb A. R.: Changes in ultraviolet radiation in the 1990s: Spectral mea-surements from Reading, England, J. Geophys. Res. D. Atmospheres, 105(D4), 4889–4893, 2000.
den Outer, P. N., Slaper, H., and Tax, R. B.: UV radiation in the Netherlands: Assessing long-term variability and trends in relation to ozone and clouds, J. Geophys. Res., 110, D02203,
5
doi:10.1029/-2004JD004824, 2005.
Fioletov, V., McArthur, B., Kerr, J., and Wardle, D.: Long-term variations of UV-B irradiance over Canada estimated from Brewer observations and derived from ozone and pyranometer measurements, J. Geophys. Res., 106, 23 009–23 028, 2001.
Glandorf, M., Arola, A., Bais, A., and Seckmeyer, G.: Possibilities to detect trends in spectral
10
UV irradiance, Theor. Appl. Climatol., 81, 33–44, 2005.
Herman, J. R., Bhartia, P. K., Kiemke, J., Ahmad, Z., and Larko, D.: UV-B increases (1979– 1992) from decreases in total ozone, Geophys. Res. Let., 23, 2117–2120, 1996.
Hollander, M. and Wolfe, D. A.: Nonparametric statistical methods (2nd Edn.), New York: John Wiley & Sons, 421–423, 1999.
15
Kendall, M. G.: Rank correlation methods, Griffin London, 1975.
Kerr, J. B. and McElroy, C. T.: Evidence for large upward trends of Ultraviolet-B radiation linked to ozone depletion, Science, 262, 1032–1034, 1993.
Kerr, J., Seckmeyer, G. (Lead Authors), A. Bais, Blumthaler, M., Diaz, S. B., Krotkov, N., Lubin, D., Madronich, S., McKenzie, R. L., Sabzipavar, A.-A., and Verdebout, J.: Surface ultraviolet
20
radiation: Past and future, Chapter 5 in Scientific Assessment of Ozone Depletion: 2002, Global Ozone Research and Monitoring Project–Report No. 47, WMO, Geneva, Switzerland, 2003.
Kylling, A. and Mayer, B.: Ultraviolet radiation in partly snow covered terrain: Observations and three-dimensional simulations, Geophys. Res. Let., 28, 3665–3668, 2001a.
25
Kylling, A., Dahlback, A., and Mayer, B.: The effect of clouds and surface albedo on UV irradi-ances at a high latitude site, Geophys. Res. Let., 27, 1411–1414, 2001b.
Lakkala, K., Kyr ¨o, E., and Turunen, T.: Spectral UV measurements at Sodankyl ¨a during 1990– 2001, J. Geophys. Res., 108(D19), 4621, doi:10.1029/- 2002JD003300, 2003.
Lindfors, A. V., Arola, A., Kaurola, J., Taalas, P., and Svenøe, T.: Long-term erythemal UV doses
30
at Sodankyl ¨a estimated using total ozone, sunshine duration, and snow depth, J. Geophys. Res., 108(D16), 4518, doi:10.1029/2002JD003325, 2003.
ACPD
8, 2403–2428, 2008 SUV Austria S. Simic et al. Title Page Abstract Introduction Conclusions References Tables Figures ◭ ◮ ◭ ◮ Back CloseFull Screen / Esc
Printer-friendly Version Interactive Discussion
McKenzie, R. L., Paulin, K. J. and Madronich, S.: Effects of snow cover on UV irradiance and surface albedo: A case study, J. Geophys. Res., 103, 28, 785–792, 1998.
Rengarajan, G., Weihs, P., Simic, S., Mikielewicz, W., Laube, W.: “Albedo measurements sys-tem for UVA and the visible wavelength”, Radiation Protection Dosimetry, 91, No 1–3, 197– 199, 2000.
5
Reuder, J., Dameris, M., and Koepke, P.: Future UV radiation in Central Europe modelled from ozone scenarios, J. Photochem. Photobiol. B. Biol., 61(3), 94–105, 2001.
Seckmeyer, G., Mayer, B., Bernhard, G., Erb, R., Albold, A., J ¨ager, H. and Stockwell, W. R.: New maximum UV irradiance levels observed in Central Europe, Atmos. Environ., 31, 2971– 2976, 1997.
10
Simic, S.: Investigations on the transfer of ultraviolet radiation on the Hoher Sonnblick, doctoral thesis, BOKU Vienna, 2006
Slaper, H.: SHICrivm, available from www.rivm.nl/en/environmentandchemicals/radiation/
nonionisingradiation/shic, 2002.
Stamnes, K., Tsay, S. C., Wiscombe, W., and Jayaweera, K.: Numerically stable algorithmn for
15
discrete-ordinate-method radiative transfer in multible scattering and emitting layered media, Appl. Opt., 27, 2502–2509, 1988.
Weatherhead, E. C., Tiao, G. C., Reinsel, G. C., Frederick, J. E., DeLuisi, J. J., Choi, D. S., and Tam, W. K.: Analysis of long-term behavior of ultraviolet radiation measured by Robinson-Berger meters at 14 sites in the United States., J. Geophys. Res., 102, 8737–8754, 1997.
20
Weihs, P., Scheifinger, H., Rengarajan, G., Simic, S.: “Effect of topography on average surface albedo in the ultraviolet wavelength range”, Applied Optics, 39, 3592–3603, 2000.
Weihs, P., Simic, S., Laube, W., Mikielewicz, W., Rengarajan, G., and Mandl, M.: Character-istics of clear sky surface UV irradiance at high mountain observatory Sonnblick (3106 m altitude), J. Appl. Met., 38(11), 1599–1610, 1999.
25
Zerefos, C. S., Balls, D. S., Bais, A., Gillotay, D., Simon, P. C., Mayer, B., and Seckmeyer, G.: Variability of UV-B at four stations in Europe, Geophys. Res. Let., 24(11), 1363–1366, 1997. Zerefos, C., Balis, D., Tzortziou, M., Bais, A., Tourpali, K., Meleti, C., Bernhard, G., and
Her-man, J.: A note on the interannual variations of UV-B erythemal doses and solar irradiance from ground-based and satellite observations, Ann. Geophys., 19, 115–120, 2001,
30
ACPD
8, 2403–2428, 2008 SUV Austria S. Simic et al. Title Page Abstract Introduction Conclusions References Tables Figures ◭ ◮ ◭ ◮ Back CloseFull Screen / Esc
Printer-friendly Version Interactive Discussion
Table 1. The amplitude of the influencing factors total ozone, clouds and albedo on UV
irra-diance at 305 nm calculated as (maximum–minimum)/mean are shown in the respective first lines. Every single measurement during the time period from 1994 to 2003 is included. Stan-dard deviations are denoted below in italic.
JAN FEB MAR APR MAY JUN JUL AUG SEP OCT NOV DEC ozone 2.11 2.56 1.79 1.86 1.41 1.17 1.10 1.02 1.10 1.27 1.49 1.53 0.38 0.56 0.37 0.33 0.22 0.20 0.17 0.17 0.20 0.20 0.28 0.27 clouds 1.23 1.22 1.19 1.51 1.47 1.24 1.58 1.15 1.46 1.21 1.16 – 0.30 0.31 0.32 0.32 0.31 0.32 0.33 0.29 0.35 0.30 0.33 albedo 0.27 0.26 0.31 0.32 0.21 0.15 0.12 0.14 0.13 0.18 0.24 0.23 0.04 0.05 0.04 0.06 0.04 0.03 0.03 0.02 0.02 0.04 0.04 0.04
ACPD
8, 2403–2428, 2008 SUV Austria S. Simic et al. Title Page Abstract Introduction Conclusions References Tables Figures ◭ ◮ ◭ ◮ Back CloseFull Screen / Esc
Printer-friendly Version Interactive Discussion
Table 2. Linear trends in relative departures of UV radiance from climatological monthly mean
values, wavelengths from 305 to 324 nm and CIE, solar zenith angles of 45◦, 55◦ and 65◦ are evaluated for the time period 1994–2006. Trends are calculated with the Theil-Sen method and are given in percent per decade, symbols to the right indicate the significance of the trend [−: insignificant (α>0.1),+: significant (α≤0.1), *: highly significant (α≤0.01)].
SZA 305 nm 310 nm 315 nm 324 nm CIE 45◦
−9.5+ −11.1+ −10.5+ −9.8+ −10.3+ 55◦ −23.9* −19.9* −15.6* −14.4* −19.5* 65◦ −3.8− −5.7+ −4.6+ −6.0+ −4.4−
ACPD
8, 2403–2428, 2008 SUV Austria S. Simic et al. Title Page Abstract Introduction Conclusions References Tables Figures ◭ ◮ ◭ ◮ Back CloseFull Screen / Esc
Printer-friendly Version Interactive Discussion
Fig. 1. Measured snow line enhancements at 305 nm for clear sky condition (left figure) and
ACPD
8, 2403–2428, 2008 SUV Austria S. Simic et al. Title Page Abstract Introduction Conclusions References Tables Figures ◭ ◮ ◭ ◮ Back CloseFull Screen / Esc
Printer-friendly Version Interactive Discussion
Fig. 2. Calculated daily climatological mean of effective albedo at Sonnblick observatory,
ACPD
8, 2403–2428, 2008 SUV Austria S. Simic et al. Title Page Abstract Introduction Conclusions References Tables Figures ◭ ◮ ◭ ◮ Back CloseFull Screen / Esc
Printer-friendly Version Interactive Discussion Year 1996 1997 1998 1999 2000 2001 2002 2003 AO D 0,00 0,02 0,04 0,06 0,08 0,10 0,12 0,14 0,16
Fig. 3. Monthly means of measurements of aerosol optical depth at 306.3 nm at the Sonnblick
ACPD
8, 2403–2428, 2008 SUV Austria S. Simic et al. Title Page Abstract Introduction Conclusions References Tables Figures ◭ ◮ ◭ ◮ Back CloseFull Screen / Esc
Printer-friendly Version Interactive Discussion
Fig. 4. Ratios of measured and modelled irradiances at 305 nm and solar zenith angle 63◦ in the period from 1994 to 2003 presented in a box plot diagram. The boundaries of the boxes indicate 25th and 75th percentile, and Whiskers above and below the box indicate the 90th and 10th percentiles.
ACPD
8, 2403–2428, 2008 SUV Austria S. Simic et al. Title Page Abstract Introduction Conclusions References Tables Figures ◭ ◮ ◭ ◮ Back CloseFull Screen / Esc
Printer-friendly Version Interactive Discussion Year 1993 1994 1995 1996 1997 1998 1999 2000 2001 2002 2003 2004 0.50 0.75 1.00 1.25 1.50 1.75 2.00 2.25 August A=0.14 σ=0.02 albedo Year 1993 1994 1995 1996 1997 1998 1999 2000 2001 2002 2003 2004 n o rm a li z e d i n te n s it y 0.50 0.75 1.00 1.25 1.50 1.75 2.00 2.25 0.50 0.75 1.00 1.25 1.50 1.75 2.00 2.25 0.50 0.75 1.00 1.25 1.50 1.75 2.00 2.25 April A=1.86 σ=0.33
total column ozone August A=1.02 σ=0.17
total column ozone
n o rm a li ze d i n te n s it iy 1993 1994 1995 1996 1997 1998 1999 2000 2001 2002 2003 2004 1993 1994 1995 1996 1997 1998 1999 2000 2001 2002 2003 2004 April A=0.32 σ=0.06 albedo
Fig. 5. Box-plot presentation of the influence of total column ozone (top row) and albedo
(bottom row) on variability of UV-irradiance at 305 nm in April and August, amplitude (A) and standard deviation (σ) are shown, the boxes are bounded by the 25% and 75% quartile.
ACPD
8, 2403–2428, 2008 SUV Austria S. Simic et al. Title Page Abstract Introduction Conclusions References Tables Figures ◭ ◮ ◭ ◮ Back CloseFull Screen / Esc
Printer-friendly Version Interactive Discussion σ May A=1.41 σ=0.22
total column ozone
0.50 0.75 1.00 1.25 1.50 1.75 n o rm a li z e d i n te n s ity 1993 1994 1995 1996 1997 1998 1999 2000 2001 2002 2003 2004 σ σ σ May A=0.21 σ=0.04 albedo 0.50 0.75 1.00 1.25 1.50 1.75 n o rm a li ze d i n te n s it y 1993 1994 1995 1996 1997 1998 1999 2000 2001 2002 2003 2004 Year 1993 1994 1995 1996 1997 1998 1999 2000 2001 2002 2003 2004 n o rm a li ze d i n te n s it y 0.50 0.75 1.00 1.25 1.50 1.75 May A=1.47 σ=0.31 clouds σ σ
Fig. 6. Box-plot presentation of the influence of total column ozone, clouds and albedo on
variability of UV-irradiance at 305 nm for May. Ozone and clouds are the governing influences whereas the contribution of albedo is small.
ACPD
8, 2403–2428, 2008 SUV Austria S. Simic et al. Title Page Abstract Introduction Conclusions References Tables Figures ◭ ◮ ◭ ◮ Back CloseFull Screen / Esc
Printer-friendly Version Interactive Discussion
Month
Jan Feb Mar Apr May Jun Jul Aug Sep Oct Nov Dec
M o n th ly v a ri a b il ity [ % ] 0 10 20 30 40 50 60 ozone clouds albedo
Fig. 7. Maximum variability in monthly mean values of 305 nm irradiance caused by total
ACPD
8, 2403–2428, 2008 SUV Austria S. Simic et al. Title Page Abstract Introduction Conclusions References Tables Figures ◭ ◮ ◭ ◮ Back CloseFull Screen / Esc
Printer-friendly Version Interactive Discussion 305 nm, 45° SZA Year 1994 1995 1996 1997 1998 1999 2000 2001 2002 2003 2004 2005 2006 2007 D e p a rtu re [% ] -75 -50 -25 0 25 50 75 -9.46%/dec (+) 305 nm, 55° SZA Year 1994 1995 1996 1997 1998 1999 2000 2001 2002 2003 2004 2005 2006 2007 D e p a rt u re [ % ] -75 -50 -25 0 25 50 75 -23.86%/dec (*) 305 nm, 65° SZA Year 1994 1995 1996 1997 1998 1999 2000 2001 2002 2003 2004 2005 2006 2007 D e p a rt u re [ % ] -75 -50 -25 0 25 50 75 -3.79%/dec (-) 310 nm, 45° SZA Year 1994 1995 1996 1997 1998 1999 2000 2001 2002 2003 2004 2005 2006 2007 D e p a rt u re [ % ] -75 -50 -25 0 25 50 75 -11.08%/dec (+) 310 nm, 55° SZA Year 1994 1995 1996 1997 1998 1999 2000 2001 2002 2003 2004 2005 2006 2007 D e p a rt u re [% ] -75 -50 -25 0 25 50 75 -19.95%/dec (*) 310 nm, 65° SZA Year 1994 1995 1996 1997 1998 1999 2000 2001 2002 2003 2004 2005 2006 2007 D e p a rt u re [% ] -75 -50 -25 0 25 50 75 -5.71%/dec (+)
Fig. 8. Relative departures of UV irradiance from climatological monthly mean values,
wave-lengths of 305 nm (first row), 310 nm (second row), 324 nm (third row) and CIE (fourth row) are shown for solar zenith angles of 45◦
(first column), 55◦
(second column) and 65◦ (third column), data from 1994 to 2006 are approximated with linear regression lines using the Theil-Sen method, symbols in parenthesis indicate trend significance [(−): insignificant (α>0.1), (+): significant (α≤0.1), (*): highly significant (α≤0.01)].
ACPD
8, 2403–2428, 2008 SUV Austria S. Simic et al. Title Page Abstract Introduction Conclusions References Tables Figures ◭ ◮ ◭ ◮ Back CloseFull Screen / Esc
Printer-friendly Version Interactive Discussion 305 nm, 45° SZA Year 1994 1995 1996 1997 1998 1999 2000 2001 2002 2003 2004 2005 2006 2007 D e p a rtu re [% ] -75 -50 -25 0 25 50 75 -9.46%/dec (+) 305 nm, 55° SZA Year 1994 1995 1996 1997 1998 1999 2000 2001 2002 2003 2004 2005 2006 2007 D e p a rt u re [ % ] -75 -50 -25 0 25 50 75 -23.86%/dec (*) 305 nm, 65° SZA Year 1994 1995 1996 1997 1998 1999 2000 2001 2002 2003 2004 2005 2006 2007 D e p a rt u re [ % ] -75 -50 -25 0 25 50 75 -3.79%/dec (-) 310 nm, 45° SZA Year 1994 1995 1996 1997 1998 1999 2000 2001 2002 2003 2004 2005 2006 2007 D e p a rt u re [ % ] -75 -50 -25 0 25 50 75 -11.08%/dec (+) 310 nm, 55° SZA Year 1994 1995 1996 1997 1998 1999 2000 2001 2002 2003 2004 2005 2006 2007 D e p a rt u re [% ] -75 -50 -25 0 25 50 75 -19.95%/dec (*) 310 nm, 65° SZA Year 1994 1995 1996 1997 1998 1999 2000 2001 2002 2003 2004 2005 2006 2007 D e p a rt u re [% ] -75 -50 -25 0 25 50 75 -5.71%/dec (+) Fig. 8. Continued.