HAL Id: hal-00318261
https://hal.archives-ouvertes.fr/hal-00318261
Submitted on 1 Feb 2007
HAL is a multi-disciplinary open access
archive for the deposit and dissemination of
sci-entific research documents, whether they are
pub-lished or not. The documents may come from
teaching and research institutions in France or
abroad, or from public or private research centers.
L’archive ouverte pluridisciplinaire HAL, est
destinée au dépôt et à la diffusion de documents
scientifiques de niveau recherche, publiés ou non,
émanant des établissements d’enseignement et de
recherche français ou étrangers, des laboratoires
publics ou privés.
C. J. Farrugia, A. Grocott, P. E. Sandholt, S. W. H. Cowley, Y. Miyoshi, F. J.
Rich, V. K. Jordanova, R. B. Torbert, A. Sharma
To cite this version:
C. J. Farrugia, A. Grocott, P. E. Sandholt, S. W. H. Cowley, Y. Miyoshi, et al.. The magnetosphere
under weak solar wind forcing. Annales Geophysicae, European Geosciences Union, 2007, 25 (1),
pp.191-205. �hal-00318261�
© European Geosciences Union 2007
Geophysicae
The magnetosphere under weak solar wind forcing
C. J. Farrugia1, A. Grocott2, P. E. Sandholt3, S. W. H. Cowley2, Y. Miyoshi4, F. J. Rich5, V. K. Jordanova6, R. B. Torbert1, and A. Sharma3
1Space Science Center and Department of Physics, University of New Hampshire, NH, USA 2Department of Physics and Astronomy, University of Leicester, Leicester LE2 4TG, UK 3Department of Physics, University of Oslo, Oslo, Norway
4Solar-Terrestrial Environment Laboratory, Nagoya University, Japan 5Air Force Research Lab, Hanscom AFB, MA, USA
6Los Alamos National Laboratory, Los Alamos, NM, USA
Received: 6 July 2006 – Revised: 1 December 2006 – Accepted: 8 December 2006 – Published: 1 February 2007
Abstract. The Earth’s magnetosphere was very strongly
dis-turbed during the passage of the strong shock and the fol-lowing interacting ejecta on 21–25 October 2001. These disturbances included two intense storms (Dst∗≈−250 and
−180 nT, respectively). The cessation of this activity at the
start of 24 October ushered in a peculiar state of the mag-netosphere which lasted for about 28 h and which we dis-cuss in this paper. The interplanetary field was dominated by the sunward component [B=(4.29±0.77, −0.30±0.71, 0.49±0.45) nT]. We analyze global indicators of geomag-netic disturbances, polar cap precipitation, ground magne-tometer records, and ionospheric convection as obtained from SuperDARN radars. The state of the magnetosphere is characterized by the following features: (i) generally weak and patchy (in time) low-latitude dayside reconnection or reconnection poleward of the cusps; (ii) absence of sub-storms; (iii) a monotonic recovery from the previous storm activity (Dst corrected for magnetopause currents decreas-ing from ∼−65 to ∼−35 nT), givdecreas-ing an unforced decreased of ∼1.1 nT/h; (iv) the probable absence of viscous-type in-teraction originating from the Kelvin-Helmholtz (KH) insta-bility; (v) a cross-polar cap potential of just 20–30 kV; (vi) a persistent, polar cap region containing (vii) very weak, and sometimes absent, electron precipitation and no systematic inter-hemisphere asymmetry. Whereas we therefore infer the presence of a moderate amount of open flux, the convection is generally weak and patchy, which we ascribe to the lack of solar wind driver. This magnetospheric state approaches that predicted by Cowley and Lockwood (1992) but has never yet been observed.
Keywords. Magnetospheric physics (Magnetospheric
con-figuration and dynamics; Solar wind-magnetosphere interac-tions; General or miscellaneous)
Correspondence to: C. J. Farrugia
1 Introduction
The terrestrial magnetosphere interacts continuously with the magnetized solar wind flow. The basic form of inter-action is a compression/dilation caused by a variable solar wind dynamic pressure. Major forms of geomagnetic activ-ity depend crucially on the orientation of the interplanetary magnetic field (IMF). For southward IMF, these include en-hanced plasma convection (Dungey, 1961; Cowley, 1982); erosion of magnetic flux from the dayside and its trans-port to the nightside, producing a dilated polar cap (Burch, 1972); episodes of explosive energy conversion in the ge-omagnetic tail called substorms (McPherron et al., 1973); and an energized ring current during storms. For northward IMF, reconnection at high latitudes (Dungey, 1963; Russell, 1972; Maezawa, 1976) may lead to cross-polar cap poten-tials of several tens of kV (Cumnock et al., 1992; Freeman et al., 1993; Knipp et al., 1993) while viscous-type interac-tions (Axford and Hines, 1961), most notably the Kelvin-Helmholtz instability (Dungey, 1955; Southwood 1979), can excite geomagnetic pulsations (Southwood, 1974; Chen and Hasegawa, 1974). Is the magnetosphere ever in a “ground” state where this diverse activity is switched off or operating at a very low level? In this paper we report on a time interval on 24–25 October 2001 when the IMF was pointing very nearly sunward with smaller and variable By and Bz components such that little solar wind-magnetosphere coupling might be expected. In fact, the magnetosphere appeared to be variably but near-continuously driven, albeit at a remarkably low rate. Interestingly, this state was preceded by one of the most disturbed periods in this solar cycle, where two major en-hancements of the ring current, each accompanied by a burst of substorm activity, were recorded. The interplanetary cause of this activity was a merger of at least two ejecta driving a strong shock. The passage at Earth of such mergers (often called “complex ejecta” (Burlaga et al., 2001, 2002) are
typi-the disturbances typi-they elicit may last for a long time. Here we focus on the ejecta merger which passed Earth on 21–25 October 2001. We shall in this paper characterize the state of the magnetosphere when the intense activity attending the passage of the earlier portion of this configuration, including the shock, had subsided. We shall find almost quiescent con-ditions with, however, a number of peculiar features which may be a residue of the previous activity.
2 Observations
2.1 Interplanetary observations
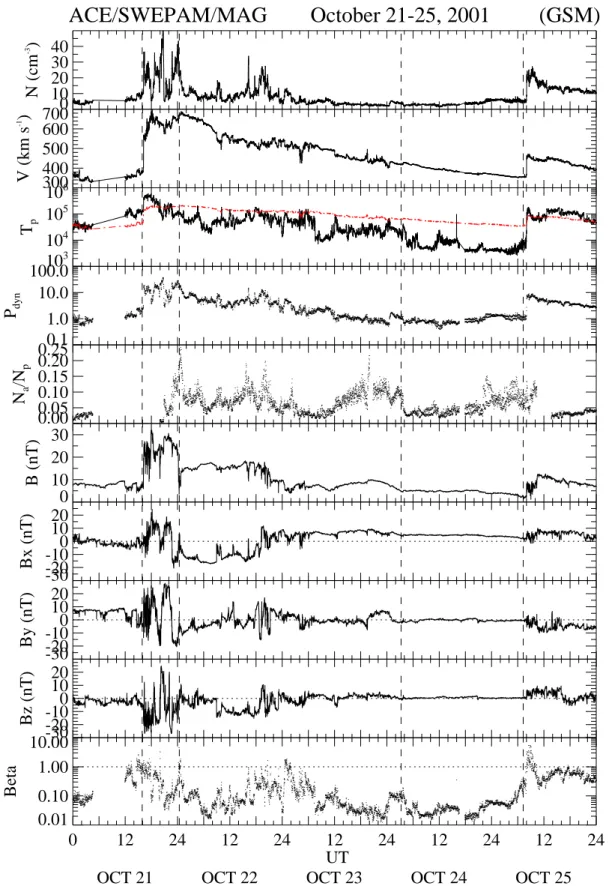
Interplanetary parameters for the 5-day interval 21–25 Oc-tober 2001, are shown in Fig. 1, which displays plasma and magnetic field measurements made by the ACE spacecraft from near the L1 libration point ∼220 RE (Earth radii) up-stream of Earth. The data were acquired by the MAG (mag-netic field) and SWEPAM (plasma) instruments at a temporal resolution of 16 s and 64 s, respectively. Plotted are the pro-ton density, bulk speed, temperature, dynamic pressure, the
αparticle-to-proton number density ratio, total field strength and its GSM components, and the proton plasma β. The red trace in the third panel is the proton temperature expected for the expanding solar wind resulting from statistical stud-ies (Lopez, 1987).
A strong shock (compression ratios in the density and magnetic field strength of ∼3) passes the spacecraft at
∼16:00 UT on 21 October 2001 (first vertical guideline).
Behind the shock very strong magnetic field strengths are observed as is also an undulating density profile reaching very large values (∼50 cm−3). Just after the last of these, the ejecta is entered (second vertical guideline). The time of entry may be inferred from the enhancement in the al-pha/proton number density ratio, the generally strong fields, and the low proton temperatures (where by “low” we un-derstand lower than the expected temperature), and proton
β<1. These features continue – with a notable exception
during ∼01:00–02:00 UT, 23 October, when there is a mag-netic field strength decrease and β rises above unity – up to the arrival of a second shock at 08:00 UT, 25 October. One may note the generally declining V -profile (panel 2) from after the arrival of leading shock to the arrival of a second shock advancing into the ejecta merger. This simple speed profile is one of the features characterizing complex ejecta (see example 1 in Burlaga et al., 2002). The magnetic field in the interval of interest (03:25 UT, 24 October–07:25 UT, 25 October at ACE; bracketed by the last two vertical guide-lines) is remarkable in that it is dominated by a sunward (Bx) component with smaller and variable east-west and north-south components (Bx=4.29±0.77 nT; By=−0.30±0.71 nT, and Bz=0.49±0.45 nT). Further striking features are a field of low fluctuation (B=4.40±0.78 nT) in a plasma of very low proton temperature (T=6600±2710 K) and β (∼0.04)
con-taining periods of elevated α-particle concentrations with re-spect to the protons (up to 15%). The dynamic pressure (=0.94±0.25 nPa) is substantially lower than the long-term average of 2.0 nPa, and fairly steady. These quiet values may be contrasted with the earlier interval on 21–23 October, where high and fluctuating densities, strong magnetic fields, and sporadically high temperatures may be seen. Studying the coalescence, total or partial, of ejecta in the inner helio-sphere leading to complex ejecta, Farrugia and Berdichevsky (2004) showed that ejecta mergers may strengthen the lead-ing shock, compress the field and plasma of the leadlead-ing ejecta, and heat the plasma. These are all factors which tend to intensify the geoeffectiveness of interplanetary configura-tions. This we believe is the cause of the contrast between the earlier and later intervals. The interval of increasingly quiescent geomagnetic activity ends abruptly at 08:00 UT, 25 October, when, as noted, a shock advances past ACE. 2.2 Global indicators of disturbance
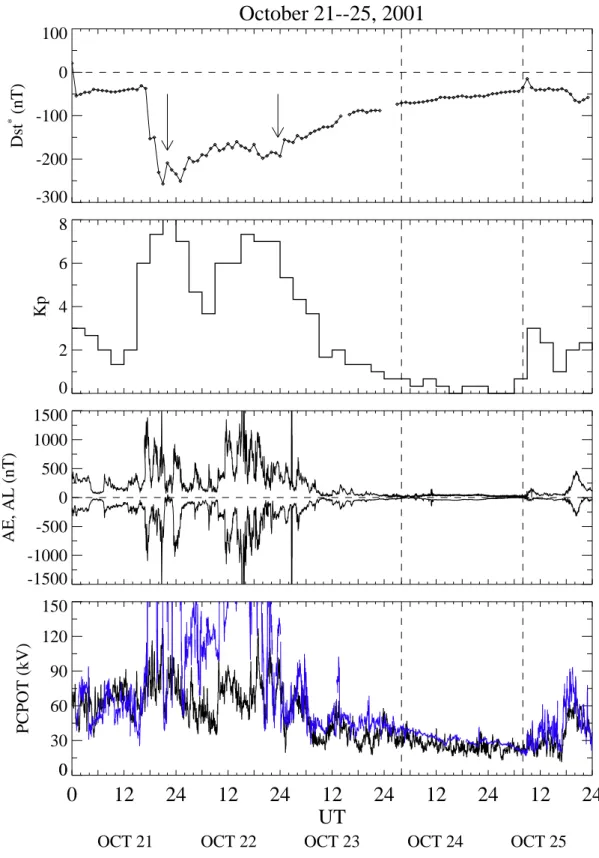
Major indices of geomagnetic activity are shown in Fig. 2. From top to bottom the panels display the Dst storm index corrected for the effect of magnetopause currents (Dst∗), the 3-hourly Kp index on a scale from 0 to 8; the auroral elec-trojet indices AE and AL; and two measures of the cross-polar cap potential, one derived from SuperDARN convec-tion measurements (see Sect. 2.5) (black curve) and another from a statistical analysis of DMSP data reported by Boyle et al. (1997; their Eq. 1). The AL index characterizes auroral activity, a sharp drop by several hundred nT usually denot-ing the presence of ionospheric currents associated with sub-storms in the geomagnetic tail. Vertical guidelines delimit our study interval, where an estimated 45 min propagation delay time from ACE to the ground has been taken into ac-count. In the earlier interval there occur two strong enhance-ments of the ring current indicated by the two minima in D∗st, two bursts of substorm activity during the peaks in Dst∗ and
Kp, and a cross-polar cap potential maximizing at ∼120 kV (black trace). (The results of Boyle et al. are not expected to agree with measured values at high solar wind electric fields, as in this early interval, because saturation sets in Russell et al., 2001; Siscoe et al., 2002, at values typically above
∼6 mV m−1; M¨uhlbachler et al., 2005.) By contrast, in the
interval of interest here, aside from a quasi-linear recovery of the D∗
stfrom the very strong, earlier activity, the other indices show remarkably steady and low level activity. Particularly noteworthy are the low values of the cross-polar cap poten-tial, ranging from below 20 kV to ∼30 kV. By measuring the rate of plasma convection within the magnetosphere (Reiff et al., 1981; Stern, 1984), this quantity is a good indicator of the strength of solar wind coupling. We now seek to character-ize this state of the magnetosphere and the conditions under which it occurred.
The substorm indices above are average quantities. To check directly whether there is a return of open flux to the
ACE/SWEPAM/MAG October 21-25, 2001 (GSM)
0 6 12 18 24 30 36 42 48 54 60 66 72 78 84 90 96 102 108 114 1200
10
20
30
40
N (cm
-3)
0 6 12 18 24 30 36 42 48 54 60 66 72 78 84 90 96 102 108 114 120300
400
500
600
700
V (km s
-1)
0 6 12 18 24 30 36 42 48 54 60 66 72 78 84 90 96 102 108 114 12010
310
410
510
6T
p 0 6 12 18 24 30 36 42 48 54 60 66 72 78 84 90 96 102 108 114 1200.1
1.0
10.0
100.0
P
dyn 0 6 12 18 24 30 36 42 48 54 60 66 72 78 84 90 96 102 108 114 1200.00
0.05
0.10
0.15
0.20
0.25
N
a/N
p 0 6 12 18 24 30 36 42 48 54 60 66 72 78 84 90 96 102 108 114 1200
10
20
30
B (nT)
0 6 12 18 24 30 36 42 48 54 60 66 72 78 84 90 96 102 108 114 120-30
-20
-10
0
10
20
Bx (nT)
0 6 12 18 24 30 36 42 48 54 60 66 72 78 84 90 96 102 108 114 120-30
-20
-10
0
10
20
By (nT)
0 6 12 18 24 30 36 42 48 54 UT60 66 72 78 84 90 96 102 108 114 120-30
-20
-10
0
10
20
Bz (nT)
0 6 12 18 24 30 36 42 48 54 60 66 72 78 84 90 96 102 108 114 1200.01
0.10
1.00
10.00
Beta
0
12
24
12
24
12
24
12
24
12
24
UT
OCT 21
OCT 22
OCT 23
OCT 24
OCT 25
Fig. 1. Interplanetary plasma and magnetic field observations from the ACE spacecraft for the 5-day period 21–25 October 2001. The panels
show, from top to bottom, the proton density, bulk speed, temperature, and dynamic pressure, the alpha particle-to-proton number density ratio, the total field strength, the components of the magnetic field vector in GSM coordinates, and the proton plasma beta.
dayside leading to a systematic shrinkage of the polar cap during our interval, we examined Wind measurements. On 24 October, the spacecraft was crossing the near-Earth tail on the dawnside, moving from (−14.0, −5.4, 1.2) RE at 04:00 UT to (−14.3, −21.6, 6.7) RE (GSM) at 18:00 UT, at which time it exited into the magnetosheath. The mea-surements show a magnetic field dominated by its sunward component (i.e. tailward stretched field), with a duskward component By=6.0±1.4 nT and with Bz=1.7±1.4 nT (GSM). The field strength decreased smoothly from ∼24 nT to
∼7 nT. There are no signs of abrupt rotations as might be
as-sociated with dipolarizations of the magnetic field, i.e. there is no indication of return of open flux at substorm onsets. 2.3 Polar cap precipitation
In an effort to see if dayside reconnection is ongoing dur-ing our period of interest, we next examine the polar rain. Current notions ascribe this electron precipitation to coro-nal electrons which propagate in interplanetary space as a closely field-aligned beam (the strahl) and gain access to the polar regions of Earth through reconnection on the dayside (see Fig. 1, Fairfield and Scudder, 1985). The polar cap precipitation has long been known to exhibit a pronounced north-south asymmetry related to the sector structure of the IMF (Yaeger and Frank, 1976). For, as here, a toward sector (Bx>0), this asymmetry should favor the Southern Hemi-sphere where the reconnected field lines connect back to the Sun.
The Polar spacecraft (orbital period ∼18.5 h) made four passes over the polar regions, two on each day. Polar was following an orbit lying approximately in the 22:00– 08:00 MLT plane, and rising in invariant latitude (ILT) up to
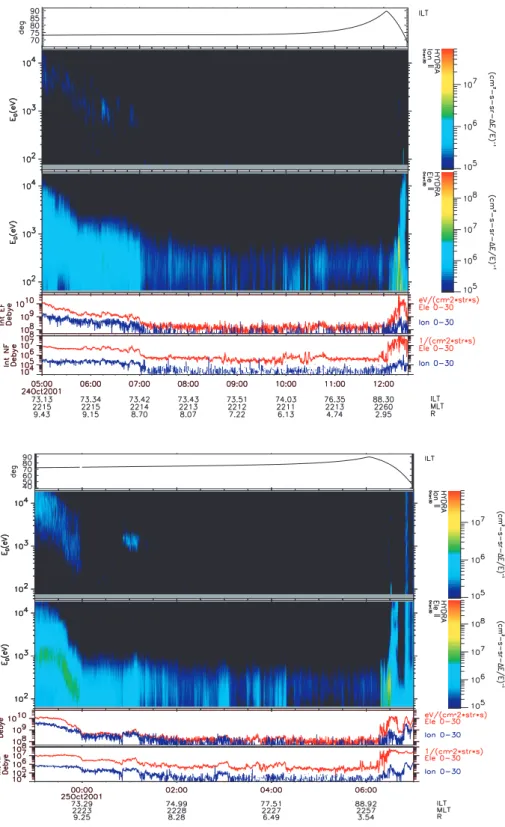
∼88◦. In the period we study, perigee (≈1.51 RE) occurred at ∼13:00 MLT and apogee (≈9.55 RE) at ∼22:00 MLT. We examine first the passes over the northern polar cap. The relevant data from the HYDRA instrument are plotted in Figs. 3a, b (top and bottom panels, respectively). The pan-els show the invariant latitude (ILT), the differential energy fluxes (DEF) of downflowing ions and electrons, the inte-grated energy and number fluxes (electrons in red). In the northern polar cap, downflowing particles move parallel the field, and we have plotted fluxes whose pitch angle lies in the range 0 to 30◦. The data, which have been corrected for spacecraft potential effects, have a time resolution of 13.8 s.
The passes over the Northern Hemisphere last many hours, with the spacecraft ascending slowly in ILT to above 80◦ while descending from apogee. They are in the nightside region (MLT∼22:00–23:00). On the first pass (Fig. 3a) significant electron DEFs are measured only up to ∼500 eV, and intensities are very weak start-ing from 07:00 to 12:00 UT, with intermittent drop-outs (DEF<105cm−2s−1sr−1 (1E/E)−1). Electron number fluxes are less than 106cm−2sr−1s−1and ion number fluxes are less than 105cm−2sr−1s−1, a precipitation form
classi-fied as “void” by Shinohara and Kokubun (1996; their Ta-ble 1). The nightside boundary of the polar cap appears to be crossed at ∼07:00 UT and be located at ∼73◦.
The second pass, from 23:00 UT, 24 October to 07:00 UT, 25 October (Fig. 3b), occurs in a similar MLT-ILT range as the previous pass. Similar precipitation characterisitics are seen. The precipitation type may also be classified as void, except during sporadic, moderate enhancements such as oc-cur at ∼01:00 UT and occasionally in 03:00–04:00 UT. Par-tial dropouts are also evident, particularly near the highest latitudes later on in the pass. Again, the polar cap boundary at ∼22:30 MLT appears to be located at ∼73◦ILT.
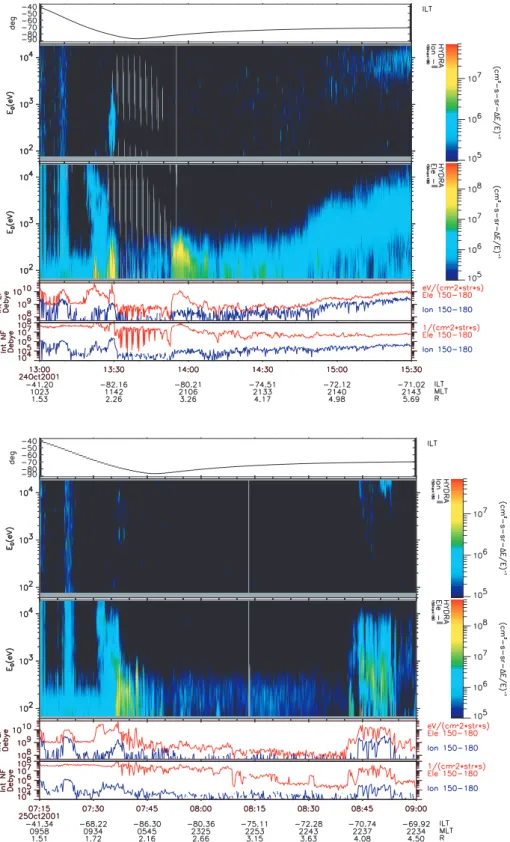
We next consider the Southern Hemisphere passes (Figs. 4a, b), plotting this time fluxes antiparallel to the mag-netic field (150–180◦pitch angle range). The first pass shows considerably more intense precipitation than in the north, with significant DEFs in energies up to 700 eV. A polar arc (at ∼13:30 UT) and a burst of enhanced precipitation (at
∼13:48–14:10 UT) bracket a region at the highest latitudes
(above −80◦ILT) where the fluxes are intermittently as weak as in the northern polar cap. It is hard to locate the polar cap boundary. At ∼21:30 MLT, if we place it at the start of the gradient in electron precipitation at ∼14:48 UT, it lies at
∼−73◦ILT. At midmorning MLTs, if we place the polar cap boundary at the start of the polar arc observation, it would lie at ∼−80◦.
The second southern pass on 25 October shows a marked contrast with the previous one. DEFs extend up to only 500 eV, and the integrated energy fluxes (last-but-one panel) are weaker. There is essentially a void on the nightside por-tion (to the right). In the interval 07:36–07:45 UT at high ILTs (78–88◦) on the dayside (∼08:00 MLT) intense bursts of precipitation of energies reaching ∼1 keV are present. These are likely signatures of polar arcs. The polar rain observations are still continuing at a ILT of ∼−71◦ when a rapid energization occurs at ∼08:45 UT, presumably on ar-rival of the shock seen at ACE ∼45 min earlier (cf. Fig. 1).
Summarizing, we have a polar cap precipitation which is (i) very weak, and sometimes absent, in the north; (ii) shows some indications of a north-south asymmetry which, how-ever, becomes much attenuated as time progresses; and (iii) is confined to energies of a few hundred eV only. The pres-ence of polar arcs were noted. In general, the observations support the idea of a low level of solar wind-magnetosphere coupling. Two caveats on the interpretation should be borne in mind, both related to the weakness of the precipitation. (1) The lack of obvious north-south asymmetry, in so far as this is a meaningful concept when the precipitation is so weak, may be due to the fact that the ejecta field lines are connected at both ends to the Sun (Makita and Meng, 1987). (2) The extent of the open field line region is hard to pin down. How-ever, an exact knowledge of the extent of the open field line region is not central to the main thrust of this paper.
To complement and extend the observations by Polar, we surveyed data acquired at low altitudes by the DMSP
October 21--25, 2001
0 6 12 18 24 30 36 42 48 54 60 66 72 78 84 90 96 102 108 114 120100
0
-100
-200
-300
Dst
*(nT)
0 6 12 18 24 30 36 42 48 54 60 66 72 78 84 90 96 102 108 114 1200
2
4
6
8
Kp
0 6 12 18 24 30 36 42 48 54 60 66 72 78 84 90 96 102 108 114 120-1500
-1000
-500
0
500
1000
1500
AE, AL (nT)
OCT 21 OCT 22 OCT 23 OCT 24 OCT 25
0 12 24 12 24 12 24 12 24 12 24
UT
0
30
60
90
120
150
0
PCPOT (kV)
Fig. 2. Measures of geomagnetic activity during 21 October–25 October: The Dst index corrected for magnetopause currents (panel 1),
the Kpindex (panel 2), the auroral electrojet index AE (positive values) and the AL-index (negative values) (panel 3), and the cross-polar
cap potential obtained from SuperDARN convection data (black trace), and that derived from an empirical formula based on DMSP passes according to Boyle et al. (2000) (last panel). The vertical dashed guidelines bracket the interval we study.
Fig. 3. (a), (b): Polar/Hydra observations of particle precipitation at high latitudes. The panels show the invariant latitude of the spacecraft,
differential energy fluxes of ions and electrons travelling parallel to the magnetic field, with intensities according to the color bar on the right; integrated energy and number fluxes (electrons in red). Bottom panel: Similar to panel (a) but for the next pass over the Northern Hemisphere.
Fig. 4. (a), (b): Similar to Fig. 3, but for the two consecutive passes over the Southern Hemisphere. The fluxes plotted of particles travelling
102 103 104 102 103 104 -1000 0 1000 Sunward Antisunward VER HOR-C -200 0 200 10 4 105 106 102 104 106
ELECTRON FLUX particles/(cm
2 s sr eV) 100 102 104 ION FLUX particles/(cm 2 s sr eV)
F13
M/SEC24 Oct 2001
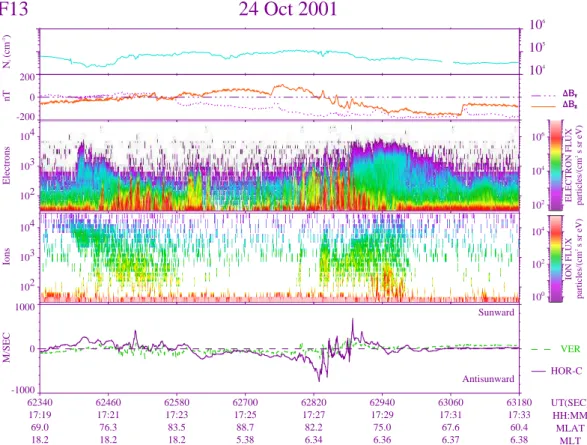
(eV) Electrons Ions Ni (cm -3) nT 62340 17:19 69.0 18.2 62460 17:21 76.3 18.2 62580 17:23 83.5 18.2 62700 17:25 88.7 5.38 62820 17:27 82.2 6.34 62940 17:29 75.0 6.36 63060 17:31 67.6 6.37 63180 17:33 60.4 6.38 UT(SEC) HH:MM MLAT MLTFig. 5. Ion and electron data acquired by the DMSP-F13 spacecraft during a 14-min-long pass over the Northern Hemisphere at high latitudes.
From top to bottom: ion density, magnetic field deflections, electron and ion differential energy fluxes, vertical (green) and horizontal (violet) flow speeds. The legend at the bottom gives the UT, magnetic latitude and magnetic local time.
spacecraft. There were three spacecraft with usable data in our period of interest, F12, F13, and F15. While the tracks of F12 and F15 are all in a 09:30–21:30 MLT orientation, F13 follows generally a dawn-dusk path and is best suited for our purposes. Whereas not all passes of F13 reached above 80◦ILT to permit a sampling of the global convection, many did. We thus chose to emphasize the F13 measurements. We surveyed precipitation, flows and potential drops. All flow and potential data are 4 s averages. The potential is calcu-lated poleward of 50◦ MLAT, defined as the zero potential value. The flows we examined are the values after corotation has been removed but not after the constant offset to all points in order to force the ends to go to zero was performed. Previ-ous work (Freeman et al., 1993) has shown that this does not affect results on the form of convection, i.e., it does not alter the turning points of the potential, but does influence our es-timate of the maximum potential drop. Freeman et al. (1993) calculate that this typically leads to an underestimate of the potential drop by up to 10 kV.
General features of F13 observations were as follows: (1) small potential drops, of order 15–30 kV or less; (2) weak flows, rarely exceeding 0.5 km s−1 and most being
<300 m s−1; (3) a general lack of coherent patterns across the whole polar cap; (4) instead, the flows were generally
ir-regular with several reversals or spiky fluctuations occuring over small spatial scales. (A 4 s time lapse is roughly equiva-lent to 30 km); (5) In the polar cap, ion fluxes were generally absent, and electron fluxes were weak with significant count rates only up to a few hundred eV. No systematic north-south asymmetry was evident, although there was some variability about this from pass to pass. (6) No systematic change in the extent of the polar cap regions was discernible. One may note that the potential drops are underestimates, partly because of the zero potential set at a given MLAT, mentioned above, and partly because the spacecraft track might not have reached high enough MLATs to sample the whole convection. How-ever, the correction is not likely to introduce any significant change in the conclusions. Many flow patterns could be de-scribed as weak 2-cell patterns and/or weak 1-cell patterns. Often they occupied only one part of the polar cap traversal. In conclusion, we generally see weak, and patchy convection associated with small potential drops. On occasion twin-cell convection was present, also associated with low potential drops. The flows and potentials from DMSP are later com-pared with those from SuperDARN.
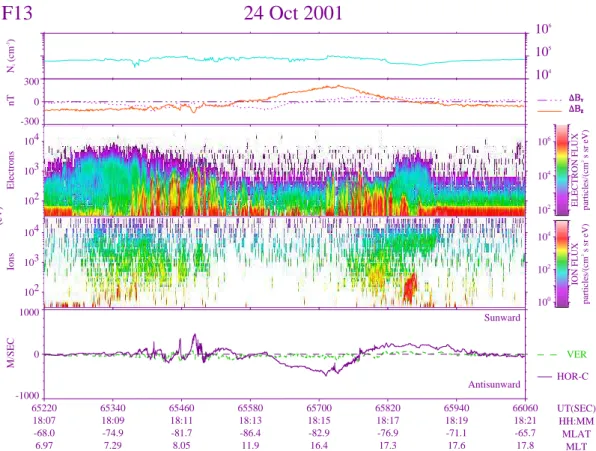
Figures 5 and 6 are fairly representative of the obser-vations. They refer to two consecutive passes over the Northern (17:11–17:41 UT) and Southern (17:59–18:29 UT)
102 103 104 102 103 104 -1000 0 1000 Sunward Antisunward VER HOR-C -300 0 300 10 4 105 106 102 104 106
ELECTRON FLUX particles/(cm
2 s sr eV) 100 102 104 ION FLUX particles/(cm 2 s sr eV)
F13
M/SEC24 Oct 2001
(eV) Electrons Ions Ni (cm -3) nT 65220 18:07 -68.0 6.97 65340 18:09 -74.9 7.29 65460 18:11 -81.7 8.05 65580 18:13 -86.4 11.9 65700 18:15 -82.9 16.4 65820 18:17 -76.9 17.3 65940 18:19 -71.1 17.6 66060 18:21 -65.7 17.8 UT(SEC) HH:MM MLAT MLTFig. 6. Similar to Fig. 5, but for the subsequent pass over the Southern Hemisphere.
Hemispheres, respectively. In each figure the panels show from top to bottom: ion density, magnetic field deflections, electron and ion differential energy fluxes, horizontal (vio-let) and vertical flows. Mantle precipitation bounds a polar cap area at the dawn and dusk terminator regions. The polar rain precipitation appears tenuous and seems confined to high MLATs on the dusk side and lower MLATs on the dawnside. The electron precipitation in the polar caps occurs in energies up to ∼500 eV.
In the pass shown in Fig. 5, during which F13 climbed to ∼86◦, there is evidence of a some antisunward flow con-fined to the dawn side of the polar cap, with little or none in the center of the polar cap. The associated potential drop is very small and estimated as ∼10 kV. Flows are less than 300 m s−1 except for three brief excursions when they reached ∼0.5 km s−1. In the south (Fig. 6), where again the spacecraft reached MLATs of ∼85◦, the precipitation inten-sity and energy range are comparable. There is evidence of a weak antisunward flow (∼200–300 m s−1) at midafter-noon MLTs which turns to weakly sunward outside the polar cap, thus formimg a weak 2-cell DC flow as indicated also by SuperDARN measurements detailed in Sect. 2.5 below. Across this 2-cell pattern the potential drop is ∼15 kV and peak flows reach 450 m s−1. Considering the region of
an-tent of the open field line region, we have in Fig. 6 the po-lar cap boundary located approximately at −80◦(duskside) and −84◦(dawnside). Weak polar arcs associated with cor-respondingly weak flows are observed on the duskside in the north (∼84◦ MLAT) and on the dawnside in the south (−82◦ MLAT). This arc location is in both hemispheres on the opposite sides of the moderately antisunward convection. 2.4 Viscous interactions
We next investigate the possibility of viscous interaction. In statistical studies of the polar cap potential, a residual po-tential difference not due to reconnection is often ascribed to viscous-type processes, which are believed to contribute some 25–30 kV (e.g. Reiff et al., 1984; Cowley, 1986) or even less (Milan, 2004). This is approximately consis-tent with what we obtain from SuperDARN, the Boyle et al. (1997) empirical equation (Fig. 2, last panel), and the
DMSP F13 passes we surveyed. However, the
Kelvin-Helmholtz (KH) instability, a prime candidate thought to me-diate these interactions, is apparently not operating during our interval. This is suggested by the ground magnetome-ter records. According to the field line resonance theory of the excitation of ULF geomagnetic pulsations by KH waves at the magnetopause and its boundary layers (Southwood,
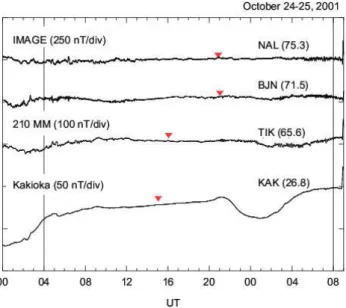
Fig. 7. Stack plots of the horizontal component of the Earth’s field
at 4 stations. (Note that the vertical scale changes as indicated on the left). The top two stations form part of the IMAGE chain, and the bottom stations form part of the 210 MM chain. The red arrows indicate local midnight.
rise to geomagnetic field pulsations in the Pc 5 range (2– 7 mHz). However, all ground magnetometer chains show just a quiet field. As an example, Fig. 7 displays readings of the horizontal component of the geomagnetic field at four sta-tions arranged in order of decreasing geomagnetic latitude (marked near the station designation). The top two stations are from the IMAGE chain (Viljanen et al., 1997), and the bottom two are from the 210 deg MM array (Yumoto et al., 1992). The inverted arrows mark local magnetic midnight at the respective stations. We see neither negative bays (i.e., localized depressions of the geomagnetic field propagating poleward) at the auroral zone stations NAL and BJN, pre-cluding the possibility of substorms, nor pulsations at the midlatitude station TIK, precluding in turn the possibility of KH instability (the irregular oscillations during early Octo-ber 24 being presumably of solar wind dynamic pressure ori-gin). The steady increase in the readings at the low-latitude station KAK reflects the steady recovery of the ring current, also indicated in the D∗
st profile in Fig. 2. This increase is in-terrupted by a wide depression centred near local noon. This is a quiet-time phenomenon (Sq-variation), thought to be the effect of neutral wind motions in the ionosphere (Nishida, 1978). (It is subtracted when the Dst index is compiled.) We should note, however, a possible restriction on this interpre-tation. Hall currents in the magnetosphere we are discussing may be weak so that the lack of geomagnetic deflections on the ground could conceivably be due to this rather than the absence of KH instability.
2.5 SuperDARN observations of the ionospheric flow The Super Dual Auroral Radar Network (SuperDARN) (Greenwald et al., 1995) provides line-of-sight velocity mea-surements of the high-latitude ionosphere in the Northern Hemisphere. These measurements are routinely combined using the “Map Potential” fitting technique (Ruohoniemi and Baker, 1998) to produce maps of large-scale ionospheric con-vection. We have examined the convection patterns for the current interval and present a selection of them in Fig. 8. Each map is plotted in a magnetic latitude – magnetic lo-cal time coordinate system with noon to the top and dusk to the left. Contours of constant electric potential are shown in black, with vectors representing the fitted radar measure-ments shown in colour, scaled according to the bar on the right of each map. The concurrent IMF vector is shown in the top right for reference and the total transpolar voltage is given in the bottom right.
In Fig. 8a we show two maps which are representative of the nature of the flow over much of the interval. It is im-mediately evident that these flows do not fit within the tra-ditional framework of convection classified in terms of the upstream IMF (as discussed by, for example, Cowley and Lockwood, 1992). This is likely to be a direct consequence of the fact that the IMF itself is not easily characterized, often having Byand Bzcomponents which are small and variable, as noted in Sect. 2.1. Instead, the flows are characterized by low-velocity, multi-celled patterns and regions of complete stagnation. Often, however, there is some evidence of a very low level of driving, illustrated by the moderate twin-vortex convection evidenced in Fig. 8b. There is also some enhance-ment to the “return”-type flows, although often the polar cap itself is essentially stationary. The transpolar voltage remains below 30 kV for much of the interval, often dipping below 20 kV (as in Fig. 8a), in general agreement with an extremely low level of dayside driving. Although data coverage is not complete, these values are also in good agreement with the Boyle empirical formula (Boyle et al., 1997; see Fig. 2 for a comparison), which, for low polar cap potentials has been repeatedly found to give a good estimate of the polar cap potential. They are also consistent with DMSP values. Be-tween ∼14:00 and 20:00 UT data coverage from the radars was particularly reduced. However, there is nothing in the supporting datasets to suggest that this period exhibited sig-nificantly different characteristics to those before and after. Overall, data coverage is remarkably good for such an ex-tended quiet interval.
The convection maps shown in Figs. 8a–b give a good indication of the general nature of the flows throughout the interval. There are, however, a number of short lived (20–∼30 min) departures from this state, two examples
of which are shown in Fig. 8c. These generally take
the form of enhancements to the nightside auroral zone flow and resemble the flow bursts discussed by Grocott et al. (2003, 2004, 2005). Their observations were made during
-9 100 200 300 400 500 600 700 800 900 1000 Velocity (ms -1 ) 21:30:00 -21:32:00 24 Oct 2001 19 kV APL Model 0<BT<4 Bz+/By+ 1000 ms-1 +Z (2 nT) +Y (-71 min) 3 3 3 100 200 300 400 500 600 700 800 900 1000 Velocity (ms -1 ) 03:20:00 -03:22:00 25 Oct 2001 17 kV APL Model 0<BT<4 Bz+/By-1000 ms-1 +Z (2 nT) +Y (-73 min) -9 3 100 200 300 400 500 600 700 800 900 1000 Velocity (ms -1 ) 06:20:00 -06:22:00 24 Oct 2001 26 kV APL Model 0<BT<4 By-1000 ms-1 +Z (2 nT) +Y (-64 min) -9 -9 3 3 100 200 300 400 500 600 700 800 900 1000 Velocity (ms -1 ) 01:50:00 -01:52:00 25 Oct 2001 21 kV APL Model 0<BT<4 By-1000 ms-1 +Z (2 nT) +Y (-72 min) -9 3 3 100 200 300 400 500 600 700 800 900 1000 Velocity (ms -1 ) 08:50:00 -08:52:00 24 Oct 2001 29 kV APL Model 0<BT<4 Bz+ 1000 ms-1 +Z (2 nT) +Y (-66 min) -9 -9 3 100 200 300 400 500 600 700 800 900 1000 Velocity (ms -1 ) 22:24:00 -22:26:00 24 Oct 2001 25 kV APL Model 0<BT<4 Bz+ 1000 ms-1 +Z (2 nT) +Y (-70 min) -21 -9 -9 3 3 15 27 39 51 100 200 300 400 500 600 700 800 900 1000 Velocity (ms -1 ) 00:30:00 -00:32:00 22 Oct 2001 96 kV APL Model 6<BT<12 Bz-/By-1000 ms-1 +Z (5 nT) +Y (-40 min) -33 -21 -9 -9 3 3 15 27 100 200 300 400 500 600 700 800 900 1000 Velocity (ms -1 ) 23:44:00 -23:46:00 22 Oct 2001 94 kV APL Model 6<BT<12 Bz-1000 ms-1 +Z (5 nT) +Y (-52 min)
(a)
(b)
(c)
(d)
Fig. 8. Large-scale convection inferred from the SuperDARN radars. The coordinate system is magnetic latitude versus magnetic local time.
Noon is at the top and dusk is to the left. Equipotential contours are shown by the black traces. The colored vectors show fitted velocites. The IMF direction is shown at top right, and the cross-cap potential is shown at bottom right. Panels (a–c) refer to the interval we study;
IMF-northward, non-substorm intervals and were interpreted as signatures of reconnection in a “quiet time” tail. Although the IMF Byand Bzcomponents were weaker during this in-terval than during those studied by Grocott et al., the bursty nature of the nightside activity does imply that some low-level dayside driving is likely to have been present. It is also possible that the preceding interval of intense activity (whose associated flows are illustrated in Fig. 8d for comparison with the present observations) could well have left the magneto-sphere suitably primed to unload itself in this fashion.
We now take a critical look at the use of the Map Poten-tial technique for flows as weak as we generally have in this period. We note first that the coverage of radar data is actu-ally quite good. Second, the actual patterns suggested by the technique may not be totally reliable, but certainly the tech-nique is not making up the fact that the flows are very small. Third, it is the fact that the patterns are somewhat erratic – suggesting a lack of coherent and continued twin-vortex con-vection – which interests us here and not so much the detailed shape of the patterns themselves.
To probe our results further, we made an additional check where we reproduced the SuperDARN flow maps using a false IMF input (and hence a different statistical model input) with Bz=−4 nT and found that the potential patterns changed remarkably little. Consider the right-hand map of Fig. 8a, for example. The transpolar voltage showed just a 4 kV in-crease (21 kV as opposed to 17 kV) with the false IMF model applied, whereas the model voltage itself for Bz=−4 nT is 56 kV. For comparison, if the model were dictating the ac-tual map shown in Fig. 8a the voltage would be 27 kV, even for northward IMF. We therefore conclude that the measured flow data is dominating the patterns and is clearly indicat-ing convection which is weaker than might “usually” be ex-pected.
3 Discussion
In this paper we have discussed a most peculiar state of the magnetosphere in which the polar cap contained a quantity of open flux yet only weak, and often sporadic, convection occurred. The initial state of the magnetosphere, i.e. one which contained a moderate-to-large amount of open flux, can be easily explained by considering the previous activ-ity caused by the passage of the ejecta merger. The lead-ing part of the configuration, lastlead-ing for about 60 h, disturbed geospace extensively and, in particular, gave rise to two in-tense (Dst<−100 nT) storms and the consequent growth of the polar cap. In contrast, the interval we have been ex-amining elicited only weak particle precipitation in the po-lar cap, patchy and sometimes stagnant ionospheric convec-tion, a monotonic decrease in the total ring current energy, as measured by the Dst index, and an absence of substorms. We may pictorially describe this magnetosphere as one ap-proaching a ground state.
Let us consider the substorm recurrence rate. According to Borovsky et al. (1993), who undertook a broad survey of this quantity, the mean and standard deviation of the substorm recurrence time are 4±2 h. A 28-h substorm–free interval is thus several standard deviations away from the mean of the distribution. Another interesting point pertains to ring cur-rent recovery. Without competing mechanisms and in the absence of fresh injection, the recovery seen here charac-terizes an intrinsic property of the ring current, namely its (unforced) decay time, a quantity important in ring current models. We obtain for this a value of ∼1.1 nT h−1.
The steady nature of the polar cap showing no clear and systematic tendency to shrink or expand over such a long pe-riod also relates to a lack of solar wind driving. On the one hand, there is no substantial evidence of significant and con-tinued flux removal from the dayside, offsetting any tendency for the polar cap to expand, and on the other, no return of flux to the dayside via substorms was monitored, offsetting in turn any tendency for it to contract. Hence our suggestion that the size of the polar cap is a remnant of activity during the earlier strong phase of ejecta passage. The polar cap size is then maintained because in the later phase, the usual pro-cesses which shrink the polar cap are generally absent. So the question is, if there is no evidence of typical dayside driving, nor of substorm activity, what is generating the low level of convection evidenced in the cross polar cap potentials shown in Fig. 2?
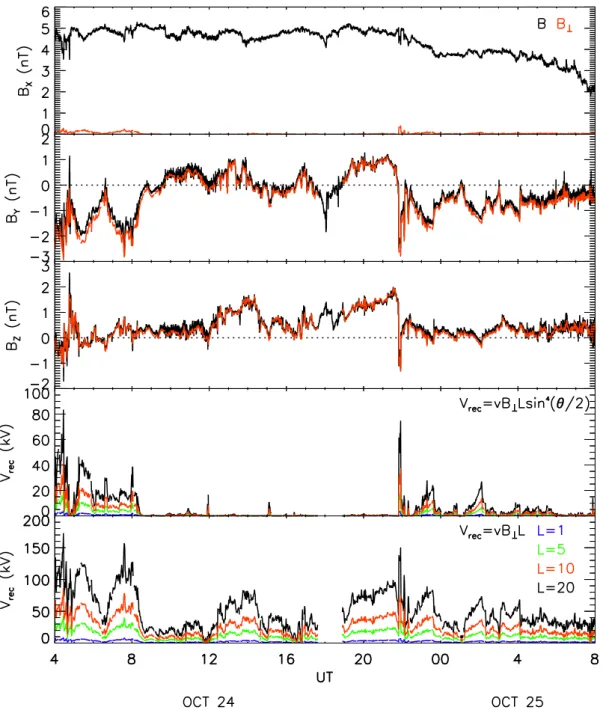
In their discussion of the excitation and decay of convec-tion in the magnetosphere-ionosphere system, Cowley and Lockwood (1992) suggested that in the absence of both day-side and nightday-side reconnection, the flow in the system would cease irrespective of the amount of open flux present. In the present case, we have a system in which there is no clear driv-ing mechanism, yet convection is near-continuously driven, albeit at a remarkably low rate. To investigate the possible nature of this dayside driving, we have computed the dayside reconnection voltage, Vrec=vB⊥Lf (θ), where v is the solar wind speed, B⊥ is the magnetic field perpendicular to the flow direction, L is the length of the magnetopause recon-nection X-line, and θ is the IMF clock angle (i.e. polar angle in the GSM YZ-plane), for different coupling functions f (θ ) and values of L, and these are presented in Fig. 9. The top three panels show the upstream IMF for our interval, with their solar wind-perpendicular components superimposed in red. In the bottom two panels the dayside reconnection volt-ages are shown for f (θ )= sin4(θ/2) and f (θ )=1, for values of L set at 1, 5, 10 and 20 RE. Firstly, it is clear from the values of B⊥xthat the magnetic field was essentially paral-lel to the solar wind flow throughout the interval. Using this to compute the reconnection voltage (panels 4 and 5) then gives an indication of the possible coupling between the solar wind and magnetosphere. Looking first at panel 4, it is clear that conventional approximations of the dayside reconnec-tion voltage imply essentially zero coupling for many hours over the interval. If this were true, however, then the ∼20 kV
Fig. 9. The top three panels reproduce the components of the IMF, on top of which are shown in red the components of B perpendicular to the
flow vector. The bottom two panels show two theoretical estimates of the reconnection rate parametrized by the length of the magnetopause reconnection X-line, L
cross polar cap voltage evident in the radar data would, in the absence of tail reconnection, have to be due entirely to vis-cous coupling. As was shown in Fig. 8, there is often some evidence of convection across the polar cap, which cannot be due to a viscous interaction since this occurs only on closed field lines. If the convection was due to tail reconnection then a voltage of ∼20 kV would easily close even a large polar cap over an interval as long as we are dealing with here. The fact that this does not occur provides further evidence that
some ongoing quasi-balanced dayside and nightside convec-tive driving must be occurring.
Panel 5 of Fig. 9 shows the theoretical maximum recon-nection voltage for various L values if we were to assume that the total solar wind electric field could couple to the magnetosphere irrespective of the orientation of B⊥. This shows that, for L=5–10 RE, voltages similar to the cross po-lar cap potentials discussed above could occur. We can only
with which we are not familiar is facilitating a low level of coupling in this case. Combining panels (4) and (5) leads us to suggest that, under these special circumstances, L (the geoeffective length) is large (of order ∼10) and the dependence on clock angle, θ (i.e., the coupling function) is less strong than the sin4(θ/2), the Perreault-Akasofu (1978) function often employed. Then we would be able to recover the ∼20 kV voltage that we see.
The nature of the nightside component of the convection is more readily identifiable, and resembles the Grocott et al. (2003, 2004, 2005) nightside non-substorm reconnection bursts mentioned above. This form of tail reconnection was initiated by the continued driving of the solar wind under the influence of a strong and constant IMF By component, which is absent in the present case. However, a tendency of the tail to respond to a modest driving of any kind in this fashion may be responsible for the present observations. In summary, the trailing end of this complex ejecta may be char-acterized by the general absence of a coherent driver which is reflected in the lack of coherent and continued twin-vortical ionospheric convection, the absence of substorms, a back-ground polar cap potential and weak and occasionally absent polar cap precipitation.
Acknowledgements. We are grateful to J. D. Scudder, C. Smith, and
D. McComas for the use of Polar/HYDRA, ACE magnetic field and plasma data, respectively. We should like to thank the prin-cipal investigators of the ground magnetometers, whose data we showed. This work is supported by NASA grants NNGO5GG25G, NNG05GC75G, NAG5-13116, and NNG06GD41G. Work at Le-icester was supported by PPARC grant PPA/G/0/2003/00013.
Topical Editor I. A. Daglis thanks G. Siscoe and V. Sergeev for their help in evaluating this paper.
References
Axford, W. I. and Hines, C. O.: A unifying theory of high-latitude geophysical phenomena and geomagnetic storms, Can. J. Phys., 39, 1433–1464, 1961.
Burlaga, L. F., Skoug, R. M., Smith, C. W., Webb, D. F., Zurbuchen, T. H., and Reinard, A.: Fast ejecta during the ascending phase of solar cycle 23: ACE observations, 1998–1999, J. Geophys. Res., 106(A10), 20 957–20 978, 2001.
Burlaga, L. F., Plunkett, S. P., and StCyr, P.-C.: Succes-sive CMEs and complex ejecta, J. Geophys. Res., 107, A10, doi:10.1029/2001JA000255, 2002.
Borowsky, J. E., Nemzek, R. J., and Belian, R. D.: The occurrence rate of magnetospheric-substorm onsets: Random and periodic substorms, J. Geophys. Res., 98, 3807–3814, 1993.
Boyle, C. B., Reiff, P. H., and Hairston, M. R.: Empirical polar cap potentials, J. Geophys. Res., 102, 111–125, 1997.
Burch, J. L.: Precipitation of low-energy electrons at high latitudes: Effects of interplanetary magnetic field and dipole tilt angle, J. Geophys. Res., 77, 6696–6707, 1972.
Chen, L. and Hasegawa, A.: A theory of long-period magnetic pul-sations, 1, Steady state excitation of field line resonance, J. Geo-phys. Res., 79, 1024–1032, 1974.
Cowley, S. W. H.: The causes of convection in the Earth’s magne-tosphere: A review of developments during the IMS, Rev. Geo-phys., 20, 531–565, 1982.
Cowley, S. W. H.: The impact of recent observations on theoret-ical understanding of solar wind-magnetosphere interactions, J. Geomag. Geoelectr., 38, 1223–1256, 1986.
Cowley, S. W. H. and Lockwood, M.: Excitation and decay of so-lar wind-driven flows in the magnetosphere-ionosphere system, Ann. Geophys., 10, 103–115, 1992,
http://www.ann-geophys.net/10/103/1992/.
Cumnock, J. A., Heelis, R. A., and Hairston, M. R.: The response of the ionospheric convection pattern to a rotation of the IMF on January 14, 1988, J. Geophys. Res., 97, 19 449–19 460, 1992. Dungey, J. W.: Electrodynamics of the outer atmospheres, Rep. 69,
Ionos. Res. Lab., Pa. State Univ., Universiity Park, 1955. Dungey, J. W.: Interplanetary magnetic field and the auroral zones,
Phys. Rev. Lett., 6, 47–48, 1961.
Dungey, J. W.: The structure of the exosphere, or adventures in ve-locity space, in: Geophysics, The Earth’s Environment, edited by: De-Witt, C., Hiebolt, J., and Lebeau, A., pp. 526–536, Gor-don and Breach, New York, 1963.
Fairfield, D. and Scudder, J. D.: Polar rain: Solar coronal electrons in the Earth’s magnetosphere, J. Geophys. Res., 90, 4055–4068, 1985.
Farrugia, C. J. and Berdichevsky, D. B.: Evolutionary signatures in complex ejecta and their driven shocks, Ann. Geophys., 22, 3679–3698, 2004,
http://www.ann-geophys.net/22/3679/2004/.
Freeman, M. P., Farrugia, C. J., Burlaga, L. F., Hairston, M. R., Greenspan, M. E., Ruohoniemi, J. M., and Lepping, R. P.: The interaction of a magnetic cloud with the Earth: Ionospheric con-vection in the northern and southern hemisphere for a wide range of quasi-steady interplanetary magnetic field conditions, J. Geo-phys. Res., 98, 7633–7655, 1993.
Greenwald, R. A., Baker, K. B., Dudeney, J. R., Pinnock, M., Jones, T. B., Thomas, E. C., Villain, J. O., et al.: DARN/SuperDARN: A global view of the dynamics of high-latitude convection, Space Sci. Rev., 71, 761–796, 1995.
Grocott, A., Cowley, S. W. H., and Sigwarth, J. B.: Ionospheric flow during extended intervals of northward but By-dominated IMF, Ann. Geophys., 21, 509–538, 2003,
http://www.ann-geophys.net/21/509/2003/.
Grocott, A., Badman, S. V., Cowley, S. W. H., Yeoman, T. K., and Cripps, P. J.: The influence of IMF By on the nature of the night-side high-latitude ionospheric flow during intervals of positive IMF Bz, Ann. Geophys., 22, 1755–1764, 2004,
http://www.ann-geophys.net/22/1755/2004/.
Grocott, A., Yeoman, T. K., Milan, S. E., and Cowley, S. W. H.: Interhemispheric observations of the ionospheric signature of tail reconnection during IMF-northward non-substorm intervals, Ann. Geophys., 23, 1763–1770, 2005,
http://www.ann-geophys.net/23/1763/2005/.
Knipp, D. J., Emery, B. A., Richmond, A. D., et al.: Ionospheric response to slow, strong variations in a northward interplanetary magnetic field: A case study for January 14, 1988, J. Geophys. Res., 98, 19 273–19 292, 1993.
Lopez, R. E.: Solar cycle invariance in solar wind proton tempera-ture relationships, J. Geophys. Res., 92, 11 189–11 200, 1987. Maezawa, K.: Magnetospheric convection induced by the positive
and negative Z components of the interplanetary magnetic field – Quantitative analysis using polar cap magnetic records, J. Geo-phys. Res., 81, 2289–2303, 1976.
McPherron, R. L., Russell, C. T., and Aubry, M.: Satellite studies of magnetospheric substorms on August 15, 1968, 9. Phenomeno-logical model for substorms, J. Geophys. Res., 78, 3131–3149, 1973.
Milan, S. E.: Dayside and nightside contributions to the cross-polar cap potential: Placing an upper limit on a viscous-like interac-tions, Ann. Geophys., 22, 3771–3777, 2004,
http://www.ann-geophys.net/22/3771/2004/.
Makita, K. and Meng, C.-I.: Long-period polar rain variations, so-lar wind and hemispherically symmetric poso-lar rain, J. Geophys. Res., 92, 7381–7393, 1987.
Muehlbachler, S., Farrugia, C. J., Raeder, J., Biernat, H. K., and Torbert, R. B.: A statistical investigation of dayside magneto-sphere erosion showing saturation of response, J. Geophys. Res., 110, A11207, doi:10.1029/2005JA011177, 2005.
Nishida, A.: Geomagnetic diagnosis of the magnetosphere, Springer Verlag, New York, 1978.
Perreault, P. and Akasofu, S.-I.: A study of geomagnetic storms, Geophys. J. R. Astron. Soc., 54, 547–573, 1978.
Reiff, P. H., Spiro, R. W., and Hill, T. W.: Dependence of polar cap potential drop on interplanetary parameters, J. Geophys. Res., 86, 7639–7648, 1981.
Ruohoniemi, J. M. and Baker, K. B.: Large-scale imaging of high-latitude convection with Super Dual Auroral Radar Network HF radar observations, J. Geophys. Res., 103, 20 797–20 811, 1998. Russell, C. T.: The configuration of the magnetosphere, in: Critical Problems of Magnetospheric Physics, edited by: Dyer, E. R., pp. 1–16, National Academy of Sciences, Washington, D. C., 1972.
Russell, C. T., Luhmann, J. G., and Lu, G.: Nonlinear response of the polar ionosphere to large values of the interplanetary electric field, J. Geophys. Res., 106, 18 496–18 504, 2001.
Shinohara, I. and Kokubun, S.: Statistical properties of particle pre-cipitation in the polar cap during intervals of northward inter-planetary magnetic field, J. Geophys. Res., 101, 69–82, 1996. Siscoe, G. L., Erickson, G. M., Sonnerup, B. U. O., et
al.: Hill model of transpolar potential saturation: Compar-isons with MHD simulations, J. Geophys. Res., 107, 1075, doi:10.1029/2001JA000109, 2002.
Southwood, D. J.: Some features of field line resonance in the mag-netosphere, Planet. Space Sci., 22, 483–491, 1974.
Southwood, D. J.: Magnetopause Kelvin-Helmholtz instability, in: Proceedings of the Magnetospheric Boundary Layers Confer-ence, ESA SP-148, pp. 357–364, European Space Agency, Paris, 1979.
Stern, D. P.: Energetics of the magnetosphere, Space Science Rev., 39, pp. 193–213, 1984.
Viljanen, A. and Haekkinen, L.: IMAGE magnetometer netwoek, in: Satellite-Ground Based Coordination Sourcebook, edited by: Lockwood, M., Wild, M. N., and Opgenoorth, H. J., ESA Publ. SP-1198, 111–117, 1997.
Yaeger, D. M. and Frank, L. A.: Low-energy electron intensities at large distances over the Earth’s polar cap, J. Geophys. Res., 81, 3966–3976, 1976.
Yumoto, K., Tanaka, Y., Oguti, T., Shiokawa, K., et al.: Globally coordinated magnetic observations along 210 degrees magnetic meridian during STEP period. 1) Preliminary results of low lati-tude Pc 3s, J. Geomag. Geoelectr., 44, 261–276, 1992.