HAL Id: hal-02923411
https://hal.archives-ouvertes.fr/hal-02923411
Submitted on 16 Sep 2020
HAL is a multi-disciplinary open access
archive for the deposit and dissemination of
sci-entific research documents, whether they are
pub-lished or not. The documents may come from
teaching and research institutions in France or
abroad, or from public or private research centers.
L’archive ouverte pluridisciplinaire HAL, est
destinée au dépôt et à la diffusion de documents
scientifiques de niveau recherche, publiés ou non,
émanant des établissements d’enseignement et de
recherche français ou étrangers, des laboratoires
publics ou privés.
Distributed under a Creative Commons Attribution| 4.0 International License
Regional carbon fluxes from land use and land cover
change in Asia, 1980–2009
Leonardo Calle, Josep Canadell, Prabir Patra, Philippe Ciais, Kazuhito Ichii,
Hanqin Tian, Masayuki Kondo, Shilong Piao, Almut Arneth, Anna Harper, et
al.
To cite this version:
Leonardo Calle, Josep Canadell, Prabir Patra, Philippe Ciais, Kazuhito Ichii, et al.. Regional carbon
fluxes from land use and land cover change in Asia, 1980–2009. Environmental Research Letters, IOP
Publishing, 2016, 11 (7), pp.074011. �10.1088/1748-9326/11/7/074011�. �hal-02923411�
Environmental Research Letters
LETTER • OPEN ACCESS
Regional carbon fluxes from land use and land
cover change in Asia, 1980–2009
To cite this article: Leonardo Calle et al 2016 Environ. Res. Lett. 11 074011
View the article online for updates and enhancements.
Related content
Simulated carbon emissions from land-use change are substantially enhanced by accounting for agricultural management
-The terrestrial carbon budget of South and Southeast Asia
-Nitrogen and phosphorous limitation reduces the effects of land use change on land carbon uptake or emission
-Recent citations
Assessing the regional climate impact on terrestrial ecosystem over East Asia using coupled models with land use and land cover forcing during 1980–2010 Fuqiang Cao et al
-Modeling changes in China’s 2000–2030 carbon stock caused by land use change Yongjiu Feng et al
-A segmentation algorithm for characterizing rise and fall segments in seasonal cycles: an application to XCO2 to estimate benchmarks and assess model bias
Leonardo Calle et al
Environ. Res. Lett. 11(2016) 074011 doi:10.1088/1748-9326/11/7/074011
LETTER
Regional carbon
fluxes from land use and land cover change in Asia,
1980
–2009
Leonardo Calle1 , Josep G Canadell2 , Prabir Patra3 , Philippe Ciais4 , Kazuhito Ichii3,5 , Hanqin Tian6 , Masayuki Kondo3 , Shilong Piao4,7 , Almut Arneth8 , Anna B Harper9 , Akihiko Ito5 , Etsushi Kato10 , Charlie Koven11, Stephen Sitch12, Benjamin D Stocker13,14, Nicolas Vivoy4, Andy Wiltshire15, Sönke Zaehle16and Benjamin Poulter11 Department of Ecology and Institute on Ecosystems, Montana State University, Bozeman, MT, 59717, USA 2 Global Carbon Project, CSIRO Oceans and Atmospheric Research, GPO Box 3023, Canberra, ACT 2601, Australia
3 Department of Environmental Geochemical Cycle Research/Japan Agency for Marine-Earth Science and Technology (JAMSTEC),
3173-25 Showa-machi, Kanawaza-ku Yokohama, 2360001, Japan
4 Laboratoire des Sciences du Climat et de l’Environnement (LSCE CEA-CNRS-UVSQ), Gif-sur-Yvette, France
5 Center for Global Environmental Research, National Institute for Environmental Studies, Japan, Onogawa, Tsukuba, 305-0053, Japan 6 International Center for Climate and Global Change Research and School of Forestry and Wildlife Sciences, Auburn University, Auburn,
AL 36849, USA
7 Laboratoire de Glaciologie et Géophysique de l’Environnement, CNRS and Université Grenoble Alpes, Grenoble F-38041, France 8 Institute of Meteorology and Climate Research, Atmospheric Environmental Research, Karlsruhe Institute of Technology, D-82467
Garmisch-Partenkirchen, Germany
9 College of Engineering, Mathematics, and Physical Sciences, University of Exeter, Exeter, UK 10 The Institute of Applied Energy(IAE), Minato, Tokyo 105-0003, Japan
11 Earth Sciences Division, Lawrence Berkeley National Lab, Berkeley, CA, USA 12 Department of Geography, University of Exeter, Exeter EX4 4QF, UK
13 Imperial College London, Life Science Department, Silwood Park, Ascot, Berkshire SL5 7PY, UK
14 Climate and Environmental Physics, and Oeschger Centre for Climate Change Research, University of Bern, Bern, Switzerland 15 Met Office Hadley Centre, Exeter EX1 3PB, UK
16 Biogeochemical Integration Department, Max Planck Institute for Biogeochemistry, Hans-Knoll-Str. 10, D-07745 Jena, Germany
E-mail:Leonardo.Calle@msu.montana.edu
Keywords: land use change, deforestation, DGVM, carbon budget Supplementary material for this article is availableonline
Abstract
We present a synthesis of the land-atmosphere carbon
flux from land use and land cover change (LULCC)
in Asia using multiple data sources and paying particular attention to deforestation and forest regrowth
fluxes. The data sources are quasi-independent and include the U.N. Food and Agriculture
Organization-Forest Resource Assessment
(FAO-FRA 2015; country-level inventory estimates), the Emission Database
for Global Atmospheric Research
(EDGARv4.3), the ‘Houghton’ bookkeeping model that incorporates
FAO-FRA data, an ensemble of 8 state-of-the-art Dynamic Global Vegetation Models
(DGVM), and 2
recently published independent studies using primarily remote sensing techniques. The estimates are
aggregated spatially to Southeast, East, and South Asia and temporally for three decades, 1980–1989,
1990–1999 and 2000–2009. Since 1980, net carbon emissions from LULCC in Asia were responsible for
20%
–40% of global LULCC emissions, with emissions from Southeast Asia alone accounting for 15%–
25% of global LULCC emissions during the same period. In the 2000s and for all Asia, three estimates
(FAO-FRA, DGVM, Houghton) were in agreement of a net source of carbon to the atmosphere, with
mean estimates ranging between 0.24 to 0.41 Pg C yr
−1, whereas EDGARv4.3 suggested a net carbon sink
of
−0.17 Pg C yr
−1. Three of 4 estimates suggest that LULCC carbon emissions declined by at least 34% in
the preceding decade
(1990–2000). Spread in the estimates is due to the inclusion of different flux
components and their treatments, showing the importance to include emissions from carbon rich
peatlands and land management, such as shifting cultivation and wood harvesting, which appear to be
consistently underreported.
OPEN ACCESS RECEIVED 1 December 2015 REVISED 10 May 2016 ACCEPTED FOR PUBLICATION 14 June 2016 PUBLISHED 8 July 2016Original content from this work may be used under the terms of theCreative Commons Attribution 3.0 licence.
Any further distribution of this work must maintain attribution to the author(s) and the title of the work, journal citation and DOI.
1. Introduction
Unprecedented growth in energy consumption and rapid land use change in Asia has led to a major reshaping of the regional distribution and magnitude of greenhouse gas(GHG) sources and sinks. Although the combustion of fossil fuels accounts for the largest fraction of anthropogenic carbon emissions in Asia (Liu et al2015), land transformation in this region has
some of the fastest rates of change in the world and high spatial contrast with deforestation in tropical Asia and reforestation in East Asia (Hansen et al 2013, FAO-FRA 2015). Globally, net carbon emissions from land use and land cover change(LULCC) are estimated at about 1.0± 0.8 Pg C yr−1(Ciais et al2013, Le Quéré et al2015). Asia is responsible for a growing fraction of
the global LULCCflux, partly because of the slowdown of deforestation in South America(Hansen et al2013, Federici et al 2015, Kim et al 2015). However, the
contributing grossfluxes of the net LULCC flux, in Asia and globally, are among the most uncertain quantities of the anthropogenic global carbon budget (Harris et al2012a, Pongratz et al2014).
The magnitude of LULCC net CO2flux depends on the size of the carbon pools immediately com-busted or respired biomass(wood, leaves, roots), the fate of on-site slash materials, subsequent land-man-agement practices and effects on soil carbon(e.g., slash and burn, shifting cultivation, permanent agriculture) and the fate of off-site harvested wood products, e.g., wood harvested for paper, fuel, pulp, and building material(Hurtt et al2006,2011, Earles et al2012). The
Intergovernmental Panel on Climate Change Assess-ment Report 5(IPCC AR5; Ciais et al2013) reports a
50%–100% likelihood that global LULCC carbon emissions decreased between the 1990s (1.5 ± 0.8 Pg C yr−1) and the 2000s (1.0 ± 0.8 Pg C yr−1). However, large uncertainties are associated with the magnitude of change and with the regional attribution of carbon fluxes (Foley et al 2005, Friedlingstein et al2010, Hansen et al 2013, Ciais et al2013, Kim et al2015). Carbon emissions from deforestation and
forest degradation are uncertain in Asia, and particu-larly in Southeast Asia (Hansen et al 2013, Achard et al2014). A full and updated quantification of Asia’s
LULCC fluxes and their sources of uncertainty are necessary to constrain the perturbation of the global carbon budget, and to help understand the role of ter-restrial ecosystems in Asia in contributing to, and mitigating increases of, GHG concentrations.
Here we present a comprehensive synthesis of the regional net carbonflux from LULCC in Asia using multiple data sources and models, and paying part-icular attention to its contributingfluxes. Estimates of LULCCfluxes are analyzed from a variety of quasi-independent data sources, including the FAO-FRA, the Emission Database for Global Atmospheric Research (EDGARv4.3), a bookkeeping model by Houghton et al(2012), an ensemble of 8
state-of-the-art Dynamic Global Vegetation Models (DGVM) (table S1 in supplementary material). These analyses are supplemented with estimates taken from two remote-sensing studies. The estimates are aggregated spatially to Southeast Asia, East Asia, and South Asia (figure1; countries listed in table S2), and provided for three decades, 1980–1989, 1990–1999 and 2000–2009.
2. Methods
2.1. Datasets on emissions from LULCC
Three data sources were analyzed for this study, representing the major approaches frequently used in LULCC assessments (Ciais et al 2013). These data
sources vary by the methods used to estimate LULCC fluxes, particularly with regards to the use of different sources for LULCC, carbon stocks, and methods to account for forest regrowth and legacy emissions (table1). Here, we categorize the data sources by their
general methodologies: (i) bookkeeping model (Houghton et al 2012) and inventory accounting
(EDGARv3.1, FAO-FRA 2015), (ii) eight carbon-cycle models(DGVMs), and (iii) literature estimates from remote-sensing studies (Harris et al 2012b, Achard et al2014).
For all data sources, carbon fluxes (sources and sinks) from natural lands (including forests) were con-sidered, but only some datasets included emissions from agricultural lands(table2). All datasets included
fluxes from aboveground and belowground biomass, whereas only a few datasets included emissions from litter, soil,fire, or land management. Secondary forest regrowth contributes to carbon uptake, but it was not included consistently across the data sources(table2).
The DGVM carbon-cycle models and the book-keeping model differed from the other approaches based on their inclusion of instantaneous (e.g., the immediate combustion of fuel wood) as well as legacy (or delayed) emissions (Pongratz et al2014), e.g., from
slash left on-site or delayed decomposition of wood products used in furniture or homes. The importance of the distinction is that emissions associated with legacyfluxes are partly realized and included in pre-sent and future emission estimates, and can amount to as much as instantaneous emissions themselves (Houghton et al2012). We summarize the data
sour-ces in detail below, but refer to the supplementary material(section S1) for a more detailed description of the datasets and their methods.
2.1.1. Bookkeeping and inventory approaches
The bookkeeping model(Houghton et al2012) tracks
all carbon pools(i.e., wood, roots, leaves, soil, litter) within a hectare, updating carbon pools over time based on ecosystem-specific growth and decay equations; the size of the carbon pools are initialized based on inventories. In contrast, standard inventory approaches, including the FAO-FRA and EDGAR used 2
here, use similar accounting to track carbon over time, but typically they do not track carbon losses from soils and litter and use country-level estimates for carbon aboveground vegetation. A common underlying source for the change in forest area used in the bookkeeping and inventory approaches (FAO-FRA, EDGARv3.1) comes from country-level FAO-FRA reporting. The inventory approaches utilize IPCC (2006) Tier 1 methods (Ruesch and Gibbs2008) to
estimate LULCC emissions at the country level by the difference in carbon gained from biomass growth and carbon lost from deforestation. The bookkeeping model and EDGARv4.3 both include carbon emis-sions from peatlandfires. We compare the inventory estimates analyzed in this study with a similar
approach adopted by Pan et al(2011). Pan et al (2011)
utilized a variety of national-level forest inventories other than FAO-FRA to estimate forest area, changes in forest area, and carbon stocks, but they utilized the Houghton (2003) bookkeeping model to estimate
forest regrowth and legacy fluxes from soil carbon after land use change.
2.1.2. Carbon-cycle models
As part of the TRENDY model inter-comparison project, version 3(Sitch et al2015), the eight DGVMs
in this study were used to estimate carbon stocks and fluxes using process-based approaches and to predict global vegetation distribution based on impacts of climate, atmospheric CO2 concentrations, and land
Figure 1. Geographic areas were pre-defined for this study, corresponding to Southeast Asia (green), East Asia (blue), and South Asia (purple).
Table 1. Datasets and methods used for determining land use and land cover, carbon stocks, and forest regrowth. The HYDE data model version 3.0(Goldewijk2001) determines land use in the DGVMs, and an updated version of HYDEv3.1 is used in the Tao et al (2013) study.
The Global Land Cover 2000(GLC 2000) and the FAO Global Ecological Zone map (FAO-GEZ) provide land use and land cover for the EDGARv4.3 dataset.
Dataset Land use and land cover Carbon stocks Forest regrowth
FAO-FRA IPCC 2006 Tier1 methods Country-level reporting
IPCC 2006 Tier1 methods Carbon per hectare by Biome or Region
N/A EDGARv4.3 GLC 2000 and FAO-GEZ map for
forest area FAO-FRA for area change
IPCC 2006 Tier1 methods Carbon per hectare by Biome
IPCC 2006 Tier1 methods Bio-mass increment factors
DGVMs HYDE Process-based estimate Process-based estimatea Achard et al(2014) Remote-sensing Remote-sensing, allometric model Implicita
Harris et al(2012b) Remote-sensing Remote-sensing, allometric model N/A Houghton
et al(2012)
FAO-FRA Bookkeeping model Country-level statistics
Biomass Growth equation
Pan et al(2011) FAO-FRA, Govt. reports FAO-FRA, Houghton et al(2012) Houghton et al(2012)
Tao et al(2013) HYDE 3.1 Process-based estimate Process-based estimatea
aTransient response to climate and CO
2fertilization is included; implicit inclusion in Achard et al(2014).
3
Table 2. Component carbon emissions and factors affecting carbon stocks(IRR, FERT, transient response) included in each of the datasets in this study. Emissions from changes in aboveground and belowground live biomass (AGB and BGB, respectively) are included in all datasets. Emissions from fire may also be included as an emission source, and these may be independent of emissions from land use change. Forest regrowth can offset carbon emissions and the rate of regrowth can be modified by changes in climate (clim) or from CO2fertilization(CO2), which is defined as a transient response; these effects are implicitly included in the remote sensing study by Achard et al (2014). The carbon emissions from wood harvest products(WH) are reported separately for the EDGARv4.3 dataset; these emissions could not be separated from Houghton et al (2012) or Pan et al (2011). The relative weight score reflects the inclusion carbon fluxes from individual carbon stocks,fire and forest regrowth, relative to the dataset with the maximum number of component fluxes included in the estimate.
Change in carbon stock Land management Forest regrowth
Dataset Relative weight Emission timescale Land types AGB BGB Litter Soil Peat Fire SC WH CH IRR FERT Transient response
FAO-FRA 0.67 I, La N, Ag ✓ ✓ ✓ ✓b EDGARv4.3 1.00 I N ✓ ✓ ✓c ✓c ✓ ✓ DGVMs 1.00 I, L N, Ag ✓ ✓ ✓ ✓ ✓ d,e d,e d,e d,e d,e ✓ clim CO 2 Achard et al(2014) 0.63 I N ✓ ✓ ✓ clim CO2 Harris et al(2012b) 0.50 I N ✓ ✓ Houghton et al(2012) 1.00 I, L N, Ag ✓ ✓ ✓ ✓ ✓ ✓ ✓ ✓ Pan et al(2011) 0.88 I N, Ag ✓ ✓ ✓ ✓ ✓ ✓ Tao et al(2013) 0.88 I, L N, Ag ✓ ✓ ✓ ✓ ✓ ✓ ✓ ✓ clim CO2
Emission timescale: immediate(I), legacy (L). Land types: natural(N), agriculture (Ag).
Carbon stock: aboveground biomass(AGB), belowground biomass (BGB).
Land management: shifting cultivation(SC), wood harvest (WH), crop harvest (CH), irrigation (IRR), nitrogen fertilization (FERT).
aLegacy emissions are only included for losses to organic soil carbon from agricultural areas. bEmissions from combustion of organic soils during biomass burning.
cEmissions from losses to organic and peat soils is derived fromfire emissions in the GFEDv3.1 dataset (van der Werf et al2010). dVISIT model included SC, WH,CH, IRR, and FERT.
eCLMv4.5 included SC,WH, CH, IRR, and FERT.
4 Environ. Res. Lett. 11 (2016 ) 074011
cover change. Some models include an interactive nitrogen cycle(such as CLMv4.5, LPX, OCN), which often result in smaller forest regrowth than models without C–N coupling (Yang et al2010). The DGVM
models(Sitch et al 2015) utilized alternate versions of land cover from the HistorY Database of the global Environment, HYDE version 3 (Goldewijk 2001)
(table 1) to determine land use change. DGVM
estimates of LULCCfluxes are obtained by difference of the net land-atmosphere CO2 flux between one simulation(S3) with land use change, transient CO2 concentrations and variable climate and an alternate simulation (S2) with only transient CO2, variable climate, and pre-industrial land cover in 1860(Sitch et al 2015). Only the CLMv4.5, LPX and VISIT models accounted for gross land cover transitions(e.g. parallel abandonment to and from agricultural land within a grid cell), and only CLMv4.5 and VISIT accounted for carbonfluxes from wood and crop harvest. Finally, we compare the DGVM estimates with the estimates from a regionally-parametrized carbon-cycle model by Tao et al(2013), which included fluxes from crop harvest,
irrigation and nitrogen fertilization.
2.1.3. Remote-sensing Studies
We use literature estimates from two remote-sensing-based studies(Harris et al2012b, Achard et al2014)
estimated forest area, changes in forest area, and carbon stocks from independent sources of satellite data for both land cover and biomass. Their emission estimates do not include emissions from the decay of litter, soils, including peatlands, or the effects of forest degradation and land management.
2.2. Analyses
2.2.1. Changes in forest area
Changes in forest area and carbon stocks are two major determinants of LULCC emissions (Houghton et al2012). Therefore, we provide estimates of changes
in forest area from FRA 2015 and the HYDE data product, supplemented with observed changes reported in recent literature. Different carbon-cycle modeling groups were responsible for determining rules for land cover transitions(e.g. primary forest -> agriculture, or secondary forest -> agriculture), and therefore make different assumptions about how to specify land-use transitions prescribed by HYDE. One approach assumes an equivalent loss of forest area for an increase in either cropland or pasture(section S4.1; figure S1). The differences in approaches were not quantified, but can introduce carbon fluxes that are included in some, but not all DGVMs. The changes in forest area, by region and decade, are provided in the supplementary material(section S4.1; figure S1).
2.2.2. Carbon in biomass and DGVM performance ranking
In this study, biomass estimates based on remote-sensing studies from Baccini et al(2012), and Liu et al
(2015) are used as benchmarks to filter-out DGVMs
with unreasonably high carbon stock in vegetation, and therefore, biased carbon fluxes from LULCC (supplementary materials section 3). Based on the
biomass benchmarks, the CLMv4.5, OCN, and ORCHIDEE models werefiltered-out from DGVM emission estimates from Southeast Asia, and the CLMv4.5, JULES, and OCN models werefiltered-out from DGVM emission estimates from East Asia; no models were filtered-out for South Asia. We also provide IPCC 2006 Tier 1, country-level, estimates of aboveground biomass from the FRA 2010 report. We provide summary estimates of carbon in total and aboveground biomass by region, and country (supple-mentary material section S4.1;figures S2 and S3). .
2.2.3. Carbon emissions from LULCC: statistical summaries by geographic regions
The LULCC emissions were summarized with mean and standard deviations for each decade and region. Emission estimates reported by the DGVM ensemble have been summarized by taking the mean of decadal-mean estimates from individual DGVMs in the ensemble, after omitting individual models with unrealistic biomass(see section 2.2.2); the range of
estimates among the models is provided as a measure of uncertainty. We use an approach similar to the one of IPCC AR5(Ciais et al2013) and from Kirschke et al
(2013) to assign a level of confidence in the sign of the
emissions estimate and to the direction of change in emissions between decades by indicating the level of agreement(low, medium, high) among studies and the robustness of evidence (number of studies). In addition, we present a weighted-mean estimate of the mean decadal estimates from each approach(table3),
which helps to address the inclusion of different componentfluxes among estimates. First, we convert table2into a binary table and we focus only onfluxes from carbon stocks,fire, and forest regrowth (e.g., if a particular estimate includesfire flux, then it is scored 1, otherwise 0). We give each of these component fluxes equal weight, but we refrain from scoring legacy fluxes, fluxes from climate response, and fluxes from land management because we cannot quantify their contribution relative to the otherfluxes. The relative weight for each approach(table2) reflects the
max-imum number of component fluxes in any single approach. The weighted-mean of mean decadal esti-mates is presented in table4, along with the qualitative assessment of confidence in the magnitude and change among decades.
5
3. Results: carbon emissions from LULCC
3.1. Southeast AsiaThere was high agreement among all estimates in the magnitude of carbon emissions from LULCC during the 1980s in Southeast Asia (tables 3, 4; figure 2),
ranging from 0.22 to 0.29 Pg C yr−1. In the 1990s, there was also high agreement and high confidence that the emissions were at least 0.21 Pg C yr−1, but this value was not well constrained with a range of[0.21,
0.66] Pg C yr−1. Between the 1980s and 1990s there was moderate agreement for increasing emissions, although the magnitude of the increase was uncertain. In comparison, Tao et al (2013) reported emission
estimates that overlapped between the two time periods, suggesting little to no change in emissions. During the 2000s, there was high agreement among data sources and high confidence indicating that emission estimates were at least 0.11 Pg C yr−1. Although the range of the estimates ([0.11,
Table 3. Regional carbon emissions from LULCC in Asia by decade(petagram carbon per year). Uncertainty is presented as mean± standard deviation or as a range of maximum and minimum estimates.
Region Ensemble/Study 1980–1989 1990–1999 2000–2009 Southeast Asia DGVMs 0.22[0.15, 0.39] 0.33[0.16, 0.54] 0.31[0.18, 0.53] FAO-FRA 0.33± 0.06 0.41± 0.06 EDGAR v4.3 0.11± 0.13 Houghton et al(2012)a 0.29± 0.02a 0.66± 0.36a 0.46± 0.13a Achard et al(2014) [0.24, 0.35] [0.24, 0.37] Harris et al(2012b)b [0.17, 0.32]b Pan et al(2011)a 0.30a 0.14a Tao et al(2013) [0.23, 0.26] [0.21, 0.24] East Asia DGVMs 0.29[0.16, 0.44] 0.27[0.12, 0.40] 0.05[−0.06, 0.16] FAO-FRA −0.11 ± 0.0003 −0.12 ± 0.02 EDGAR v4.3 −0.25 ± 0.02 Houghton et al(2012) −0.02 ± 0.006 −0.03 ± 0.002 −0.04 ± 0.005 Pan et al(2011)a −0.21a −0.24a South Asia DGVMs 0.04[0.01, 0.13] 0.09[0.03, 0.19] 0.04[0.001, 0.12] FAO-FRA 0.012± 0.00 −0.018 ± 0.01 EDGAR v4.3 −0.03 ± 0.01 Houghton et al(2012) −0.006 ± 0.002 −0.014 ± 0.005 −0.015 ± 0.005 Harris et al(2012b)* [0.014, 0.027]* aIncludes carbon emissions from wood harvest, both instantaneous and legacy.
bGross carbon emissions from deforestation only, for years between 2000 and 2005.
Table 4. Ranking of agreement and confidence among data sources for estimates of change and sign of emissions by region and decade. The weighted-mean of all mean decadal estimates is also listed by region and decade(mean Pg C per year ± SD of means). Triangle indicates a carbon source(up, red) or carbon sink (down, green), or an increasing (up, red) or deceasing (down, green) change from previous decade; a circle indicates that there is no change, given the stated uncertainties, between the decade considered and the previous one. Size of the triangle/circle indicates the number of independent estimates in agreement; small: 1 studies, medium: 2–3 studies, large: 4+ studies. Esti-mates with high agreement have only a single triangle, and high confidence is evident in estimates with the largest triangles.
6
0.46] Pg C yr−1) was smaller than in the previous decade, the weighted-mean estimate in the 2000s (0.363 ± 0.131 Pg C yr−1) was larger than weighted-mean estimate for the 1990s (0.255 ± 0.019 Pg C yr−1). Among all estimates, there was low agree-ment in the change of emissions between the 1990s and the 2000s. The bookkeeping model and Pan et al (2011), both of which utilized similar data sources
from FAO-FRA, suggested a 30%–53% reduction in emissions, respectively, between the 1990s and 2000s. The DGVMs and Achard et al (2014) suggested a
smaller reduction of less than 10% or no change in emissions, respectively, between the 1990s and the 2000s. By contrast, the FAO-FRA suggested an increase in emissions(24%+) between the 1990s and 2000s(table3), but it is unclear how the absence of
legacy and regrowthfluxes (table2) may have
influ-enced their estimates. Similarly, the inclusion of emissions from harvested wood products in the estimates by the bookkeeping model and Pan et al (2011) resulted in higher emissions than those from
other data sources that did not include these important fluxes, although its inclusion would not have impacted an assessment of change in emissions between decades because wood harvest volumes did not change appre-ciably among decades according to the FRA(2015).
Overall, the carbon emissions from LULCC in Southeast Asia, taken as the weighted-mean estimate among all data sources, is estimated to be 0.363 ± 0.131 Pg C yr−1 in the 1990s and +0.271 ± 0.116 Pg C yr−1in the 2000s(table4), or 20%–30% of
global LULCC emissions, respectively, using global LULCC estimates based on the bookkeeping model.
The increasing fraction of carbon emissions from LULCC in Southeast Asia, relative to global LULCC emissions, is partly due to near constant emissions during the 1990s and 2000s, and at the same time, declining global emissions from LULCC(figure3).
3.2. East Asia
In East Asia, there was low agreement in the estimate of netfluxes from LULCC in the 1980s between the bookkeeping model and the DGVMs(tables3,4). The
DGVMs also simulated higher emissions during the 1990s that were of similar magnitude as LULCC emissions in Southeast Asia during the 2000s(table3).
By contrast in the 1990s, there was moderate agree-ment among data sources and medium confidence indicating a small forest regrowth sink(tables3,4). In
the 2000s, there was also moderate agreement in the deforestation and regrowth trends, and high agree-ment in the strengthening of a carbon sink compared tofluxes from the 1990s; only the magnitude of the change between decades differed among the data sources (table 4). The DGVMs generally estimated
much higher emissions in the 1980s and 1990s, but there was a strong decline in emissions during the 2000s from previous decades, and a regrowth sink was evident in a few of the models(figures S5, S8).
DGVMs do not quantify explicitly how the legacy emissions from past land use change contribute to higher emission estimates, but it is clear that emissions from LULCC in East Asia have declined substantially (figure S8), to less than 10% of the global emissions from LULCC in the 2000s(figure3). The decreasing
fraction of emissions from LULCC in East Asia,
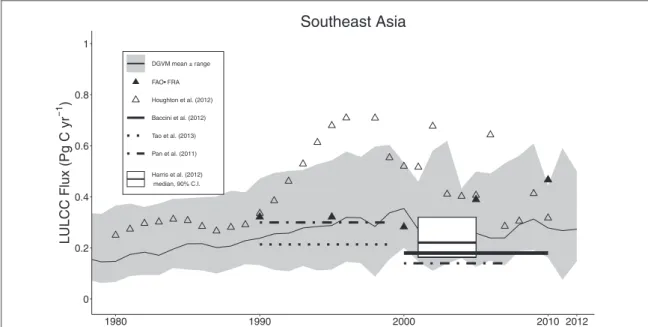
Figure 2. Carbon emissions from land use and land cover change(LULCC) in Southeast Asia between 1980 and 2012. Houghton et al (2012) also reports an outlier emission estimate of 1.61 Pg C in 1997 (not shown), resulting from extensive peat fires in the region;
these emissions were not included in the estimates of other studies reported here. The DGVM ensemble{JULES, LPJ, LPJ-GUESS, LPX, VISIT} mean estimate (thin solid line) is presented along with the range of annual estimates among the models (gray shaded area). Previously published estimates are provided as point and decadal (boxplot, and the horizontal dashed, dotted and solid lines) mean estimates.
7
according to DGVMs, can be attributed to a stronger decline in emissions from this region than the decline in LULCC emissions observed at the global scale; this pattern is driven largely by a strong decline in LULCC emissions and an intensification of the land sink in China, due to reforestation and forest regrowth according to some estimates (Fang et al 2001, Piao et al2009, Li et al2015).
3.3. South Asia
In South Asia, there was low agreement among LULCC netflux estimates during the 1980s, with the bookkeeping model estimating a carbon sink, and the DGVMs a carbon source(table3). In the 1990s, there
was moderate agreement in the sign and magnitude of the LULCC flux being a net source of carbon as estimated by the DGVMs and FAO-FRA (less than 33% difference), whereas the bookkeeping model continued to estimate a carbon sink(table3). There
was also low agreement about the direction of change in emissions (increasing or decreasing) between the 1980s and 1990s, with the DGVMs suggesting that carbon emissions doubled between the two time periods, and the bookkeeping model suggesting the opposite, that the strength of the regrowth sink increased during the 1990s relative to 1980s levels (table 3). In the 2000s, there was high agreement
among data sources and medium confidence in
decreasing emissions compared to estimates from the 1990s, along with moderate agreement in a regrowth sink (tables 3 and 4, and figure S9). Although the emissions estimated by the DGVMs were mostly positive(figure S6), it is clear that modeled carbon in biomass was not a factor because there was little bias between individual DGVMs and the biomass bench-marks(figures S2, S3). Therefore, it is possible that factors related to climate could have influenced the emission estimates in the DGVMs, but which would not have been included in the other estimates(table2).
Overall, emissions from LULCC in South Asia are estimated to be less than 5% of global LULCC emissions(figure3), the bulk of these carbon
emis-sions are from India alone, and the decline in emissions between 1990s and 2000s is shown in most estimates(figure S9).
4. Discussion
4.1. Regional emissionsThe goal of this article was to present the carbon emissions from LULCC as estimated by a range of approaches and for these estimates to serve as a baseline for future studies. The problems associated with having multiple estimates of the net carbonflux of LULCC based on different contributingfluxes have
Figure 3. Total emissions from land use and land cover change(LULCC) (top) and the contribution of LULCC emissions in Asia as a percent of Global LULCC emissions(bottom) for years 1901–2012. Estimates for Global and Asian LULCC fluxes are obtained from DGVM ensemble means(n = 8). In the late 2000s, emissions from LULCC in Southeast Asia have accounted for 15%–25% of global LULCC emissions. Emissions from LULCC in East Asia peaked in the late 1980s at 25% of global LULCC emissions. A decline in the percent contribution of LULCC emissions in Asia to global LULCC emissions during the 1990’s results mainly from an increase in Global LULCC emissions during the same time period.
8
been discussed at length before(Pongratz et al2014, Rosa et al 2014), as well as adding unwarranted
controversy with regards to the magnitude of the carbon flux (Harris et al 2012a). We provided a
weighted-means approach to account for the inclusion of componentfluxes in some, but not in all estimates, and we treated each component flux with similar weight. The weighted-mean estimates provide some satisfaction for an ensemble-mean estimate of the LULCCflux, but it does have its own inherent biases. For example, some componentfluxes will be impor-tant in some regions, but not in others(e.g. peat flux), and therefore the relative contribution of the comp-onentflux to the overall LULCC flux will be greater (or less). The accuracy of the weighted-means approach can therefore be improved if we can ascribe some value [0, 1] to the relative influence of each component flux to the overall net carbonflux estimate. For example, if the wood harvestflux can be quantified and is known to be 90% of the LULCCflux in a particular region or time period, then those methods that include a wood harvest flux would be weighted higher than those methods that do not include wood harvest, and a more accurate ensemble estimate would prevail; until the relative contribution of the componentfluxes can be quantified the weighted-mean ensemble estimates should be used with discretion. Below, we discuss the major patterns in emissions among regions as evi-denced by this study, and we review the magnitude and contribution of each componentflux to the total net LULCCflux from a review of the literature.
The bookkeeping model and DGVMs both suggest that total Asian emissions have declined by at least 34% between 1990s and 2000s, driven largely from an increasing carbon sink in China, with the carbon sink of South Asia playing a smaller role. However, the inventory data (FAO-FRA) suggests that emissions grew by 17% across Asia between 1990s and 2000s, but it was more due to larger increases in carbon emissions from Southeast Asia than a smaller decreases in carbon emissions from East and South Asia regions, which is consistent with the bookkeeping model and DGVMs. For Southeast Asia, most methods suggest similar car-bonfluxes between 1990s and 2000s (figure S7), and at most, a decline in carbonfluxes between the 1990s than in the 2000s, which suggests that the missing fluxes of a tier-1 approach such as the FAO-FRA has important effects on the netflux; alternatively, carbon stocks at the country-level could be over estimated which would also lead to higher emissionsfluxes.
In Southeast Asia, there is general agreement among the bookkeeping model, the FAO-FRA, and DGVMs showing that net carbon emissions from LULCC in Southeast Asia is responsible for 75%–88% of Asian LULCCfluxes in the 2000s. Recent remote-sensing studies of deforestation activity in Southeast Asia showed that forest loss has been constant or increasing during the past two decades (Hansen et al2013, Achard et al2014, Margano et al2014, Stibig
et al2014, Kim et al2015), suggesting that LULCC
emissions should be constant or increasing as well, consistent with the changes in carbon emissions between decades reported in this study. As a caveat, Loarie et al(2009) and Song et al (2015) reported that,
independent of gross losses to forest areas, carbon emissions from LULCC can be largely driven by spatial heterogeneity in carbon density. It is therefore plau-sible that decreasing trends in carbon emissions from LULCC in Southeast Asia between 1990s and 2000s, from the bookkeeping model as reported by Pan et al (2011), occurred as a result of the use of carbon stock
datasets that were derived from country-level statis-tics, and were therefore biased too low(figures S2, S3). Before progress can be made on reducing the uncer-tainty in LULCC emissions in this region, it may be prudent tofirst evaluate the relative impact on LULCC emissions from the uncertainties inherent in the spa-tial variability in carbon density and areal changes in forest cover.
In East Asia, an increase in forest regrowth is responsible for reversing a carbon source to carbon sink from LULCC in East Asia between the decades 1990s and 2000s, at the very latest, and this is mainly driven by China, confirming similar reports by Piao et al(2012). The inclusion of legacy emissions may be
the cause of an apparent lag in the source-sink dynam-ics observed in the DGVM emission estimates in East Asia between the 1980s, 1990s(both carbon sources) and the 2000s, during which there is a noticeable decline in emissions from previous decades(figure 4) and a carbon sink estimated by a few models(figure S5). The inclusion, or omission, of legacy emissions may explain the differences in decadal estimates for East Asia made by the DGVMs and inventory meth-ods. Even still, the high agreement among the data sources suggest high confidence in East Asia trending towards a stronger carbon sink than in past decades even while accounting for LULCC in the region (figure S8).
4.2. Land management
Wood harvesting practices in Borneo and Indonesia are particularly relevant drivers of emissions, as wide-spread practice of selective logging and clear-cutting results in considerable loss of biomass and carbon uptake capacity(Carlson et al2012, Gaveau et al2014, Kemen-Austin et al 2015). Wood harvest practices
result in forest-degradation and deforestation and can also create increasingly fragmented forests, but the effects of fragmentation, which are largely ignored, can amount to carbon emissions of 0.12–0.24 Pg C yr−1 across all tropical forests (Pütz et al 2014). In their carbon-cycle model, Tao et al
(2013) also prescribed cropping rotations, irrigation
and fertilization amounts from FAO country-level statistics. However, it is unclear to what degree these practices impact carbon fluxes because Tao et al 9
(2013)’s emission estimates were roughly inline with
other data sources reported here, which did not include these land management practices. The follow-ing emissions from wood harvest practices are based on EDGARv4.3, and these were not used for the EDGARv4.3 total LULCC emissions presented in table 3, to allow adequate comparison to other estimates. Including emissions from wood harvest alone would increase emission estimates by 0.28 ± 0.01 Pg C yr−1in East Asia, by 0.48± 0.01 Pg C yr−1in South Asia, and 0.40 ± 0.01 Pg C yr−1in Southeast Asia, which would then switch East and South Asia regions to net carbon emitters from LULCC.
4.3. Peat and soil carbon losses fromfire
Only the EDGARv4.3 emission estimates, which utilized the GFEDv3.1 dataset from van der Werf et al (2006), include emissions from peat fires; although the
DGVMs and the bookkeeping model did include carbon fluxes from soils, conditions promoting the carbon density of peat soils were not modeled explicitly. Further, none of the estimates in this study reportedfluxes from the areal changes in peatlands (Miettinen et al2016) or the degradation and
decom-position of peat soils, which are more carbon dense and result in higher fluxes than the typically repre-sented organic soils(Hooijer et al 2010). Emissions
from peatfires are substantial fluxes in themselves and can be of the same order of magnitude as carbon emissions due to deforestation at the country-scale (van der Werf et al2006, Hooijer et al2010, Miettinen et al2011, Prentice et al2011). The carbon flux from
peat fires in Southeast Asia are estimated to be at minimum 0.38 Pg C yr−1 for 1997–2006 (Hooijer et al 2006), and 0.08–0.18 Pg C yr−1 for 2000–2006
(van der Werf et al2008), but annual emissions from
peatfires have ranged from 0.81 to 2.57 Pg C in fire intensive years like in 1997–98 (Page et al 2002);
however, the maximum emissions fromfire anomalies in Asia may be closer to 1.3 Pg C, according to an inverse modeling study by Patra et al(2005).
4.4. Gross versus net land use change
Shifting cultivation is a method of rotational cropping that is commonly practiced in the Tropics; it is defined as the simultaneous clearing of forest for agriculture and abandonment of older agricultural land of equal area(Houghton et al2010). Shifting cultivation (i.e.,
gross changes in land use) can amount to a 30% increase in carbon emissions compared to emissions estimated by net changes in land use (Shevliakova et al2009, Stocker et al2014). In this study, only the
bookkeeping model, CLMv4.5, LPX and VISIT mod-els included emission estimates from gross changes in land use. Accounting for shifting cultivation is proble-matic for FAO-FRA emission estimates, and other inventory approaches, because net forest area may not change under shifting cultivation and may be
under-reported. Remote-sensing surveys may be able to capture gross changes in forest cover, but will require more frequent surveys and correct attribution of young forest to the abandonment of managed land, as opposed to natural fires or disturbance. For an in depth review of the effects of gross versus net changes in land use, see (Shevliakova et al 2009, Houghton et al2012, Stocker et al2014, Wilkenskjeld et al2014).
4.5. Forest cover and land use change
Consideration should be given to the use of gridded LULCC datasets that use detailed historical recon-structions from country-specific studies. For example, Tian et al(2014) raised concerns about notable land
use changes in India that were under-documented and missing in global LULCC datasets, such as HYDE. The discrepancies in the HYDE data model are apparent (figure S1), but ideally need to be checked against more reliable data sources, such as satellite imagery. A recent land-use study in China (Liu and Tian 2010) also
suggested a different spatial distribution of cropland and pasture than the distribution predicted by the HYDE dataset, which could have influenced both the magnitude and change in emissions between decades in the DGVM estimates.
4.6. Carbon stocks
In an analysis by Langner et al(2014), biomass maps by
Baccini et al (2012) and Saatchi et al (2011) were
supported for REDD+ reporting, and one approach for their use as a discriminatingfilter for constraining emission estimates was presented in this study, for example by omitting DGVMs that simulated unrealis-tic biomass. The DGVMs and the remote-sensing studies account for spatial variability in carbon density, which is lacking in FAO-FRA and derivative emission estimates. This study used Baccini et al (2012), and Liu et al (2015) biomass maps as a
benchmark to discriminate between DGVM models that were simulating unreasonably high car-bon stocks.
5. Summary
In summary, the range in the magnitude of carbon fluxes from LULCC in each region was large among methods due to the inclusion of different component fluxes, but the direction of change in carbon fluxes between decades was internally consistent among methods(figures S7–S9). A weighted-means approach was used to derive an overall estimate for each region, with each estimate weighted by the number of comp-onentfluxes included, but the relative contribution of each componentflux to the total estimate could be improved.
• In Southeast Asia, there is robust evidence that carbon emissions from LULCC (ignoring peat 10
degradation) were at least 0.19 and 0.11 Pg C yr−1in the 1990s and 2000s, respectively. Southeast Asia is contributing a large fraction of the regional carbon emissions from LULCC, between 75%–88% of regional LULCC emissions in the 2000s.
• There is robust evidence that East Asia switched from a carbon source to a carbon sink (median = −0.12 Pg C yr−1, range = [+0.05, −0.25] Pg C yr−1) from LULCC activities occurring between the 1990s and 2000s.
• In South Asia, there was low agreement in the sign of emissions, but moderate agreement in the presence of a carbon sink, and medium evidence of a change towards a carbon-sink between the 1990s and 2000s.
• To improve the accuracy of LULCC emissions, a reduction in uncertainty is needed in the estimates of carbon in biomass and soils, with particular attention to peatlands, as well as increased focus on providing separate estimates, along with their uncertainties, for the componentfluxes that make up the emissions from LULCC.
• Since 1980, carbons emissions from LULCC in Asia have comprised 20%–40% of global LULCC emis-sions, with carbon emissions from LULCC in Southeast Asia accounting for 15%–25% of global LULCC emissions during the same period.
Acknowledgments
This work was supported by the Asia Pacific Network for Global Change Research (ARCP2013-01CMY-Patra/Canadell). LC was supported by the National Science Foundation East Asia Pacific Summer Institute (EAPSI) Fellowship. KI and PP were supported by the Environment Research and Technology Development Funds(2-1401) from the Ministry of the Environment of Japan. JGC thanks the support from the Australian Climate Change Science Program. AI and EK were supported by ERTDF (S-10) by the Ministry of the Environment, Japan. CK is supported by DOE-BER through BGC-Feedbacks SFA and NGEE-Tropics. AW was supported by the Joint UK DECC/Defra Met Office Hadley Centre Climate Programme (GA01101) and EU FP7 Funding through project LUC4C (603542).
References
Achard F et al 2014 Determination of tropical deforestation rates and related carbon losses from 1990 to 2010 Glob. Change Biol.20 2540–54
Austin K G, Kasibhatla P S, Urban D L, Stolle F and Vincent J 2015 Reconciling oil palm expansion and climate change mitigation in Kalimantan, Indonesia PLoS One10 e0127963
Baccini A et al 2012 Estimated carbon dioxide emissions from tropical deforestation improved by carbon-density maps Nat. Clim. Change2 182–5
Carlson K M, Curran L M, Ratnasari D, Pittman A M, Soares-Filho B S, Asner G P, Trigg S N, Gaveau D A, Lawrence D and Rodrigues H O 2012 Committed carbon emissions, deforestation, and community land conversion from oil palm plantation expansion in West Kalimantan, Indonesia Proc. Natl Acad. Sci. USA109 7559–64
Ciais P et al 2013 Carbon and other biogeochemical cycles Climate Change 2013: The Physical Science Basis ed T F Stocker et al (Cambridge: Cambridge University Press)
Earles J M, Yeh S and Skog K E 2012 Timing of carbon emissions from global forest clearance Nat. Clim. Change2 682–5
EDGARv4.3 2011 Emission Database for Global Atmospheric Research(EDGAR), release version 4.3. European Commission, Joint Research Centre(JRC)/ Netherlands Environmental Assessment Agency(PBL) (http://edgar.jrc. ec.europa.eu)
Fang J, Chen A, Peng C, Zhao S and Ci L 2001 Changes in forest biomass carbon storage in China between 1949 and 1998 Science292 2320–2
Federici S, Tubiello F N, Salvatore M, Jacobs H and Schmidhuber J 2015 New estimates of CO2forest emissions and removals:
1990–2015 Forest Ecology and Management352 89–98
Foley J A et al 2005 Global consequences of land use Science309 570–4
Friedlingstein P, Houghton R A, Marland G, Hackler J, Boden T A, Conway T J, Canadell J G, Raupach M R, Ciais P and Le Quéré C 2010 Update on CO2emissions Nat. Geosci.3 811–2
Gaveau D L A et al 2014 Four decades of forest persistence, clearance and logging on Borneo PLoS One9 e101654
Goldewijk K K 2001 Estimating global land use change over the past 300 years: The HYDE Database Glob. Biogeochemical Cycles
15 417–33
Hansen M C et al 2013 High-resolution global maps of 21st-century forest cover change Science342 850–3
Harris N, Brown S, Hagen S C, Baccini A and Houghton R A 2012a Progress toward a consensus on carbon emissions from tropical deforestation Policy Brief for Winrock International, WHOI, and the Meridian Institute
Harris N L, Brown S, Hagen S C, Saatchi S S, Petrova S, Salas W, Hansen M C, Potapov P V and Lotsch A 2012b Baseline map of carbon emissions from deforestation in tropical regions Science336 1573
Hooijer A, Silvius M, Wösten H and Page S 2006 PEAT-CO2,
Assessment of CO2emissions from drained peatlands in SE
Asia Delft Hydraulics Report p 36(http://peat-co2. deltares.nl)
Hooijer A, Page S, Canadell J G, Silvius M, Kwadijk J, Wösten H and Jauhiainen J 2010 Current and future CO2emissions from
drained peatlands in Southeast Asia Biogeosciences7 1505–14
Houghton R A 2003 Revised estimates of the annual netflux of carbon to the atmosphere from changes in land use and land management 1850–2000 Tellus55B 378–90
Houghton R A, House J I, Pongratz J, Van Der Werf G R, Defries R S, Hansen M C, Le Quéré C and Ramankutty N 2012 Carbon emissions from land use and land-cover change Biogeosciences
9 5125–42
Houghton R A 2010 How well do we know theflux of CO2from
land-use change? Tellus62B 337–51
Hurtt G C, Frolking S, Fearon M G, Moore B, Shevliakova E, Malyshev S, Pacala S W and Houghton R A 2006 The underpinnings of land-use history: three centuries of global gridded land-use transitions, wood-harvest activity, and resulting secondary lands Glob. Change Biol.12 1208–29
Hurtt G C et al 2011 Harmonization of land-use scenarios for the period 1500–2100: 600 years of global gridded annual land-use transitions, wood harvest, and resulting secondary lands Clim. Change109 117–61
Kim D H, Sexton J O and Townshend J R 2015 Accelerated deforestation in the humid tropics from the 1990s to the 2000s Geophys. Res. Lett.42 3495–501
Kirschke S et al 2013 Three decades of global methane sources and sinks Nat. Geosci.6 813–23
11
Langner A, Achard F and Grassi G 2014 Can recent pan-tropical biomass maps be used to derive alternative Tier 1 values for reporting REDD+ activities under UNFCCC? Environ. Res. Lett.9 124008
Le Quéré C et al 2015 Global carbon budget 2014 Earth Syst. Sci. Data7 47–85
Li P, Zhu J, Hu H, Guo Z, Pan Y, Birdsey R and Fang J 2015 The relative contributions of forest growth and areal expansion to forest biomass carbon sinks in China Biogeosciences Discuss12 9587–612
Liu M and Tian H Q 2010 China’s land-cover and land-use change from 1700 to 2005: estimations from high-resolution satellite data and historical archives Glob. Biogeochemical Cycles24 GB3003
Liu Y Y, van Dijk A I J M, de Jeu R A M, Canadell J G, McCabe M F, Evans J P and Wang G 2015 Recent reversal in loss of global terrestrial biomass Nat. Clim. Change5 470–4
Liu Z et al 2015 Reduced carbon emission estimates from fossil fuel combustion and cement production in China Nature524 335–8
Loarie S R, Asner G P and Field C B 2009 Boosted carbon emissions from Amazon deforestation Geophys. Res. Lett.36 L14810
Margono B A, Potapov P V, Turubanova S, Stolle F and Hansen M C 2014 Primary forest cover loss in Indonesia over 2000–2012 Nat. Clim. Change4 730–5
Meittinen J, Shi C and Chin Liew S 2011 Influence of peatland and land cover distribution onfire regimes in insular Southeast Asia Regional Environ. Change11 191–201
Miettinen J, Shi C and Liew S C 2016 Land cover distribution in the peatlands of Peninsular Malaysia, Sumatra, and Borneo in 2015 with changes since 1990 Glob. Ecology Conservation6 67–78
Pan Y et al 2011 A large and persistent carbon sink in the world’s forests Science333 988–93
Page S E, Siegert F, Rieley J O, Boeheim H D V, Jaya A and Limin S 2002 The amount of carbon released from peat and forest firest in Indonesia during 1997 Nature420 61–5
Patra P K, Ishizawa M, Maksyutov S, Nakazawa T and Inoue G 2005 Role of biomass burning and climate anomalies for land-atmosphere carbonfluxes based on inverse modeling of atmospheric CO2Glob. Biogeochemical Cycles19 1–10
Piao S, Fang J, Ciais P, Peylin P, Huang Y, Sitch S and Wang T 2009 The carbon balance of terrestrial ecosystems in China Nature
458 1009–13
Piao S L et al 2012 The carbon budget of terrestrial ecosystems in East Asia over the last two decades Biogeosciences9 3571–86
Pongratz J, Reick C H, Houghton R A and House J I 2014 Terminology as a key uncertainty in net land use and land cover change carbonflux estimates Earth Syst. Dyn.5 177–95
Prentice I C, Kelley D I, Foster P N, Friedlingstein P, Harrison S P and Bartlein P J 2011 Modelingfire and the terrestrial carbon balance Glob. Biogeochem. Cycles25 GB3005
Pütz S, Groeneveld J, Henle K, Knogge C, Martensen A C, Metz M, Metzger J P, Ribeiro M C, de Paula M D and Huth A 2014
Long-term carbon loss in fragmented Neotropical forests Nat. Commun.5 5037
Rosa I M D, Ahmed S E and Ewers R M 2014 The transparency, reliability and utility of tropical rainforest use and land-cover change models Glob. Change Biol.20 1707–22
Ruesch A and Gibbs H K 2008 New IPCC Tier-1 Global Biomass Carbon Map For the Year 2000 Carbon Dioxide Information Analysis Center(http://cdiac.ornl.gov) (Oak Ridge,
Tennessee: Oak Ridge National Laboratory)
Saatchi S S et al 2011 Benchmark map of forest carbon stocks in tropical regions across three continents Proc. Natl Acad. Sci. USA108 9899–904
Shevliakova E, Pacala S W, Malyshev S, Hurtt G C, Milly P C D, Caspersen J P, Sentman L T, Fisk J P, Wirth C and
Crevoisier C 2009 Carbon cycling under 300 years of land use change: importance of the secondary vegetation sink Glob. Biogeochemical Cycles23 GB2022
Sitch S et al 2015 Recent trends and drivers of regional sources and sinks of carbon dioxide Biogeosciences12 653–79
Song X-P, Huang C, Saatchi S S, Hansen M C and Townshend J R 2015 Annual carbon emissions from deforestation in the Amazon Basin between 2000 and 2010 PLoS One10 e0126754
Stibig H-J, Achard F, Carboni S, Raši R and Miettinen J 2014 Change in tropical forest cover of Southeast Asia from 1990 to 2010 Biogeosciences.11 247–58
Stocker B, Feissli F and Strassmann K 2014 Past and future carbon fluxes from land use change, shifting cultivation and wood harvest Tellus B66
Tao B, Tian H, Chen G, Ren W, Lu C, Alley K D, Xu X, Liu M, Pan S and Virji H 2013 Terrestrial carbon balance in tropical Asia: contribution from cropland expansion and land management Glob. Planet. Change100 85–98
Tian H, Banger K, Tao B and Dadhwal V K 2014 History of land use in India during 1880–2010: large-scale land transformation reconstructed from satellite data and historical achieves Glob. Planet. Change121 76–88
van der Werf G R, Randerson J T, Giglio L, Collatz G J,
Kasibhatla P S and Arellano A F 2006 Interannual variability of global biomass burning emissions from 1997 to 2004 Atmos. Chem. Phys.6 3423–41
van der Werf G R et al 2008 Climate regulation offire emissions and deforestation in equatorial Asia Proc. Natl Acad. Sci. USA105 20350–5
van der Werf G R et al 2010 Globalfire emissions and the contribution of deforestation, savanna, forest, agricultural, and peatfires (1997–2009) Atmos. Chem. Phys.10 11707–35
Wilkenskjeld S, Kloster S, Pongratz J, Raddatz T and Reick C 2014 Comparing the influence of net and gross anthropogenic land use and land cover changes on the carbon cycle in the MPI-ESM Biogeosciences Discuss.11 5443–69
Yang X, Richardson T K and Jain A K 2010 Contributions of secondary forest and nitrogen dynamics to terrestrial carbon uptake Biogeosciences7 3041–50
12