HAL Id: hal-00298656
https://hal.archives-ouvertes.fr/hal-00298656
Submitted on 10 Jun 2005HAL is a multi-disciplinary open access
archive for the deposit and dissemination of sci-entific research documents, whether they are pub-lished or not. The documents may come from teaching and research institutions in France or abroad, or from public or private research centers.
L’archive ouverte pluridisciplinaire HAL, est destinée au dépôt et à la diffusion de documents scientifiques de niveau recherche, publiés ou non, émanant des établissements d’enseignement et de recherche français ou étrangers, des laboratoires publics ou privés.
Nonlinear estimation of aquifer parameters from
surficial resistivity measurements
K. P. Singh
To cite this version:
K. P. Singh. Nonlinear estimation of aquifer parameters from surficial resistivity measurements. Hydrology and Earth System Sciences Discussions, European Geosciences Union, 2005, 2 (3), pp.917-938. �hal-00298656�
HESSD
2, 917–938, 2005 Nonlinear estimation of aquifer parameters K. P. Singh Title Page Abstract Introduction Conclusions References Tables Figures J I J I Back CloseFull Screen / Esc
Print Version
Interactive Discussion
EGU Hydrol. Earth Sys. Sci. Discuss., 2, 917–938, 2005
www.copernicus.org/EGU/hess/hessd/2/917/ SRef-ID: 1812-2116/hessd/2005-2-917 European Geosciences Union
Hydrology and Earth System Sciences Discussions
Papers published in Hydrology and Earth System Sciences Discussions are under open-access review for the journal Hydrology and Earth System Sciences
Nonlinear estimation of aquifer
parameters from surficial resistivity
measurements
K. P. Singh
National Geophysical Research Institute, Uppal Road, Hyderabad-500007, India Received: 25 February 2005 – Accepted: 19 May 2005 – Published: 10 June 2005 Correspondence to: K. P. Singh (kps [email protected])
HESSD
2, 917–938, 2005 Nonlinear estimation of aquifer parameters K. P. Singh Title Page Abstract Introduction Conclusions References Tables Figures J I J I Back CloseFull Screen / Esc
Print Version
Interactive Discussion
EGU
Abstract
The present study is focused on an examination of the correlation relationships for hydraulic permeability and transmissivity with electrical resistivity in a range of frac-tured and alluvial aquifers. The observed permeability data for fracfrac-tured rock aquifers at some locations is correlated nonlinearly with electrical resistivity of the aquifers esti-5
mated from resistivity sounding data and it is found that the permeability of the aquifer in this region exponentially decreases with increase in resistivity. Permeability of the hard rock aquifer within the weathered zone and alluvium aquifers increases exponen-tially with increase in resistivity, and transmissivity decreases exponenexponen-tially. However, in case of fracture rock and sandwiched aquifers, transmissivity increases exponen-10
tially with increase in resistivity. An attempt has been made to find general functional relationship between hydraulic parameters and resistivity of the aquifer, and therefore, published and observed data from India and other parts of the world has been taken under consideration. It is found that for fracture rock and alluvium aquifers, permeability and the transmissivity are best defined as the exponential functions of aquifer resistiv-15
ity. The application of electrical parameters obtained from resistivity data for evaluation of hydraulic parameters has been demonstrated in detail within the Osmania Univer-sity Campus, Hyderabad (India). The empirical relations between aquifer parameters and resistivity are established for transforming resistivity distribution into permeability and transmissivity of the aquifer. The information thus obtained from resistivity data on 20
permeability of the aquifer and transmissivity distribution in the study area can be used for optimal use and assessment of water resources.
1. Introduction
The hydraulic characteristics of subsurface aquifers are important properties for both groundwater and contaminated land assessments, and also for safe construction of 25
HESSD
2, 917–938, 2005 Nonlinear estimation of aquifer parameters K. P. Singh Title Page Abstract Introduction Conclusions References Tables Figures J I J I Back CloseFull Screen / Esc
Print Version
Interactive Discussion
EGU and Storativity (S) are all commonly applied hydraulic parameters in groundwater flow
modelling (Freeze and Cherry, 1979; Fitts, 2002). Application of field hydrogeological methods of assessment is a standard technique for evaluating these aquifer properties, however estimating K , T , and S values from field pumping tests and downhole well-log data can be very expensive and time-consuming. In this context, surface geophysical 5
methods may provide rapid and effective techniques for groundwater exploration and aquifer evaluation. Application of geophysical methods generally is proving very e ffec-tive for water content estimation, water quality assessment and mapping of the depth to the water table and bedrock (Hubbard and Rubin, 2002). Although various geophys-ical techniques currently are being applied to explore and assess water resources, the 10
DC electrical resistivity method still proves the most powerful and cost-effective. Use of Wenner and Schlumberger array vertical electrical sounding (VES), profiling, and also electrical tomography techniques have become very common in groundwater explo-ration and contamination studies, and there are standard, published direct and indirect interpretation techniques specifically for VES data (cf. Jupp and Vozoff, 1975; Koefoed, 15
1979). Recently, attempts have been made by researchers also to obtain such hy-draulic parameter estimates from resistivity measurements (e.g. Brace, 1977; Biella et al., 1983; Bussian, 1983),
In porous media and alluvial aquifers per se, transmissivities, formation factors and permeability can be estimated using empirical/semi-empirical correlations, often using 20
simple linear relations (Kelly, 1977a, b; Heigold et al., 1979; Schimschal, 1981; Urish, 1981; Chen and Hubbard et al., 2001). In the present study, Schlumberger resistivity soundings have been assessed in both alluvial (porous medium) and fractured hard rock aquifers for possible relationships with hydraulic parameters. Particularly in frac-tured and fissured hard rock regions delineation of aquifer properties by geophysical 25
methods can be a very difficult task. For example, if the conductive aquifer is thin and sandwiched between two electrically resistive layers then no indication of its presence will be observed in a resistivity sounding curve (Singh, 2003a). Moreover, groundwater flow in fractured aquifers is very complicated, and accuracy in estimation of the
hy-HESSD
2, 917–938, 2005 Nonlinear estimation of aquifer parameters K. P. Singh Title Page Abstract Introduction Conclusions References Tables Figures J I J I Back CloseFull Screen / Esc
Print Version
Interactive Discussion
EGU draulic parameters depends on the hydraulic behavior in particular fractures, which is
site specific. In such situations, non-conventional methods may be useful to detect a hidden aquifer (Singh, 2003a).
2. Theoretical foundations
The theory of and mathematical expressions used for exploration of groundwater by 5
geoelectrical methods are well established (e.g. Bhattacharya and Patra, 1968; Koe-foed, 1979; Keller and Frischknecht, 1966). The Schlumberger array method of Verti-cal Electric Sounding (VES) has been applied both for obtaining the electriVerti-cal resistivity structure of the shallow earth and for exploring for groundwater (Fig. 1). The depth of in-vestigation in a Schlumberger sounding configuration typically varies between 0.25 AB 10
to 0.5 AB (Roy and Elliot, 1981).
Mathematically, electrical current flow (J ) in a conducting medium is governed by Ohm’s law and groundwater flow in a porous medium Darcy’s law, both having similar forms of equation: J= −σd V dr (1) 15 q= −Kdh dr , (2)
where J , σ, V , r, q, K , h are respectively the current density (amps per unit area), electrical conductivity (Siemens/m = reciprocal resistivity, ρ ohm.m or Ω.m), electri-cal potential (volts), distance (metres), specific discharge (discharge per unit area), hydraulic conductivity (or permeability; m/s) and hydraulic head (m). The analogy be-20
tween these two macroscopic phenomenona is widely accepted (Freeze and Cherry, 1979; Fitts, 2002). Thus, the electrical method provides a powerful analogue and tool for groundwater exploration and modelling, and may be useful e.g. in generating ana-lytic flow nets.
HESSD
2, 917–938, 2005 Nonlinear estimation of aquifer parameters K. P. Singh Title Page Abstract Introduction Conclusions References Tables Figures J I J I Back CloseFull Screen / Esc
Print Version
Interactive Discussion
EGU For homogeneous and isotropic medium, electric current and groundwater flow both
satisfy the Laplace equation: for electrical flow,
d2V dr2 + 2 r d V dr = 0 (3)
and for groundwater flow,
d2h dr2 + 1 r dh dr = 0 . (4) 5
For a point current source, the solution of Eq. (3) in a semi-infinite, homogeneous medium for (hemispherical earth) electrical flow can be written as
V = ρI
2π 1
r (5)
and for hydraulic flow a similar equation can be written as:
h= Q
2πT ln r . (6)
10
Transmissivity of an aquifer of saturated thickness b then is expressed by
T = K b (7)
such, Eq. (4) becomes:
h= Q
2πK bln r . (8)
In general terms, since larger connected pores make for better flow characteristics for 15
both water and electric currents it is expected that at the very least there should be some relationship between electrical and hydraulic parameters. Although the previ-ous equations relate to flow in homogeneprevi-ous earth media, in the present study nev-ertheless an attempt is made firstly to identify (site-specific) empirical relations in two
HESSD
2, 917–938, 2005 Nonlinear estimation of aquifer parameters K. P. Singh Title Page Abstract Introduction Conclusions References Tables Figures J I J I Back CloseFull Screen / Esc
Print Version
Interactive Discussion
EGU particular aquifer types (alluvial, fissured), and secondly then to identify more
gen-eral aquifer relations. Moreover, hydrogeological properties of the aquifers in fractured aquifers generally vary rapidly. As a result, directly linear relations between resistivity and hydraulic parameters (K and T ) do not readily exist. Therefore, in present study, nonlinear relations between resistivity and transmissivity and permeability have been 5
fit.
2.1. Methodology
A nonlinear empirical correlation analysis of field hydraulic parameters (K and T ) with resistivity (ρ) has been performed for a range of published data from aquifer studies in central Japan and Rhode Island (USA), along with observed data from India. The 10
empirical relation between K and ρ obtained in the present study for Osmania Uni-versity Campus, Hyderabad (India) particularly may be used to compute permeability estimates at other VES locations where K data from pumping tests is not directly avail-able. However, it is potentially a very difficult task to generalise the relationships both to alluvial and fractured aquifers. Transmissivity evaluations based on permeability es-15
timates in the former case may be particularly erroneous if the saturated thickness and electrical resistivity of the aquifer are not interpreted accurately. Thus accuracy in esti-mation of thickness and resistivity of the aquifer must be adequately maintained while interpreting the VES data, rms error<5%. Information on thickness of the aquifer is ex-tracted here using a non-conventional method proposed by Singh (2003a) along with 20
other available information on depth to the water table from existing dug wells in the area. Thickness and resistivity of the aquifer at various observation points are obtained by inversion of VES data. The a priori information available on hydrological parameters and depth of water table from dug wells and bore well is used to constrain and minimize the ambiguity of interpretation. The root mean square (rms) error between observed 25
and computed VES data is maintained less than 5% while computing the resistivity and thickness of the aquifer by employing inversion scheme proposed by Jupp and Vozoff (1975).
HESSD
2, 917–938, 2005 Nonlinear estimation of aquifer parameters K. P. Singh Title Page Abstract Introduction Conclusions References Tables Figures J I J I Back CloseFull Screen / Esc
Print Version
Interactive Discussion
EGU
3. Results and discussions
Interestingly, in all cases permeability and transmissivity prove best correlated with resistivity if a nonlinear, exponential curve is fitted.
3.1. Alluvium aquifers
Published data on alluvial aquifers from U.P., India (Sriniwas and Singhal, 1985), and 5
Beaver River aquifer and Chipuxet aquifer of the Pawcatuck River basin, Rhode Is-land, USA (Kosineski and Kelly, 1981) have been used here to examine the empirical relationship between permeability (K ) and electrical resistivity (ρ) in these aquifers (Table 1). Permeability is calculated from the published pumping test data for the sites shown in Table 1 (Sriniwas and Singhal, 1985). Subsequently, various functions were 10
tried in the present study to fit the pumping test data by the cited authors for the site-specific K and ρ values for the alluvial aquifer studies. For the published data on alluvial aquifers, it is found generally that an exponential fit of K on ρ is reasonable. The levels of confidence (standard deviation= SD for all data fits is found to be >90% (Figs. 2a–2c). The empirical relations obtained in the different aquifers are:
15
U.P. India alluvial aquifer data:
Banda Area: K = 2.0345 e−0.2458ρ (9)
Varanasi Area: K = 0.0538 e0.0072ρ (10)
Saharanpur Area: K = 0.0002 e0.0897ρ (11)
20
USA alluvial aquifer data:
Rhode Island, USA: K = 0.0192 e0.003 (12)
Most of the examples of alluvial aquifers show K increases with ρ, excepting the Banda Area (Fig. 2a). In the Banda area, the presence of granitic hillocks exposed
HESSD
2, 917–938, 2005 Nonlinear estimation of aquifer parameters K. P. Singh Title Page Abstract Introduction Conclusions References Tables Figures J I J I Back CloseFull Screen / Esc
Print Version
Interactive Discussion
EGU at the surface in some locations (Sriniwas and Singhal, 1985) may give rise to a
sig-nificantly different subsurface geological setting in comparison with the other alluvial aquifers looked at. The presence of hard rock lithologies in the area may be the cause the negative correlation of the variation in permeability with resistivity. This type of be-havior typically is found in hard rock aquifers (see below). Nevertheless, it is noted that 5
for all of the alluvial aquifers the permeability-electrical resistivity relationship can be fit generally with an exponential function.
3.2. Hard rock aquifers
In the present analysis, the permeability (K ) and resistivity (ρ) data from published laboratory and borehole measurements at Mount Tsukuba, Central Japan (Sudo et al., 10
2004) are considered, along with observed data recently measured by the author at the Osmania University Campus (OUC), Hyderabad, A.P., India (Table 2). Both regions are located in granitic host media, and have different climatic condtions/geograhic locations but in both case similar relation between permeability and electrical resistivity of the aquifer is found. The Osmania University Campus (OUC) is a granitic hard rock region 15
of Hyderabad, A.P., India (Fig. 4). Granitic soils and rocks of Archaean age cover the area and the topography follows a gentle slope. Twenty-five VES were conducted at accessible locations across the campus (Fig. 4).
In hard rock aquifer of Central Japan, aquifer permeability exponentially decreases with resistivity in the intact rock cases but increases with increasing resistivity in the 20
weathered rock cases (Figs. 3a and 3b). The following two expressions are obtained for weathered (SD=0.982) and intact rock aquifers (SD=0.980) with excellent fit.
For weathered rock aquifers: K = 5E − 08 e0.0045ρ. (13)
In hard rock aquifer of Central Japan, aquifer permeability exponentially decreases with resistivity in the intact rock cases but increases with increasing resistivity in the 25
HESSD
2, 917–938, 2005 Nonlinear estimation of aquifer parameters K. P. Singh Title Page Abstract Introduction Conclusions References Tables Figures J I J I Back CloseFull Screen / Esc
Print Version
Interactive Discussion
EGU for weathered (SD=0.982) and intact rock aquifers (SD=0.980) with excellent fit:
For weathered rock aquifers: K = 5E − 08 e0.0045ρ (14)
and for intact aquifers: K = 1945.6 e−0.0055ρ (15)
The OUC study (India) also shows a decreasing K with increasing ρ values. From in situ measurements, it is observed that the shallow (weathered rock) aquifers in the 5
OUC, India are dry and no pumping test data is available for them. Thus, correlation analysis of ρ and K directly of the shallow aquifers in weathered zone could not be performed as for the central Japan study. However, ρ and K data of an identified aquifer sandwiched between resistive or less permeable layers within depth range 10–30 m do correlate nonlinearly, and K exponentially decreases with increasing ρ (Fig. 3c) and 10
the expression for this dependency is given by:
OUC granitic aquifer: K = 8 × 10⁻⁶e−0.0013ρ (16)
Generally, the aquifer in the OUC is found to be sandwiched between two resistive layers (Singh, 2003b). The transmissivity of the homogeneous aquifer then can be expressed as the product of the saturated thickness of the aquifer and permeability, 15
such that:
T = 8 × 10⁻⁶e−0.0013ρb (17)
Equations (15) and (13) then are used to convert resistivity distribution of the aquifer to transmissivity estimates for the OUC, India.
In more general terms, using a nonlinear, exponential fit there is the possibility of 20
identifying generalised equation for the variation of K with ρ.
K = AeBρ (18)
For intact, unweathered aquifers, A>0, B<0; and B>0 for alluvium or weathered rock aquifers, for which A and B are site dependent constants. This nonlinear correlation
HESSD
2, 917–938, 2005 Nonlinear estimation of aquifer parameters K. P. Singh Title Page Abstract Introduction Conclusions References Tables Figures J I J I Back CloseFull Screen / Esc
Print Version
Interactive Discussion
EGU study also reveals that the permeability decreases exponentially if an aquifer is
sand-wiched between two highly resistive layer, but increases with increase in resistivity of the aquifer, if the aquifer is just underlying or within weathered rock.
An empirical relation is obtained by correlating observed permeability and resistivity of the aquifer that are estimated from VES data. This equation is used to transform 5
resistivity into permeability of the aquifer in OUC. Equation (13) can be rewritten in general form as given below:
T = Ae−Bρ. (19)
Where A (=8×10⁻⁶h) and B are the site dependent constants for a particular aquifer, and can be determined by using available information of permeability and resistivity of 10
the particular area.
The results obtained from the interpretation of VES data reveal that the depth of potential aquifers varies from 10 to 30 m in OUC (Singh, 2003b). The resistivity dis-tribution of aquifers shown in Fig. 5 shows high values (160–360 ohm-m) around TA (Tagore Auditorium) and LIB (library). These high ρ value(s) are observed close to the 15
sandwiched aquifer and where the overlying resistive layer has considerable thickness (>5 m). Such aquifers are found however to be high yielding at the time of drilling and some bore well subsequently have dried after some time after drilling; such aquifers are not adequately recharged due the presence of high resistive (less permeable) layer.
The yield of the bore well can be computed from derived geoelectrical parameters 20
like Dar Zarrouk parameters (Singh, 2003b, 2004). The resistivity data is transformed into transmissivity (T ) using Eq. (17). The transmissivity image of the aquifer within depth range 5–30 m is shown in Fig. 4.
The transmissivity varies from 10−3to 10−2cm2/s. Dried bore wells are found in the low transmissivity (∼10−3cm2/s) parts of OUC near VCL, TA and south-west of LIB. 25
The yield of the existing bore wells at some locations nearby VES (Table 3) can be compared with resistivity data by Singh (2003b). The yielding wells are found in the areas of high transmissivity (9×10⁻³ to 2.1×10⁻²cm2/s) near NCC office (6.95 m3/h)
HESSD
2, 917–938, 2005 Nonlinear estimation of aquifer parameters K. P. Singh Title Page Abstract Introduction Conclusions References Tables Figures J I J I Back CloseFull Screen / Esc
Print Version
Interactive Discussion
EGU and Landscape garden (7.27 m3/h). Thus, the site observations support the computed
estimation of transmissivity distribution of the aquifer from the OUC data.
4. Conclusions
The present study reveals that the permeabilities of hard rock and alluvium aquifers vary exponentially with resistivity. From the field examples of India and other parts of 5
the world discussed in present study, it is concluded that the permeability increases in weathered hard rock and alluvium aquifers and decreases as the aquifer resistivity increases within intact rock aquifers. In present area, the resistivity distribution of the aquifer is converted into transmissivity using Eq. (17). In present study the uncertainity is minimized using nonconventional method of interpretation of VES data. This ap-10
proach can be applied in other parts of the hard rock and alluvium aquifers of India and other parts of the world. This transformation can be used to convert electrical resistiv-ity imaging/tomography data into permeabilresistiv-ity/transmissivresistiv-ity. This will provide valuable information for flow modeling and recharge of groundwater, and in finding suitable sites for construction of safe civil engineering structures in the study area where less per-15
meability or transmissivity zone are of the interest. However, before generalizing this approach as described in Eqs. (17) and (18), geophysical and hydrogeological study should be carried out at large scale. The study of permeability and transmissivity of near surface unsaturated weathered rock would be very helpful for finding suitable sites for studies of recharge, contamination and dewatering of aquifers.
20
Acknowledgements. The author is thankful to Director, National Geophysical Research
Insti-tute for his permission to publish this work. I am very thankful to T. Elliot, Queen’s University, Northern Ireland for improving English of the paper and for his constructive technical sugges-tions. I am also grateful to anonymous reviewers and editor in chief for their careful reading and constructive comments that helped in improving presentation of the paper.
HESSD
2, 917–938, 2005 Nonlinear estimation of aquifer parameters K. P. Singh Title Page Abstract Introduction Conclusions References Tables Figures J I J I Back CloseFull Screen / Esc
Print Version
Interactive Discussion
EGU
References
Bhattacharya, P. K. and Patra, H. P.: Direct current geoelectric sounding, Elsevier Science Publications, 4–7, 1968.
Biella, G., Lojez, A., and Tabacco, I.: Experimental study of some of hydrogeophysical proper-ties of unconsolidated media, Ground Water, 21, 741–751, 1983.
5
Brace, W. F.: Permeability from resistivity and pore shape, J. Geophys. Res., 82, 23, 334–339, 1977.
Bussian, A. E.: Electrical conductance in porous medium, Geophysics, 48, 1258–1268, 1983. Fitts, C. R.: Groundwater Science, Elsevier Science Publications, The Netherlands, 167–175,
2002. 10
Freeze, R. A. and Cherry, J. A.: Groundwater. Prentice- Hall, Inc., Englewood Cliffs, N.J, 1979. Chen, J., Hubbard, S., and Rubin Y.: Estimating Hydraulic Conductivity at the South Oyster Site from Geophysical Tomographic Data using Bayesian Techniques based on the Normal Linear Regression Model, Wat. Resour. Res., 37, 6, 1603–1613, 2001.
Jupp, D. L. V. and Vozoff, K.: Stable iteration method for inversion of geophysical data, Geophys. 15
J. Roy. Astr. Soc. 42, 957–976, 1975.
Heigold, P. C., Gilkeson, R. H., Cartwright, K., and Reid, P. C.: Aquifer transmissivity from surficial electrical methods, Ground Water, 17, 330–345, 1979.
Hubbard, S. and Rubin, Y.: Hydrogeophysics: State-of-the-Discipline, EOS v. 83, 51, 602, 606, 2002.
20
Jupp, D. L. V. and Vozo, K.: Stable iteration method for inversion of geophysical data, Geophys. J. Roy. Astr. Soc., 42, 957–976, 1975.
Keller, G. V. and Frischknecht, F. C.: Electrical methods in geoelectric prospecting, Pergamon Press, 90–04, 1966.
Kelly, W. E.: Electrical resistivity for estimating permeability, J. Geotech. Eng. Div, 103, 1165– 25
1168, 1977a.
Kelly, W. E.: Geoelectrical sounding for estimating aquifer hydraulic conductivity, Ground Water, 50, 6, 420–425, 1979b.
Koefoed, O.: Geosounding Principle-1, Elsevier Science Publications Amsterdam, The Nether-lands, 170–181, 1979.
30
Roy, K. K. and Elliot, H. M.: Some observations regarding depth of exploration in DC electrical methods, Geoexploration, 19, 1–13, 1981.
HESSD
2, 917–938, 2005 Nonlinear estimation of aquifer parameters K. P. Singh Title Page Abstract Introduction Conclusions References Tables Figures J I J I Back CloseFull Screen / Esc
Print Version
Interactive Discussion
EGU Singh, K. P.: A New Approach for Detection of Hidden Aquifer Using DC Resistivity Data
Trans-forms, J. Geolog. Soc. India, 61, 540–548, 2003a.
Singh, K. P.: Geo-electrical exploration for groundwater in a Hard Rock Region of Hyderabad, India, First Break, 21, 29–34, 2003b.
Singh, K. P.: A First Attempt for determination of relationships between geophysical param-5
eters and yield of the aquifers. Presented in 91st conference of ISC, 3–7 January Punjab University, Chandigarh, India, 2004.
Sri Niwas, Singhal, D. C.: Aquifer transmissivity of porous media from resistivity data, J. Hydrol., 82, 143–153, 1985.
Sudo, H., Tanaka, T., Kobyasi, T., Konado, T., Miyamoto, M., and Amagai, M.: Permeability 10
imaging in granitic host rocks based on surface resistivity profiling, Explor. Geophys., 57, 1, 56–61, 2004.
Urish, D. W.: Electrical resistivity: Hydraulic conductivity relationships in glacial out wash aquifers, Wat. Resour. Res., 17, 1401–1408, 1981.
Zhdanov, S. M. and Keller, G.V.: The geoelectric methods in geophysical exploration, Elsevier 15
HESSD
2, 917–938, 2005 Nonlinear estimation of aquifer parameters K. P. Singh Title Page Abstract Introduction Conclusions References Tables Figures J I J I Back CloseFull Screen / Esc
Print Version
Interactive Discussion
EGU Table 1. The resistivity and pumping test data of alluvium aquifers U.P. (after Sriniwas and
Singhal, 1985) and Rhode Island, USA (after Kosinsky and Kelly, 1981). Area Alluvium Aquifers
1. Banda Area, U.P., India
S.N. ρ (Ohm-m) K (cm/s) 1. 19.9906 0.01346 2. 15.2497 0.04612 3. 18.7243 0.02112 4. 18.7243 0.02269
2. Varanasi Area, U.P., India
1. 42.7221 0.06424
2. 62.0974 0.08704
3. 183.095 0.18738
4. 96.5639 0.1265
3. Saharanpur Area, U.P., India
1. 51.6808 0.02431
2. 60.5518 0.05903
3. 60.6832 0.05787
4. 44.3255 0.01215
5. 66.3742 0.08183
4. Rhode Island, USA
1. 403.86 0.04932
2. 176.784 0.02511
3. 304.8 0.06143
4. 114.3 0.03297
HESSD
2, 917–938, 2005 Nonlinear estimation of aquifer parameters K. P. Singh Title Page Abstract Introduction Conclusions References Tables Figures J I J I Back CloseFull Screen / Esc
Print Version
Interactive Discussion
EGU Table 2. The resistivity and pumping test data of hard rock aquifers of Central Japan from
weathered rock and intact rock aquifers (after Sudo et al., 2004), and Osmania University Campus, Hyderabad (India).
Area Hard rock Aquifers
1. Mt. Tsukuba, Central Japan
S.N. ρ (Ohm-m) K (cm/s)
(a) Weathered rock aquifers
1. 2561 0.00468
2. 1511 3.4E-05
3. 1275 3.9E-05
4. 1061 3.2E-06
5. 2300 0.00135
(b) Intact rock aquifers
1. 2561 0.00468
2. 2110 0.0115
3. 4575 1E-08
4. 4000 1E-07
5. 2850 0.00057
2. OUC, Hyderabad, A.P. (India)
1. 92 0.02431 2. 252 0.05903 3. 496 0.05787 4. 1061 0.01215 5. 3500 0.08183 6. 5100 1E-08
HESSD
2, 917–938, 2005 Nonlinear estimation of aquifer parameters K. P. Singh Title Page Abstract Introduction Conclusions References Tables Figures J I J I Back CloseFull Screen / Esc
Print Version
Interactive Discussion
EGU Table 3. Yield of the existing bore wells near some VES sites in OUC, Hyderabad (India).
S.N. VES No. Yield (m3/h)
1. S1 6.13724
2. S5 6.81915
3. S7 6.9328
4. S11 7.27376
HESSD
2, 917–938, 2005 Nonlinear estimation of aquifer parameters K. P. Singh Title Page Abstract Introduction Conclusions References Tables Figures J I J I Back CloseFull Screen / Esc
Print Version Interactive Discussion EGU A B
_ M N + + O _
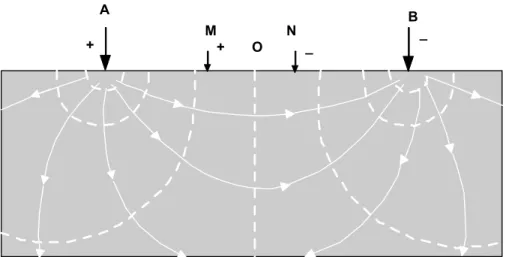
Figure 1.Schematic diagram of Schlumberger resistivity sounding electrode configuration and principle of current flow in subsurface. The dotted lines (…) represent the equipotent surfaces and solid lines () direct currents. A and B are the current electrodes, and M and N are the potential electrodes
Mathematically, electrical current flow (J) in a conducting medium is governed by Ohm’s law and groundwater flow in a porous medium Darcy’s law, both having similar forms of equation: dr dV J=−σ (1) dr dh K q=− (2) where J, σ, V, r, q, K, h are respectively the current density (amps per unit area), electrical conductivity (Siemens/m = reciprocal resistivity, ρ ohm.m or Ω.m), electrical potential (volts), distance (metres), specific discharge (discharge per unit area), hydraulic conductivity (or permeability; m/s) and hydraulic head (m) . The analogy between these two macroscopic phenomenona is widely accepted (Freeze and Cherry 1979; Fitts, 2002). Thus, the electrical method provides a powerful analogue and tool for groundwater exploration and modelling, and may be useful e.g. in generating analytic flow nets.
5 Fig. 1. Schematic diagram of Schlumberger resistivity sounding electrode configuration and principle of current flow in subsurface. The dotted lines (. . . ) represent the equipotent surfaces and solid lines (—) direct currents. A and B are the current electrodes, and M and N are the potential electrodes.
HESSD
2, 917–938, 2005 Nonlinear estimation of aquifer parameters K. P. Singh Title Page Abstract Introduction Conclusions References Tables Figures J I J I Back CloseFull Screen / Esc
Print Version
Interactive Discussion
EGU
Figure 2. Nonlinear correlation analysis of alluvium aquifers.
Permeability (K) (a)decreases with increasing electrical resistivity in Banda Area of U.P., India but increases with increase in resistivity in (b) Varanasi area, U.P. (India), (c) Saharanpur area, U.P., India and (d) Rhode Island, USA.
Most of the examples of alluvial aquifers show K increases withρ, excepting the Banda Area (Figure. 2a). In the Banda area, the presence of granitic hillocks exposed at the surface in some locations (Sriniwas and Singhal, 1985) may give rise to a significantly different subsurface geological setting in comparison with the other alluvial aquifers looked at. The presence of hard rock lithologies in the area may be the cause the negative correlation of the variation in permeability with resistivity. This type of behavior typically is found in hard rock aquifers (see below). Nevertheless, it is noted that for all of the alluvial aquifers the permeability-electrical resistivity relationship can be fit generally with an exponential function.
9 Fig. 2. Nonlinear correlation analysis of alluvium aquifers. Permeability (K ) (a) decreases with increasing electrical resistivity in Banda Area of U.P., India but increases with increase in resistivity in(b) Varanasi area, U.P. (India), (c) Saharanpur area, U.P., India and (d) Rhode Island, USA.
HESSD
2, 917–938, 2005 Nonlinear estimation of aquifer parameters K. P. Singh Title Page Abstract Introduction Conclusions References Tables Figures J I J I Back CloseFull Screen / Esc
Print Version
Interactive Discussion
EGU
Figure 3.Correlation analysis of hard rock aquifers.
Aquifer permeability (a) increases for weathered rock, but decreases in unweathered, intact aquifers with increasing resistivity both for (b) Central Japan, and (c) OUC, Hyderabad, A. P. (India) data.
11 Fig. 3. Correlation analysis of hard rock aquifers. Aquifer permeability (a) increases for weath-ered rock, but decreases in unweathweath-ered, intact aquifers with increasing resistivity both for(b) Central Japan, and(c) OUC, Hyderabad, A. P. (India) data.
HESSD
2, 917–938, 2005 Nonlinear estimation of aquifer parameters K. P. Singh Title Page Abstract Introduction Conclusions References Tables Figures J I J I Back CloseFull Screen / Esc
Print Version
Interactive Discussion
EGU Figure 4. Location map of OUC, Hyderabad showing VES and important places.
The OUC study (India) also shows a decreasing K with increasing ρ values. From in situ measurements, it is observed that the shallow (weathered rock) aquifers in the OUC, India are dry and no pumping test data is available for them. Thus, correlation analysis of ρ and K directly of the shallow weathered zone could not be performed as for the central Japan study. However, ρ and K data of an identified aquifer sandwiched between resistive or less permeable layers within depth range 10-30 m do correlate nonlinearly, and K exponentially decreases with increasing ρ (Figure. 3c) and the expression for this dependency is given by:
12 Fig. 4. Location map of OUC, Hyderabad showing VES and important places.
HESSD
2, 917–938, 2005 Nonlinear estimation of aquifer parameters K. P. Singh Title Page Abstract Introduction Conclusions References Tables Figures J I J I Back CloseFull Screen / Esc
Print Version Interactive Discussion EGU 800 1200 1600 2000 2400 2800 Distance (m) 1200 1600 2000 2400 2800 3200 D ist an ce ( m ) VCL LG TA LIB UHC NCCO 20 40 60 80 100 120 140 160 180 200 220 240 260 280 300 320 340 360 Resistivity (ohm-m)
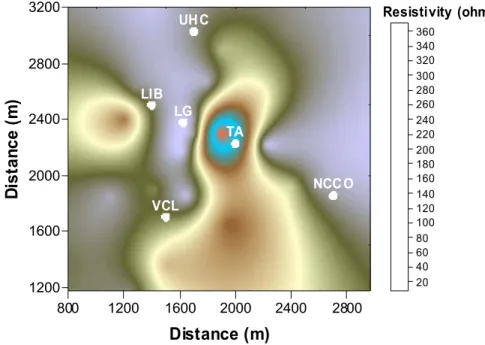
Figure 5. Resistivity map of the aquifer obtained from interpretation of VES data
The results obtained from the interpretation of VES data reveal that the depth of potential aquifers varies from 10 to 30 m in OUC (Singh, 2003b). The resistivity distribution of aquifers shown in Figure.5 shows high values (160-360 ohm-m) around TA (Tagore Auditorium) and LIB (library). These high ρ value(s) are observed close to the sandwiched aquifer and where the overlying resistive layer has considerable thickness (> 5 m). Such aquifers are found however to be high yielding at the time of drilling and some bore well subsequently have dried after some time after drilling; such aquifers are not adequately recharged due the presence of high resistive (less permeable) layer.
The yield of the bore well can be computed from derived geoelectrical parameters like Dar Zarrouk parameters (Singh, 2003b; 2004). The resistivity data is transformed into transmissivity (T) using equation (16). The transmissivity image of the aquifer within depth range 5-30 m is shown in figure 4.
14 Fig. 5. Resistivity map of the aquifer obtained from interpretation of VES data.
HESSD
2, 917–938, 2005 Nonlinear estimation of aquifer parameters K. P. Singh Title Page Abstract Introduction Conclusions References Tables Figures J I J I Back CloseFull Screen / Esc
Print Version Interactive Discussion EGU 1.00E-003 3.00E-003 5.00E-003 7.00E-003 9.00E-003 1.10E-002 1.30E-002 1.50E-002 1.70E-002 1.90E-002 2.10E-002
T (cm /sec)
2 800 1200 1600 2000 2400 2800 Distance (m) 1200 1600 2000 2400 2800 3200 Di st a nce (m ) VCL LG TA LIB UHC NCCOFigure 6. Transmissivity distribution map of the aquifer in OUC, Hyderabad (India)
The transmissivity varies from 10-3 to 10-2 cm2/sec. Dried bore wells are found in the low transmissivity (~10-3cm2/sec) parts of OUC near VCL, TA and south-west of LIB. The yield of the existing bore wells at some locations nearby VES (Table 3) can be compared with resistivity data by Singh (2003b). The yielding wells are found in the areas of high transmissivity (9×10⁻³ to 2.1×10⁻² cm2/sec) near NCC office (6.95 m3/hr) and Landscape garden (7.27 m3/hr). Thus, the site observations support the computed estimation of transmissivity distribution of the aquifer from the OUC data.
4. Conclusions
The present study reveals that the permeabilities of hard rock and alluvium aquifers vary exponentially with resistivity. From the field examples of India and other parts of the world discussed in present study, it is concluded that the permeability increases in weathered hard rock and alluvium aquifers and decreases as the aquifer resistivity increases within intact rock aquifers. In present area, the resistivity distribution of the aquifer is converted into transmissivity using equation (16). In present study the uncertainity is minimized using
15
Fig. 6. Transmissivity distribution map of the aquifer in OUC, Hyderabad.