HAL Id: insu-03033048
https://hal-insu.archives-ouvertes.fr/insu-03033048
Submitted on 1 Dec 2020
HAL is a multi-disciplinary open access
archive for the deposit and dissemination of sci-entific research documents, whether they are pub-lished or not. The documents may come from teaching and research institutions in France or abroad, or from public or private research centers.
L’archive ouverte pluridisciplinaire HAL, est destinée au dépôt et à la diffusion de documents scientifiques de niveau recherche, publiés ou non, émanant des établissements d’enseignement et de recherche français ou étrangers, des laboratoires publics ou privés.
Rhyolitic volcano dynamics in the Southern Andes:
Contributions from 17 years of InSAR observations at
Cordón Caulle volcano from 2003 to 2020
Francisco Delgado
To cite this version:
Francisco Delgado. Rhyolitic volcano dynamics in the Southern Andes: Contributions from 17 years of InSAR observations at Cordón Caulle volcano from 2003 to 2020. Journal of South American Earth Sciences, Elsevier, 2020, In press, pp.102841. �10.1016/j.jsames.2020.102841�. �insu-03033048�
Journal Pre-proof
Rhyolitic volcano dynamics in the Southern Andes: Contributions from 17 years of InSAR observations at Cordón Caulle from 2003 to 2020
Francisco Delgado
PII: S0895-9811(20)30384-9
DOI: https://doi.org/10.1016/j.jsames.2020.102841
Reference: SAMES 102841
To appear in: Journal of South American Earth Sciences
Received Date: 24 March 2020 Revised Date: 10 August 2020 Accepted Date: 21 August 2020
Please cite this article as: Delgado, F., Rhyolitic volcano dynamics in the Southern Andes: Contributions from 17 years of InSAR observations at Cordón Caulle from 2003 to 2020, Journal of South American
Earth Sciences (2020), doi: https://doi.org/10.1016/j.jsames.2020.102841.
This is a PDF file of an article that has undergone enhancements after acceptance, such as the addition of a cover page and metadata, and formatting for readability, but it is not yet the definitive version of record. This version will undergo additional copyediting, typesetting and review before it is published in its final form, but we are providing this version to give early visibility of the article. Please note that, during the production process, errors may be discovered which could affect the content, and all legal disclaimers that apply to the journal pertain.
Rhyolitic volcano dynamics in the Southern Andes: contributions
1
from 17 years of InSAR observations at Cord´
on Caulle from 2003
2
to 2020
3
Francisco Delgado1
4
1Universit´e de Paris, Institut de Physique du Globe de Paris, CNRS, F-75005 Paris, France
5
1delgado@ipgp.fr
6
Abstract
7
In this article I present a review of InSAR observations of ground deformation
8
at Cord´on Caulle volcano, whose 2011-2012 VEI 4-5 eruption is the best scientifically
9
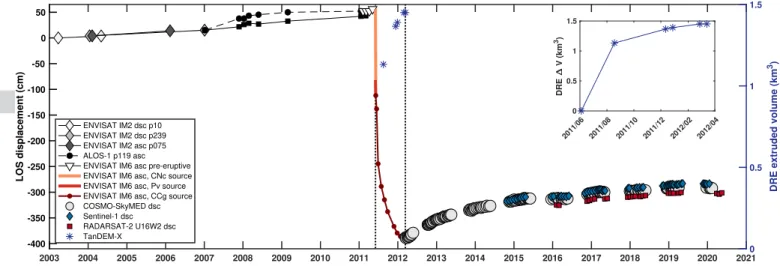
observed and instrumentally recorded rhyolitic eruption to date. I document a complete
10
cycle of pre-eruptive uplift, co-eruptive subsidence and post-eruptive uplift with InSAR
11
data between March 2003 and May 2020 and produced by a complex interplay of
12
magmatic processes. Pre-eruptive data show ∼0.5 m of ground uplift in three distinct
13
episodes between 2003 and 2011, with uplift rates between ∼3 and ∼30 cm/yr. The
14
uplift was likely caused by magma injection resulting in pressurization of the magmatic
15
system at depths of 4-9 km. Data spanning the first 3 days of the eruption show ∼1.5
16
m of deflation produced by two distinct sources at 4-6 km depth located 18 km from
17
each other and up to 10 km from the eruptive vent — suggesting hydraulic connectivity
18
of a large magma mush zone. A third source of deformation was recorded during the
19
rest of the eruption at a depth of ∼ 5 km, resulting in a total subsidence of ∼2.5 m.
20
On a much smaller spatial scale (∼25 km2), InSAR-derived digital elevation models
21
recorded ∼250 m of uplift in the area of the eruptive vent interpreted as the intrusion
22
of a shallow laccolith during the first 2.5 months of the eruption and time averaged
23
lava discharge rates up to ∼150 m3/s.The co-eruptive time series of reservoir pressure
24
drop and extruded volume follow exponential trends that can be explained by a model
25
of magma reservoir depressurizationand conduit flow. Since the end of the eruption,
26
the surface of the volcano was uplifted ∼1 m in a sequence of three transient episodes
27
of unrest during 2012 and 2019, with uplift rates between 6 and 45 cm/yr and lasting
28
between 0.5 and 3.2 years. These pulses can be modeled by the same source, a
sub-29
horizontal sill at a depth of ∼6 km. Viscoelastic relaxation is not significant on these
30
time scales, hence I interpret these uplift signals as being produced by episodic pulses of
31
magma injection in the crystal mush that likely underlies the volcano. The episodic and
32
abrupt changes of the ground deformation suggests a restless trans-lateral magmatic
33
system at depths of 4-9 km and active across multiple spatial and temporal scales.
34
Finally, I also discuss challenges of the InSAR technology that should be addressed to
35
detect ground deformation on short time scales, particularly under the low coherence
36
conditions of Cord´on Caulle.
1
Introduction
38
Volcanic eruptions are one of the most spectacular geological processes observed on Earth.
39
These events are produced by the ascent and extrusion of magma, molten rock composed of
40
melt, crystals, and gases. The occurrence, duration, and style (either explosive or effusive)
41
of the resulting eruption depend on a complex interplay of factors. These include the magma
42
volume, ascent rate, composition, volatile content, and physicochemical transformations that
43
the magma undergoes as it ascends and depressurizes, traveling from its storage area in a
44
shallow reservoir through either a narrow conduit or a sill to the surface (Wilson et al.,
45
1980; Tait et al.,1989; Jaupart and Tait, 1990;Jaupart,2000; Edmonds and Wallace,2017;
46
Tait and Taisne, 2012; Dufek et al., 2012; Gonnermann and Manga, 2012; Gonnermann,
47
2015). The complexity of volcanic processes has been recently highlighted by a review
48
article which stated that the first grand challenge in volcano science is to ”forecast the onset,
49
size, duration, and hazard of eruptions by integrating observations with quantitative models
50
of magma dynamics” (National Academies of Sciences and Medicine, 2017). Fortunately,
51
eruptions and/or the emplacement of magma in the upper crust are typically preceded by
52
several signs of unrest including changes in ground deformation (e.g., Pinel et al., 2014),
53
temperature (Reath et al.,2019), seismicity (e.g., Chouet and Matoza, 2013), and degassing
54
(e.g.,Carn et al.,2016) that can provide insights into their dynamics, and potentially forecast
55
them (Sparks et al., 2012). However, there are still basic volcanological questions that
56
remain unanswered. These include: 1. How is magma stored and transported in the crust?
57
2. What triggers eruptions? 3. What controls the duration and magnitude of eruptions?
58
4. What unrest signals are evidence of an imminent eruption? (National Academies of
59
Sciences and Medicine,2017;Wilson,2017). Even in the best monitored volcanoes on Earth,
60
eruption forecasting can be very challenging (Thelen et al., 2017; Peltier et al., 2018). Our
61
understanding of the dynamics of these systems is still incomplete because we are inherently
62
limited by the low resolving power of observations made from the Earth’s surface (Bachmann
63
and Huber, 2016) rather than in the actual reservoirs where magma is stored (Lowenstern 64
et al., 2017).
65
Ground deformation data is a useful tool for volcano monitoring because the ascent of magma
66
and the resulting eruption are usually coeval with displacement on the Earth’s surface (Sparks
67
et al., 2012). Thereby deformation allows us to potentially forecast and better understand
68
volcanic processes. Volcano geodesy has traditionally relied on ground measurements
includ-69
ing including tiltmeters and continuous GPS but it has been revolutionized by Interferometric
70
Synthetic Aperture Radar (InSAR), providing new insights on a variety of volcanic processes
71
like eruption dynamics (Dzurisin and Lu, 2007; Pinel et al., 2014; Lu and Dzurisin, 2014;
72
Dumont et al.,2018;Dzurisin et al.,2019). The key advantage of InSAR is that it is the only
73
geodetic method that can measure ground deformation over large areas (> 40x40 km2) with
74
repeat periods of a few days and with small uncertainties (∼5 cm per interferogram).
pilations of satellite observations show a wide diversity of InSAR-derived deformation signals
76
on volcanoes in Latin America (Reath et al., 2019) and elsewhere (e.g., Lu and Dzurisin,
77
2014), but the relation between deformation and eruption is not always clear (Biggs et al.,
78
2014; Biggs and Pritchard, 2017; Delgado et al.,2017;Reath et al., 2019).
79
In this review article I present a summary of 17 years of InSAR observations at Cord´on
80
Caulle volcano (Figure 1) in the Southern Volcanic Zone (SVZ) of the Chilean and
Argen-81
tinian Andes (Stern, 2004) and the magmatic processes that can be unravelled with InSAR
82
observations. Although InSAR data have contributed to key observations of volcanic
pro-83
cesses in the SVZ, particularly during the VEI4-5 2008-2009 Chait´en (Wicks et al., 2011)
84
and 2015 Calbuco (Nikkhoo et al., 2016; Delgado et al., 2017) eruptions and a sequence of
85
unrest at Laguna del Maule volcano (Feigl et al., 2014; Le M´evel et al., 2015; Novoa et al.,
86
2019), in no other volcano in the SVZ than at Cord´on Caulle it has shed light about a wide
87
variety of volcanic processes (Pritchard and Simons, 2004; Fournier et al., 2010; Jay et al.,
88
2014;Bignami et al.,2014;Delgado et al.,2016,2018,2019;Castro et al.,2016;Wendt et al.,
89
2017; Euillades et al., 2017). These include a sequence of transient pre-eruptive pulses of
90
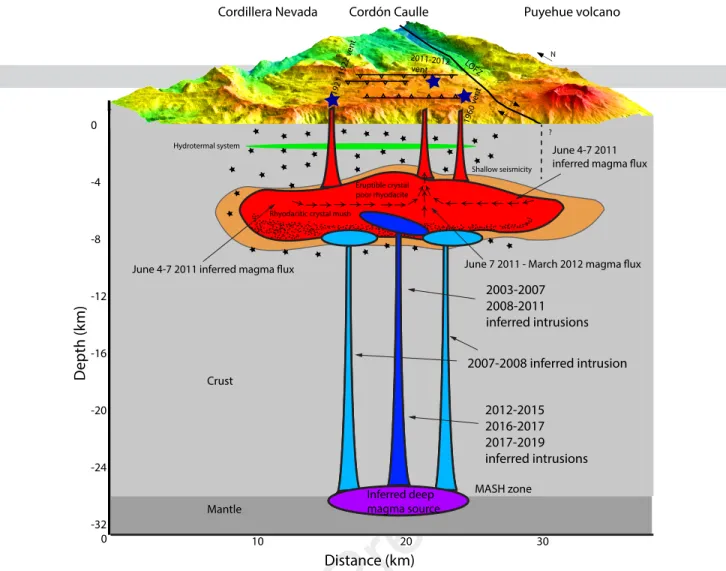
magma injection, co-eruptive subsidence, lava flow extrusion and shallow laccolith intrusion,
91
lava flow subsidence, and episodic post-eruptive magma injection that can lead to a potential
92
new eruption (Figure 2). At the time of writing (July 2020), no other subduction volcano
93
in America except for Okmok in the Aleutians (Lu and Dzurisin, 2014) displays the wide
94
variety of signals due to magmatic and superficial processes that can be observed with
In-95
SAR. The discovery of ground deformation at Cord´on Caulle has been directly related to
96
improvements in the SAR civilian platforms. Therefore, in this review I rely on
multiplat-97
form InSAR data and relate them to other geological observations (Castro et al.,2013,2016;
98
Bonadonna et al., 2015) only when they are relevant for the scope of this study.
99
I start this review with a summary of InSAR and volcano geodesy studies in the Southern
100
Andes, highlighting the value of the method with respect to other geodetic techniques,
101
particularly for the scope of this special issue on New advances on SAR Interferometry
102
in South America. I then describe a complete cycle of pre-eruptive uplift, co-eruptive
103
subsidence and post-eruptive uplift at Cord´on Caulle imaged with InSAR. Then, I describe
104
volcanological aspects where InSAR has made a leap forward in our understanding of rhyolitic
105
dynamics. I finalize with a discussion on the challenges and opportunities for a better use of
106
InSAR in the Southern Andes, including a qualitative comparison of different SAR data sets
107
for the environmental conditions of Cord´on Caulle. The time period of this study starts in
108
March 2003 and ends in January 2020. It spans since the beginning of the operation phase
109
of ENVISAT which was the first platform to systematically acquire data in the area to the
110
current COSMO-SkyMED, TerraSAR-X, Sentinel-1, ALOS-2 and RADARSAT-2 acquiring
111
several hundreds of SAR images per year. Therefore, significant changes in the InSAR
112
technology have resulted in a much faster discovery and better understanding of magmatic
113
processes than before.
2
Volcano Geodesy in the Southern Andes
115
The Southern Volcanic Zone (SVZ) (Figure 1) is one of the most active volcanic segments
116
in the Andean volcanic arc of South America (Stern, 2004) with a time-averaged eruption
117
rate of ∼0.5 events/year during the 20th century (Dzierma and Wehrmann,2012). The rate
118
increased to ∼1.3 events/year between 2008 and 2016 (Llaima January 01 2008, Chait´en
119
May 02 2008-2009, Llaima April 03 2009, Cord´on Caulle 04 June 201, Peteroa 2010-2011,
120
Hudson October 26 2011, Copahue December 2012, Villarrica 03 March 2015, Calbuco April
121
22 2015, Nevados de Chillan January 2016 - ongoing). These volcanoes have a wide range of
122
eruptive styles that vary from small basaltic Strombolian (VEI 1-2) to large rhyolitic Plinian
123
(VEI 5) eruptions. The SVZ includes Villarrica and Llaima, two of the most active edifices
124
in South America with each having more than 50 historical eruptions since the mid XVI
125
century. Of the 9 SVZ volcanoes that erupted during 2008-2017, Chait´en, Cord´on Caulle,
126
Villarrica and Calbuco are scientifically important regardless of their magma composition.
127
The VEI 4-5 2008-2009 Chait´een and 2011-2012 Cord´on Caulle eruptions were the first and
128
second rhyolitic eruptions with scientific instrumental observations in real time (Major and
129
Lara 2013;Jay et al. 2014), the latter the first time that the extrusion of a rhyolitic lava flow
130
has been observed in detail (Tuffen et al., 2013). Villarrica is a basaltic/andesitic volcano
131
that hosts one of the seven semi-permanent lava lakes on earth (Lev et al., 2019). Finally,
132
the VEI 4 2015 Calbuco eruption is a rare case of a sub-Plinian andesitic eruption with little
133
to none geodetic and seismic precursory activity (Delgado et al., 2017). The SVZ is thus an
134
excellent place to constrain the mechanisms responsible for magma storage and transport,
135
as well as to investigate how eruptions are triggered and evolve.
136
InSAR data have been recorded in the SVZ since 1993 (Pritchard and Simons, 2004), but
137
systematic observations with good interferometric coherence have only been available since
138
January 2007 by ALOS-1 data (Fournier et al., 2010). InSAR provided the first geodetic
139
observations in the SVZ volcanoes because to my knowledge classical ground geodesy such as
140
tiltmeters and leveling were never attempted in this region. Several InSAR studies have been
141
carried out in the SVZ including regional surveys (Pritchard and Simons, 2004; Fournier
142
et al., 2010; Pritchard et al., 2013; Delgado et al., 2017; Reath et al., 2019) and detailed
143
studies focused on individual volcanoes. These include from N to S Peteroa (Romero et al.,
144
2020), Laguna del Maule (Feigl et al., 2014; Le M´evel et al., 2015, 2016; Novoa et al., 2019;
145
Zhan et al.,2019), Domuyo (Astort et al., 2019;Lundgren et al., 2020), Nevados de Chill´an
146
(Pritchard et al., 2013; Reath et al., 2019; Delgado, 2018), Copahue (Velez et al., 2011,
147
2015; Lundgren et al., 2017; Reath et al., 2019), Lonquimay (Fournier et al., 2010), Llaima
148
(Fournier et al.,2010;Bathke et al.,2011;Remy et al.,2015;Delgado et al.,2017), Villarrica
149
(Delgado et al., 2017; Reath et al., 2019), Cord´on Caulle (Jay et al., 2014; Bignami et al.,
150
2014; Delgado et al., 2016, 2018, 2019; Wendt et al., 2017; Euillades et al., 2017), Calbuco
151
(Nikkhoo et al.,2016;Delgado et al.,2017), Chait´en (Fournier et al.,2010;Wicks et al.,2011;
Reath et al., 2019) and Hudson (Pritchard and Simons, 2004; Delgado et al., 2014; Reath 153
et al., 2019). These studies show that the SVZ volcanoes have in general shallow magma
154
reservoirs (z < 10 km), with injection rates of ∼0.01-0.03 km3/yr. Some of these reservoirs
155
are significantly offset from the center of the volcano (Delgado et al., 2017). In some cases
156
deformation preceded eruptions, while in some it did not (Reath et al.,2019). The 2008-2009
157
Chait´en, 2011-2012 Cord´on Caulle and 2015 Calbuco VEI 4-5 eruptions all were coeval with
158
ground subsidence due to magma extraction from shallow reservoirs.
159
The large number of eruptions and the discovery of deforming volcanoes with InSAR in
160
the past 12 years led to the deployment of continuous GPS and tilt meters for
continu-161
ous monitoring in several volcanoes of the SVZ by OVDAS (Observatorio Volcanol´ogico de
162
los Andes del Sur), part of the Chilean Volcano Monitoring Network operated by
SERNA-163
GEOMIN (Servicio Nacional de Geolog´ıa y Miner´ıa). The first permanent continuous GPS
164
stations in the SVZ were deployed in October 2011 - February 2012 and in December 2017
165
for Cord´on Caulle. Nevertheless, the late deployment of these instruments with respect to
166
the eruptions and episodes of unrest implies that only in a few cases they have contributed
167
to a better understanding of volcano dynamics in the SVZ with respect to InSAR (e.g., Le
168
M´evel et al.,2015). Further, no permanent GPS stations existed at the time of the Chait´en,
169
Cord´on Caulle and Calbuco eruptions. Stations were deployed after the onset of the Chait´en
170
(Pina-Gauthier et al., 2013) and Cord´on Caulle eruptions (Wendt et al.,2017), and a single
171
tiltmeter recorded the 2015 Calbuco eruption (Delgado et al.,2017). However, the few data
172
and the large distance with respect to the volcanoes required to interpret the data jointly
173
with the InSAR observations. Finally, microgravity has only been recorded at Laguna del
174
Maule volcano (Miller et al.,2017), with an ongoing continuous microgravity deployment at
175
the summit of Villarrica volcano (H´el´ene Le M´evel, personal communication).
176
3
Cord´
on Caulle Geological Background
177
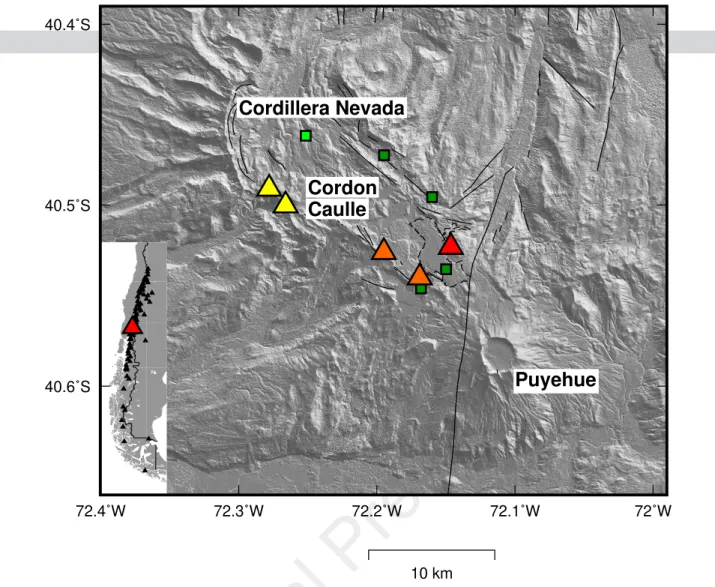
Cord´on Caulle is a long-lived system made up of a graben bounded by two sets of NW-SE
178
trending fissures and the central volcano of a NW-SE volcanic range made up by Cordillera
179
Nevada caldera to the NW and Puyehue volcano to the SE (Figure 1, Lara et al., 2004,
180
2006a,b). These three volcanoes have chemically distinct evolutions, with Cord´on Caulle
181
erupting only rhyolitic and rhyodacitic lavas in the Holocene (Singer et al.,2008). The lava
182
flows erupted in 1921-1922 and 1960 were sourced from vents located in the S fissure (Lara
183
et al., 2004; Singer et al., 2008) and are rhyodacites and rhyolites respectively, with their
184
rare earth element patterns overlapping suggesting a common magma source (Castro et al.,
185
2013). The VEI 4 1960 eruption occurred 1.5 days after the 1960 Mw 9.5 Valdivia megathrust
186
earthquake suggesting a link between the two (Barrientos, 1994; Lara et al., 2004).
187
The 2011-2012 eruption of Cord´on Caulle (Figure 1) started on June 4, 2011 lasting for ∼9
months until March 2012, and was the first eruption of the volcano since 1960. The eruption
189
was preceded by significant ground uplift between 2007 and 2011 (Jay et al.,2014) and by 2
190
months of seismicity above background levels (Wendt et al.,2017;Delgado et al.,2018). The
191
eruptive vent was located on the northern scarp that bounds the graben structure (Figure 1).
192
The climactic phase of the eruption lasted ∼27 hours and ejected a ∼9-12 km high eruptive
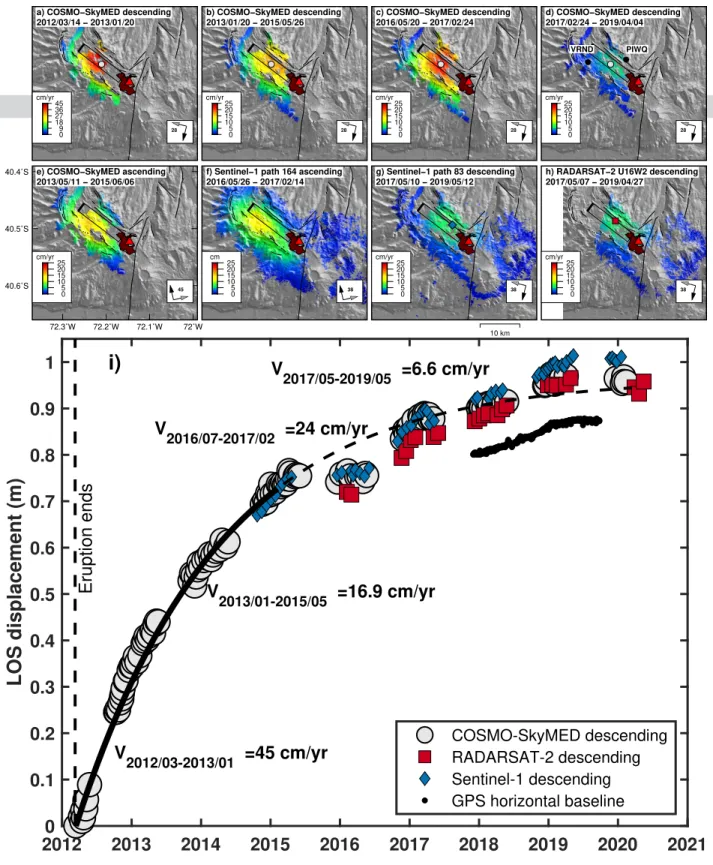
193
column, with a VEI of 4-5 with a mass flow rate (MFR) of ∼107 kg/s, which then decreased
194
to ∼106 kg/s (Bonadonna et al., 2015). The eruption style shifted from purely explosive
195
to hybrid explosive–effusive on June 15, with the extrusion of ∼0.6 km3 of a rhyolitic lava
196
flow (Coppola et al.,2017, Figure 1) punctuated by mixed ash-gas jets with Vulcanian blasts
197
(Schipper et al., 2013; Castro et al., 2014) with MFR <∼ 106 kg/s, and correlated with
198
an increase in the quasi-harmonic tremor (Bertin et al., 2015). The lava time averaged
199
discharge rate (TADR) decreased exponentially from the onset of extrusion until
October-200
November 2011 (Coppola et al., 2017), when a second pulse of lava effusion increased both
201
the quasi-harmonic tremor and TADR until the eruption ended in March 2012 (Bertin et al.,
202
2015; Coppola et al., 2017). A shallow laccolith with a volume of ∼0.8 km3 was emplaced
203
at depths of 0.2-0.4 km during the first month of the eruption in the transition from purely
204
explosive to hybrid explosive-effusive activity (Castro et al.,2016;Delgado et al.,2019). The
205
total erupted volume is ∼1.22 km3 for the tephra erupted between June 4-7, 2011 (Pistolesi
206
et al., 2015) and ∼1.2 km3 bulk (Castro et al., 2016) to 1.45 km3 DRE (Delgado et al.,
207
2019) for the lava flow and the shallow laccolith. Field observations in early January 2012
208
showed that the lava extrusion was coeval to a weak eruptive column, gas and ash jetting
209
punctuated by short Vulcanian blasts (Schipper et al., 2013). The erupted magma has a
210
rhyolitic composition (explosive phase pumice 69.5% SiO2, lava 71-72% SiO2) that overlaps
211
with the composition and rare earth elements of the 1960 and 1921-1922 eruptions, and was
212
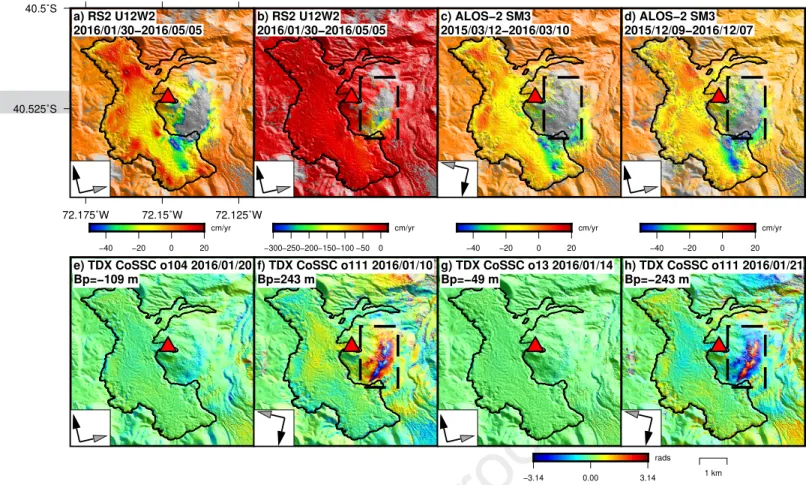
stored at depths between 2.5 and 6 km (Castro et al., 2013; Jay et al., 2014; Wendt et al.,
213
2017). The explosive phase magma was nearly aphyric resulting in a highly mobile rhyolite
214
with fast ascent rates (Castro et al., 2013).
215
4
InSAR methods
216
In this review I have included observations from almost every SAR mission available since
217
2003, which include ENVISAT, ALOS-1, TerraSAR-X/TanDEM-X (TSX/TDX),
COSMO-218
SkyMED (CSK), RADARSAT-2 (RS2), UAVSAR, Sentinel-1 (S1) and ALOS-2 (Table 1).
219
Data from ERS-1/2 are only briefly described due to its low quality (Pritchard and Simons,
220
2004). SAR data from the legacy JERS and RADARSAT-1 and from the newer SAOCOM-1
221
and PAZ missions are not available.
222
The first InSAR studies at Cord´on Caulle (Pritchard and Simons, 2004; Jay et al., 2014)
223
used individual interferograms processed with a standard range-Doppler processing chain
implemented in the legacy JPL ROI PAC software (Rosen et al.,2004). New algorithms and
225
processing tools like SAR focusing with a motion compensated orbit (Zebker et al. 2010),
ge-226
ometric coregistration (Sansosti et al.,2006) and zero-Doppler processing (Eineder,2003) for
227
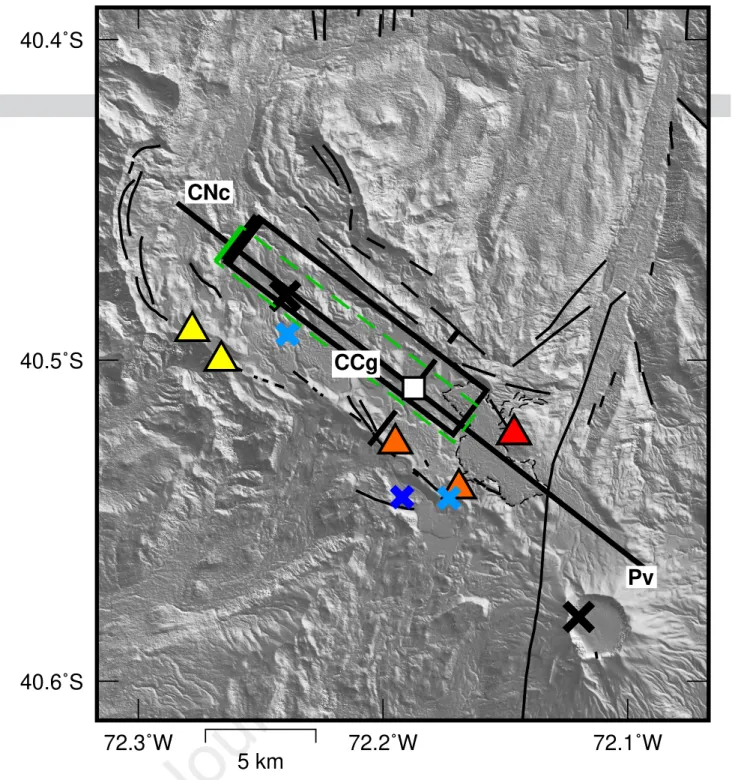
individual interferograms and time series have been implemented in the JPL ISCE (Rosen
228
et al., 2012) and ISTerre/IPGP NSBAS (Doin et al., 2011; Grandin, 2015) software. All
229
the interferograms and time series presented in this study (Figure 3 - Figure 6) were
pro-230
cessed with the ISCE software except two co-eruptive ENVISAT interferograms which were
231
processed with the ROI PAC software (Figure 4a-b, Jay et al., 2014) and the Sentinel-1
232
descending time series (Figure 5) that was processed with the NSBAS software. Data
pro-233
cessing is described in detail in the supplementary information (SI) and elsewhere (Delgado
234
et al., 2016, 2017). Due to the improvement of the InSAR workflows and a better data
235
availability, I have used these new tools to reprocess interferograms from the now legacy
236
ENVISAT and ALOS-1 missions presented in previous studies (Jay et al., 2014; Euillades
237
et al., 2017;Wendt et al.,2017). These results include new ALOS-1 time series and a source
238
model for the first episode of ENVISAT-detected uplift between 2003 and 2007, which extend
239
the sequence of pre-eruptive uplift from February 2007 (Jay et al.,2014) to February 2003.
240
Further, I have also expanded CSK, RS2 and S1 time series from May 2018 (Delgado et al.,
241
2018) to May 2020.
242
5
InSAR observations
243
In this section I describe all the deformation signals observed between 2003 and 2020 at
244
Cord´on Caulle.
245
5.1
Pre-eruptive ground deformation
246
5.1.1 1993-1996
247
Pritchard and Simons,2004presented a single ERS-1/2 interferogram that recorded 8 cm of
248
subsidence at the Cord´on Caulle graben during 1996-1999. The limited temporal resolution
249
of this interferogram and the lack of other independent data results in a large degree of
uncer-250
tainty in the interpretation of this deformation signal, which has been attributed to changes
251
in the hydrothermal system of the volcano (Matthew Pritchard, personal communication).
252
Therefore this data set is not considered further in this study.
5.1.2 2003-2007
254
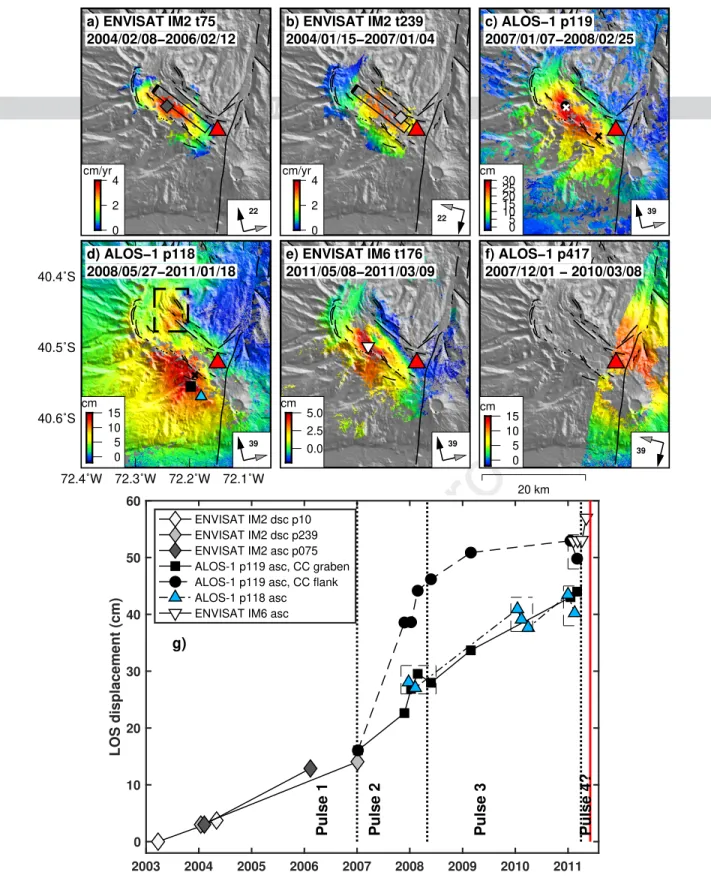
The first unambiguous observations of ground uplift were recorded by ENVISAT IM2
as-255
cending and descending interferograms (Fournier et al., 2010) and span 2003 to 2007, with
256
a maximum line-of-sight uplift rate of ∼3-4 cm/yr observed at the Cord´on Caulle graben
257
(Figure 3a-b and Figure S1). These interferograms can be modeled by the opening of a sub
258
horizontal sill at a depth of 5.2 km with a total volume change of 0.013 km3 during 2003-2007
259
(Supplementary Material).
260
5.1.3 2007-2011
261
A second pulse of uplift was detected by ALOS-1 ascending interferograms which recorded
262
∼30 cm during January 2007 and February 2008 (Figure 3c). The deformation signal is
263
located on both Cord´on Caulle and Cordillera Nevada caldera and can be modeled by two
264
spherical sources at depths between 2.8 and 4.1 km, with a total volume change of 0.023
265
km3 (Fournier et al., 2010; Jay et al., 2014). The poor temporal sampling of the data does
266
not allow to properly assess the temporal evolution of uplift
267
A third pulse of uplift occurred during mid 2008 to early 2009, with a maximum uplift
268
of ∼15 cm recorded by ALOS-1 ascending data. The deformation signal was observed in
269
the W flank of Cord´on Caulle and is different in location to that of the 2007-2008 episode
270
(Figure 3). Because the line-of-sight (LOS) is the same than for the the 2007-2008 episode of
271
uplift, the shift in location is produced by a different source compared to that of 2007-2008.
272
Different deformation sources (small sphere, prolate spheroid, sill) can model the data, with
273
depths between 5 and 9 km, although none can properly fit both ascending stacks and a
274
single descending interferogram (Figure 3f). The source volume change during 2008-2009
275
is 0.03 km3 for the spherical source (Jay et al., 2014). Jay et al., 2014 showed that uplift
276
paused between 2009 and 2010, but the ALOS-1 time series shows that uplift continued from
277
2010 to 2011 (Figure 3). Therefore I consider that the episode lasted between May 2008 and
278
January 2011.
279
Jay et al., 2014 observed a small uplift signal located within Cordillera Nevada caldera
280
near the Trahuilco geyser (Sepulveda et al., 2004) that occurred between February 13 2010
281
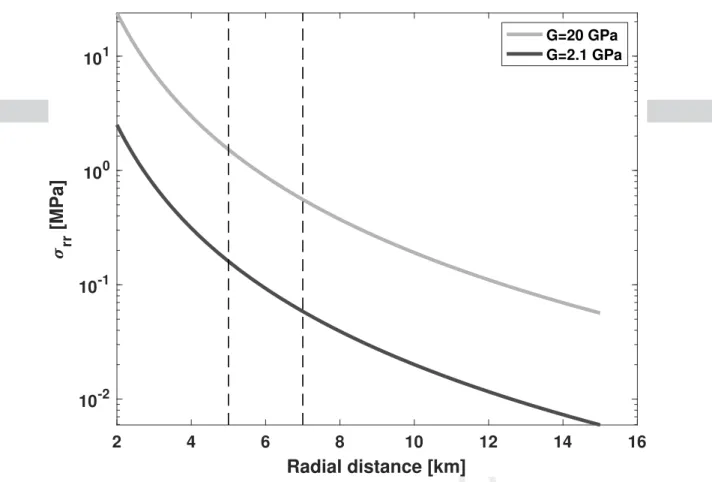
and March 31 2010 (Figure 3d). This deformation signal was modeled with a very shallow
282
spherical source at a depth of 1.7 km with a volume change of 0.0014 km3.
283
A fourth pulse of uplift with an amplitude of 5 cm was recorded by ENVISAT IM6 data
284
during March-May 2012. The data can be modeled with a sill at a depth of 4 km with a total
285
volume change of 0.003 km3(Jay et al.,2014). HoweverEuillades et al.,2017speculated that
286
the signal observed in this interferogram could be an atmospheric artifact, but pair-wise logic
287
could not be applied to discriminate between these two scenarios. Due to this discrepancy,
this signal is not considered further.
289
Therefore, InSAR data suggests at least three pulses of pre-eruptive uplift at depths between
290
3 and 9 km. The simplest and most likely mechanism to explain these signals is magma
291
injection in a shallow crystal mush underlying the volcano because the deformation sources
292
are much deeper than the inferred depth of the shallow hydrothermal system (Sepulveda
293
et al., 2005, 2007; Jay et al., 2014). The spatial shift in location of the deformation signals
294
results from magma injection in different parts of the plumbing system of Cord´on Caulle
295
and will be discussed with detail later in the manuscript. The only exception is the localized
296
deformation in the Trahuilco Geyser in early 2010, which Jay et al., 2014 interpreted to
297
be of hydrothermal origin in response to the dynamic triggering of the 2010 Mw 8.8 Maule
298
earthquake.
299
5.2
Co-eruptive ground deformation
300
The co-eruptive ground deformation signals are different compared with those of the sequence
301
of pre-eruptive uplift. The eruption started 2 months after the end of the ALOS-1 mission
302
and during the ENVISAT extension mission. The latter was the only satellite that recorded
303
data throughout the complete eruption and was the core data analyzed by all the studies
304
that have studied the eruption with InSAR (Jay et al., 2014; Bignami et al., 2014; Wendt
305
et al., 2017; Euillades et al., 2017; Delgado et al., 2019), with five additional TSX and RS2
306
interferograms processed by Delgado et al., 2019.
307
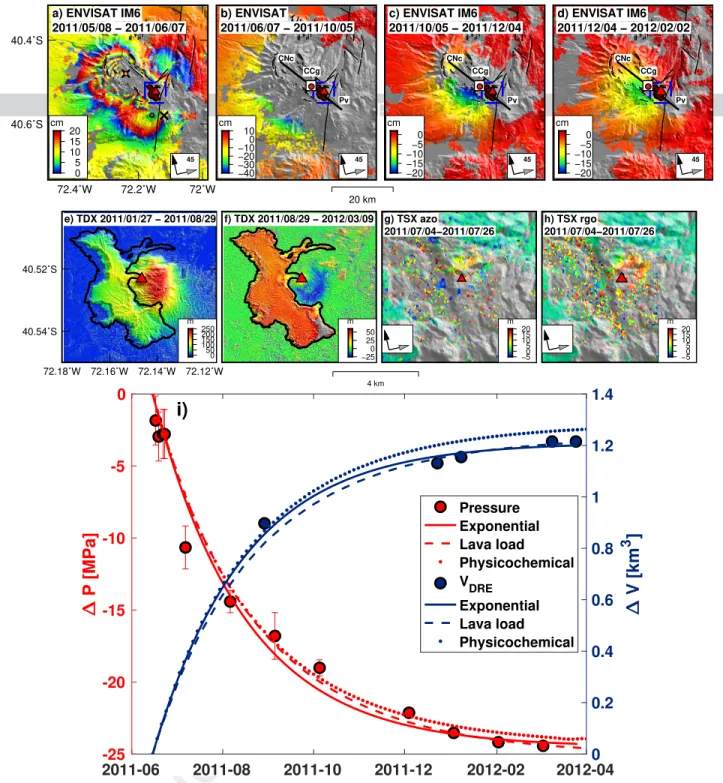
A 30-day interferogram that spans the first three days of the eruption (June 04-07 2011)
308
shows 1.3 and 0.3 m of LOS subsidence at Cordillera Nevada caldera and Puyehue volcano
309
respectively (Figure 4a, Jay et al., 2014; Bignami et al., 2014; Wendt et al., 2017). The
310
subsidence was produced by deflating sources located at depths of 3.8 and 6.1 km with a
311
total volume change of ∼ 0.11 km3 respectively. The deformation sources are offset 10-15
312
km from the eruptive vent which implies a mechanism of lateral magma transport from
313
these lateral sources to the eruptive vent. Interferograms that span the rest of the eruption
314
have no coherence on top of the volcano until the eruption waned and coherence increased
315
during the 2011-2012 austral summer. Nevertheless, all of these data sets record several
316
tens of centimeters of subsidence due to lava effusion (Figure 4b-c). The post June 7 2011
317
deformation signal can be modeled by a finite-sized prolate spheroid calculated with the finite
318
element method based on the inversion for an analytic model (Delgado et al.,2019), providing
319
better model fits than previous attempts with a single Mogi source (Jay et al.,2014; Wendt
320
et al.,2017). The spheroid depth is ∼5.2 km below the volcano, centered on the graben and
321
oriented in the direction of the volcanic chain. The spheroid semi-major and semi-minor
322
axes are 10 and 2.5 km respectively (Figure 4, Figure 7). Delgado et al., 2019 inverted 20
323
coherent interferograms with the spheroid source fixed to retrieve a time series of pressure
change that follows an exponential trend (shown inFigure 4for the effusive phase only). The
325
best-fit spheroid and the time series of pressure change predict a pressure drop of ∼20-50
326
MPa, a reservoir volume change of 0.5 km3, and ∼2.2-2.7 m of LOS subsidence on top of the
327
volcano (Figure 2). The data also suggests a slight change in the deformation source during
328
the second half of the eruption, in agreement with a second pulse of lava effusion (Bertin
329
et al., 2015; Coppola et al., 2017), but the change was minor and therefore not described
330
here further. These three deflating sources (two during June 04-07 2011 and one during the
331
rest of the eruption) are consistent with three bodies of magma tapped during the first week
332
of the eruption (Alloway et al., 2015). In general the depths of the spherical and prolate
333
spheroidal sources of 4-6 km are in agreement with depths inferred from geobarometry (Jay
334
et al.,2014) and experimental decompression of the mineral phases observed in the erupted
335
tephra (Castro et al.,2013).
336
5.2.1 Lava flow effusion and laccolith intrusion
337
TanDEM-X CoSSC (Coregistered Slant range Single look Complex) data were acquired
338
before and several times during the effusive phase of the eruption. These data were used
339
to calculate six high-resolution DEMs that were subtracted to produce differential DEMs
340
(dDEMs) that allow to calculate both time-averaged discharge rates (TADR) and time series
341
of extruded volume. The dDEM data show a maximum thickness of ∼150 m for the lava
342
flow and an area of topographic increase up to ∼250 m immediately east of the lava flow and
343
the eruptive vent (Figure 4e-f). This area of uplift was interpreted and modeled by Castro
344
et al.,2016to be produced by the intrusion of a laccolith at very shallow depths of ∼0.2-0.4
345
km below the surface. The time series of lava flow and laccolith intrusion volume shows
346
an exponential trend with a total volume of ∼1.45 km3 DRE during the whole eruption
347
(Figure 2) and ∼1.2 km3 DRE during the effusive phase of the eruption (Figure 4, Delgado 348
et al., 2019).
349
The temporal resolution of the TDX dDEM data (∼1 data point every 2 months) does not
350
allow to pinpoint when did the laccolith intruded with respect to the explosive to effusive
351
transition. Single Look Complex (SLC) amplitude images from ENVISAT and TerraSAR-X
352
data were also used to track the growth of the laccolith (Castro et al., 2016; Delgado et al.,
353
2019). Both studies conclude that the laccolith was emplaced during both the explosive and
354
effusive phases of the eruption, starting probably during the first 4 days of the eruption and
355
one week before the lava flow effusion. Pixel tracking calculated on these amplitudes images
356
show range and azimuth displacements that exceed ∼20 m due to laccolith post-emplacement
357
dynamics (Figure 4). The displacement is large enough that it can be observed directly in
358
the coregistered amplitude images (not shown).
5.2.2 Physicochemical model of the effusive phase of the eruption
360
The 2011-2012 eruption is one of the few effusive eruptions to date where both time series
361
of ground deformation and topographic change were acquired nearly simultaneously, and
362
that showed quasi-exponential trends, like those observed in other eruptions (Anderson and
363
Segall, 2011). This makes the 2011-2012 eruption one of the few of this kind where a
time-364
dependent physicochemical model can be attempted, like at Mt St Helens (Anderson and
365
Segall, 2013).
366
The physicochemical model developed byDelgado et al.,2019is adapted fromAnderson and
367
Segall,2011,2013and simulates the pressure drop in a magma reservoir (∆P (t)) and the lava
368
extrusion (∆V (t)) driven by this pressure drop. Here magma ascends to the surface through a
369
conduit from a depressurized horizontal prolate spheroid reservoir that contains isothermal
370
magma made up of melt, crystals, and exsolved and dissolved volatiles in a linear elastic
371
half-space under a lithostatic load. As magma outflows from the reservoir, the flow rate is
372
controlled by the conduit radius, reservoir pressure, and magma viscosity, which is a function
373
of the dissolved H2O and the crystal volume fraction. During the eruption, magma piles up
374
on top of the eruptive vent, increasing the lithostatic load on the reservoir, and reducing the
375
pressure gradient that drives the conduit flow. Since the data have no sensitivity to conduit
376
processes, magma properties were assumed constant in the conduit and allowed to vary only
377
in the reservoir, The model can be solved with different levels of complexities for constant
378
magma properties (hereafter exponential model), constant magma properties but with a
379
dependent surface load due to magma extrusion (hereafter lava load model) and
time-380
dependent magma properties in the reservoir and with a time-dependent surface surface load
381
(hereafter physicochemical model). The model parameters are the magma compressibility
382
(βm), conduit conductivity (ratio of the fourth power of conduit radius and magma viscosity)
383
and pressure drop (pch) for the exponential and lava load models, and the initial overpressure,
384
conduit radius, total CO2 and H2O in the magma for the physicochemical model. Equation 1
385
-Equation 2 show the analytic model (equations 1-4 inDelgado et al., 2019and A11-A12 in
386
Anderson and Segall, 2011),
387
∆P (t) = −pch(1 − e−t/τ) (1)
388
∆V (t) = V0(βm+ βch)pch(1 − e−t/τ) (2)
with V0 and βch the reservoir volume and compressibility and τ a time constant function of
389
the plumbing system geometry. These models predict exponential-like trends for the reservoir
390
pressure change and the extruded volume, like those observed in the data (Figure 4).
391
Despite the complexities of the eruption, the low coherence and the poor temporal temporal
392
resolution of the InSAR data, Delgado et al., 2019 found that the magma compressiblity of
the lava flow and intruded laccolith during the effusive phase is ∼ 1 × 10⁻¹⁰P a−1. This value
394
is half that of the calculated compressibility for the erupted tephra of ∼ 2 × 10⁻¹⁰P a−1 (Jay
395
et al., 2014). This is consistent with rhyolitic magma that was degassed with respect to its
396
equilibrium condition at its storage depth of ∼5 km based on H2O and CO2 solubility models
397
(Delgado et al., 2019). The models also predict remarkably well the temporal evolution of
398
the effusive phase, which follows an exponential trend for both the source pressure drop and
399
extruded volume (Figure 4).
400
5.3
Post-eruptive inflation
401
A significant technological change occurred during the end of the eruption. The end of the
402
ENVISAT extension mission coincided with the onset of CSK acquisitions which resulted
403
in an increase in the data temporal resolution by more than one order of magnitude. This
404
resulted in the application of dense InSAR time series for the first time in the volcano with
405
CSK and RS2 stripmap data (Delgado et al., 2016; Euillades et al., 2017).
406
Deformation following the eruption started almost immediately, with uplift at an extremely
407
fast rate up to 45 cm/yr during March 2012 - January 2013 – the fastest ever detected
408
with satellite geodesy (GPS, InSAR) at a rhyolitic volcano. The uplift rate decreased in
409
March 2013 to ∼17 cm/yr until May 2015 when deformation abruptly ended. The uplift
410
can be modeled by a pressurized subhorizontal distributed opening sill at a depth of 6.2
411
km with a volume change of 0.125 km3 (Delgado et al., 2016, uniform opening sill shown in
412
Figure 5). The time series of uplift during 2012-2015 follows an exponential trend which was
413
interpreted by Delgado et al., 2016 to be evidence of magma injection (e.g., Lengline et al.,
414
2008; Le M´evel et al., 2016), although at the time other deformation mechanisms could not
415
be ruled out. Delgado et al., 2018 tested whether the exponential trend could result due to
416
viscoelastic relaxation following a transient pressure increase in the magma reservoir. They
417
concluded that a model of a pressurized spheroid surrounded by a Maxwell viscoelastic shell
418
with a viscosity of 2 × 10¹⁷ Pa s and a 1 km radius and with a transient pressure function of
419
the form P = Pf(1 − e−t/τ) with τ =0.4 years, Pf=10 MPa could fit the data. However, the
420
fit was worst than the magma injection model in an elastic medium, ruling out viscoelastic
421
effects.
422
After one year with no deformation, uplift resumed in July 2016 until February 2017 (
Eu-423
illades et al., 2017; Delgado et al., 2018). This episode of uplift marks the first time that a
424
complete multiparametric set of X, C and L band observations from ascending and
descend-425
ing CSK stripmap, S1 TOPS, RS2 Wide Ultra Fine and Wide Fine stripmap and ALOS-2
426
ScanSAR and stripmap data image the same episode of ground deformation at the volcano.
427
The uplift event reached ∼12 cm in 6 months – equivalent to an uplift rate of ∼24 cm/yr,
428
and ended abruptly in February 2017 as it did during May 2015. The spatial footprint of
the deformation signal is very similar to that of the 2012-2015 episode of uplift. Delgado 430
et al., 2018 tested whether the uplift was due to a different source and concluded that it
431
is the same deformation source active during 2012-2015, but with a much smaller volume
432
change of ∼0.022 km3. This yields a total source volume change of 0.147 km3 during March
433
2012 - February 2017. The lack of interferometric coherence during the winter with C and
434
X-band data and the poor temporal sampling of ALOS-2 L-band data did not allow to assess
435
whether the time series of the 2016-2017 episode of uplift follows an exponential or a double
436
exponential trend as observed elsewhere (Le M´evel et al., 2016).
437
Delgado et al., 2018 showed potential evidence for a third pulse of uplift during May 2017
438
- May 2018, but the limited amount of data did not allow to confirm this. New GPS and
439
InSAR observations from CSK, RS2 and S1 (Figure 5) show that deformation continued
440
beyond May 2018 during a third episode between May 2017 - May 2019, with a rate of ∼5-6
441
cm/yr depending on the data set and resulting in a total of 1 m of post-eruptive uplift.
442
As during 2016-2017, the deformation signal during 2017-2019 is very similar to that of
443
2012-2015 suggesting the same deformation source (Figure 5).
444
5.3.1 Lava flow and laccolith post-emplacement ground deformation
445
Delgado et al., 2016 presented small baseline RS2 and CSK interferograms spaning two
446
weeks during 2013 and 2014 that recorded ∼5-6 cm of LOS subsidence in the lava flow,
447
resulting in rates of ∼1.2-1.4 m/yr. However, the lack of a high resolution DEM at the
448
time of that study did not allow to better track the flow subsidence, reducing the analysis
449
to individual interferograms. A small-baseline stack of RS2 Wide Ultra Fine interferograms
450
that spans February to May 2016 plus two ALOS-2 SM3 interferograms during 2015-2016
451
show a complex pattern of lava flow subsidence with rates up to 0.5 m/yr in some areas of the
452
flow. Other areas of the flow show either uplift or eastward movement towards the satellite.
453
These signals cannot be attributed to a simple mechanism of homogeneous lava flow cooling
454
and subsidence (e.g., Ebmeier et al.,2012) and imply that sections of the flow were mobile,
455
probably flowing laterally four years after the end of the eruption. The extreme thickness of
456
the lava flow suggest that subsidence produced by cooling can last for several decades (e.g.,
457
Chaussard,2016). The RS2 stack shows subsidence in the E part of the laccolith, although
458
analysis of 2016 TanDEM-X bistatic interferograms shows that the phase in the laccolith is
459
proportional to the perpendicular baseline, suggesting a DEM error in that area (Figure 6,
460
SI).
6
Discussion
462
Here I discuss some interesting observations and lessons learned from the Cord´on Caulle
463
InSAR data and models. These include mainly the long term evolution of the plumbing
464
system of the volcano, the triggering mechanism and the temporal evolution of the
2011-465
2012 eruption.
466
6.1
Deformation sources
467
Source modeling approaches for Cord´on Caulle have ranged from the use of simple spherical
468
models (Jay et al., 2014) to viscoelastic finite element models (Delgado et al., 2018) and
469
physicochemical models that couple the reservoir pressure drop, conduit flow and magma
470
physicochemical properties (Delgado et al., 2019). Despite their simplicity, in general
ana-471
lytic and numerical source models explain the InSAR ascending and descending data well.
472
However, Jay et al., 2014 could not fit the ascending and descending ALOS-1 data for the
473
2008-2011 uplift pulse with an analytic model, which suggests that a more complex source
474
geometry is required to model that specific pulse of pre-eruptive uplift.
475
In general deformation sources are scattered along the extent of the volcanic chain, but
476
clustered near Cord´on Caulle (Figure 7). The similarity of the deformation sources during
477
2003-2007, 2007-2008, 2011-2012 during the effusive phase, and 2012-2017 suggest a
com-478
mon zone of magma storage and effusion, which could occur as a neutral buoyancy level at
479
depths of 4-6 km (Figure 7). This is in agreement with numerical models that show that
480
magma is preferably stored at those depths (Huber et al., 2019). Further, this deformation
481
zone has been episodically active before and after the eruption with slight changes in the
482
source geometry. For example, the model for 2012-2017 cannot fit well the 2007-2008 data
483
(not shown). This source stability in location and time and episodic unrest is similar to
484
other basaltic reservoirs like Okmok (Lu et al., 2010; Lu and Dzurisin, 2010, 2014) and
Ki-485
lauea (Poland et al., 2014). In general source spatial migration and stability are not well
486
understood but could be due just to discrete pulses of magma injection occurring across the
487
volcano (e.g.,Dzurisin et al.,2012). The reason why the 2012-2019 sill source is more stable in
488
location compared with the pre-eruptive sources is unknown. All these observations suggest
489
a large shallow plumbing system (Jay et al.,2014;Delgado et al.,2016) made up of either one
490
large crystal mush or several individual reservoirs under cold storage conditions (Cooper and
491
Kent, 2014) into which magma is episodically stored and injected. These observations also
492
suggest that the plumbing system of Cordillera Nevada and Puyehue are connected to that
493
of Cord´on Caulle, despite the three volcanoes having evolved independently (Singer et al.,
494
2008). To what extent the magmas of the three volcanoes interact mechanically, chemically
495
or thermally with each other is currently unknown.
The InSAR data indicates that pressure sources instead of dikes can model the data during
497
the onset of the eruption. This hypothesis was explored by Wendt et al., 2017 and the
498
transition between the explosive and effusive stages of the eruption is better explained with a
499
dike opening model than pressure sources (Castro et al.,2013). Wendt et al.,2017calculated
500
models of a dike and a sphere for the interferogram that spans the first three days of the
501
eruption (Figure 4a), but the model fit was significantly worst than a two sphere model.
502
During the rest of the eruption the prolate spheroid models ofDelgado et al.,2019can fit the
503
data very well with no need to invoke a dike. Although the dike intrusion is a very plausible
504
idea, the extent of phase decorrelation observed during the onset of the eruption implies
505
that the existing InSAR cannot unambiguously address this point. Very high resolution
506
pixel tracking on TSX stripmap data have the potential to unravel the role of co-eruptive
507
diking.
508
Despite the good fit of the models to the InSAR data, these models are oversimplfications of
509
magmatic systems. Magma reservoirs are crystal mushes (Bachmann and Bergantz, 2008)
510
which are better understood in terms of poroelastic mechanisms, but at the day of now these
511
models are novel (e.g.,Liao et al.,2018) and have not been used to model ground deformation
512
data. Further, these models have a lot of parameters that trade-off with each other and
513
that are not straightforward to constrain with geodetic data. Future studies should consider
514
reservoirs with more arbitrary geometries like the compound dislocation modelNikkhoo et al.,
515
2016, spheroids of finite-sized dimensions (Le M´evel et al., 2016; Delgado et al., 2019) and
516
poroelastic models (e.g., Liao et al., 2018). Also, the similar location and shape of the
517
deformation sources (Figure 7, Euillades et al., 2017) suggests that future studies may also
518
attempt a model that explains jointly the pre-eruptive, co-eruptive and post-eruptive ground
519
deformation data with a common source (e.g., Lu and Dzurisin,2010).
520
6.2
Eruption triggers
521
Forecasting eruptions is one of the key questions in volcano science (Sparks et al.,2012) and
522
the InSAR observations at Cord´on Caulle make this a promising case from which we can
523
draw insights that may improve forecasting of other eruptions. Any triggering mechanism for
524
the 2011-2012 eruption must account for the following facts: a) the eruption was preceded by
525
a transient sequence of at least three pulses of pre-eruptive uplift lasting between 6 months
526
and 4 years or more. (Figure 2, Figure 3), b) deformation sources that are scattered along
527
the volcanic chain (Figure 1), c) rhyolites are stored as crystal mushes under cold storage
528
conditions and are thermomechanically remobilized by magma injection that enhances melt
529
percolation towards the liquid-rich cap on top of the mush (Huber et al., 2010, 2011), and
530
d) ground uplift of very low magnitude to none (Figure 3) and an increase in the seismicity
531
between February and April 2011 (Wendt et al., 2017). Despite the variety of processes
532
that can be observed and modeled in crystal mushes (Bachmann and Bergantz, 2006;Huber
et al.,2012; Papale et al.,2017; Morgado et al.,2019), including segregation and merging of
534
melt-rich layers within a transcrustal mush (Sparks and Cashman 2017), at the day of now
535
all models of ground deformation in volcanoes fall under either of two generic categories:
536
magmatic or hydrothermal processes. The former includes basalt injection that pressurizes
537
the plumbing system, magma mixing, thermal heating without mixing and volatile exsolution
538
among others. For example, it is possible that basalt was injected below Cord´on Caulle and
539
did not mix with the crystal mush, only providing the heat to melt a fraction of the mush
540
(e.g., Morgado et al., 2019). Nevertheless, the vast majority of the InSAR studies argue
541
for injection of molten basalt that pressurizes the reservoir walls without further detail.
542
Since eruptions are triggered by magma injection on time scales shorter than a decade (e.g.,
543
Degruyter and Huber,2014;Townsend and Huber,2020), in the following I will only consider
544
the reservoir pressurization and rupture produced by magma injection.
545
A general rupture criteria (Tait et al., 1989; Pinel and Jaupart, 2003; Albino et al., 2010)
546
shows that a dike can propagate from the chamber to the Earth’s surface once the deviatoric
547
component of the minimum compressive stress in the reservoir walls is greater or equal than
548
the tensile strength of the rock. This means that the magma overpressure is twice the tensile
549
strength of the rock for a spherical reservoir in an infinite medium (Tait et al., 1989; Albino
550
et al., 2010). An extension of the previous criteria that considers both magma overpressure
551
and buoyancy for pressurized cavities in an elastic medium is (Sigmundsson et al., 2020)
552
∆ρgh + ∆Pmagma ≥ σf ailure+ σexternal (3)
with the terms from left to right the buoyancy force due to a magma body of thickness h,
553
and density contrast ∆ρ under gravity acceleration g, the magma overpressure ∆Pmagma,
554
σf ailure the failure limit and σexternal stress due to other processes (surface loading, flank
555
instability, transient changes in tectonics stresses, etc). In the absence of external triggers
556
( σf ailure = 0), an eruption can be triggered by an increase in the magma pressure due to
557
compressible or incompressible magma injection (∆Pmagma), an increase in the thickness of
558
a buoyant magma body or an increase in the density of the buoyant magma body due to
559
magma phase transitions in the reservoir, or all of the previous.
560
The 2003 to 2011 deformation sources are at depths of 4 to 9 km, which suggests that episodic
561
magma injection with a time-variable rate in a large elongated reservoir at a level of neutral
562
buoyancy is potentially responsible for triggering the eruption. Under the assumption that
563
the deformation is due to magma injection, the volume change of 0.013 km3 during
2003-564
2007 plus the 0.05 km3 during 2007 and early 2011 results in the intrusion ∼0.063 km3
565
of incompressible magma. This volume is one order of magnitude lower than the volume
566
of erupted magma and the co-eruptive source volume change, even accounting for magma
567
compressibility. The 2003-2007 source volume change is much smaller than the source volume
changes during 2007-2011 (Jay et al.,2014) therefore their role on potentially triggering the
569
eruption are very minor. The previous argument suggests that if the eruption was triggered
570
by magma injection until the reservoir walls ruptured when the hoop stress reached the tensile
571
strength of the rock, a significant amount of magma must have been intruded before 2003
572
(Jay et al., 2014). Unfortunately the volume of this potential magma is unconstrained due
573
to the lack of geodetic data before 1996. Therefore, other mechanism like volatile exsolution
574
(Tait et al., 1989) since the previous eruption in 1960 eruption cannot be ruled out. It is
575
also possible that reservoir was brought closer to failure due to magma buoyancy without
576
significant reservoir pressurization that can be detected geodetically (e..g,Sigmundsson et al.,
577
2020). An alternative mechanism is that magma injection in different parts of the plumbing
578
system of the volcano increased the failure pressure by lateral stress transfer (Albino and
579
Sigmundsson,2014). In this mechanism magma injection in a specific section of the plumbing
580
system can increase the failure pressure in other regions below the volcano, without the need
581
for mass injection in the reservoir from which magma will eventually erupt. This mechanism
582
is conceptually equivalent to earthquake triggering by an increase in the static Coulomb
583
stress. The normal stress σrr in a spherical source embedded in a full space is given by
584
σrr = −
∆V G
2πr3 (4)
with ∆V the source volume change, G the shear modulus and r the distance (equations 7.7
585
and 7.13 in Segall, 2010). The negative sign indicates compression, so a positive volume
586
change produces compression. A volume change of 0.03 km3 in the 2008-2011 source with
587
G=20-2.1 GPa (Delgado et al.,2019; Heap et al.,2020) can increase the radial stress to 0.06
588
- 2 MPa over distances of 5-7 km, similar to the distance between the 2007-2008 and the
589
early June 2011 deformation sources (Figure 8). If either of these reservoirs were in a critical
590
state, these stresses due to magma injection can influence the reservoirs and potentially bring
591
them closer to failure (e.g., Albino and Sigmundsson, 2014; Biggs et al., 2016).
592
In summary the InSAR observations allow for multiple mechanisms to explain the eruption
593
triggering. It is also likely that several of these triggering mechanism were coeval and that
594
InSAR just recorded a very low resolution image of these processes (e.g., Bachmann and
595
Huber, 2016; Lowenstern et al., 2017). Further, the time span covered by the pre-eruptive
596
InSAR observations of ground uplift is only 8 years and it is so short with respect to the
597
previous eruption in 1960 and the time scales of magmatic processes so it is very difficult to
598
disentangle the relevant contribution of these individual processes. Thereby, the complete
599
lack of ground instrumental data before 2010 when seismic monitoring started and the total
600
lack of other observations before 1996 do not allow to unambiguously unravel the triggering
601
mechanism. Due to the large deformation in the past two decades, pixel tracking from
602
either historical satellite or airborne imagery could provide insights on these processes (e.g.,
603
Derrien et al.,2015).
6.3
Eruption temporal evolution
605
Despite the complexity of the eruption with two pulses of lava effusion (Coppola et al.,2017),
606
the intrusion of a shallow laccolith (Figure 4), and three sources of ground deformation
607
(Figure 7), both the erupted volume and pressure change time series derived from InSAR
608
can be explained reasonably well with a simple model. The model is made of a finite-sized
609
spheroid that deflates in response to lava effusion through a conduit, with both the effusion
610
and the deflation following exponential trends (Equation 1-Equation 2). It is true that
611
deviations from exponential trends (e.g.,Kubanek et al.,2017) require more complex models
612
including magma permeability (e.g., Wong and Segall, 2019) or a widening dike/conduit
613
(e.g, Castruccio et al.,2017), but the simple trends observed in the data during the effusive
614
phase do not require such level of complexity. The key finding of the physicochemical models
615
is that the magma compressibility during the effusive phase is significantly lower compared
616
with the compressibility inferred for the magma erupted during the explosive phase. This is
617
a consequence of a partially degassed rhyolite with respect to the predicted dissolved H2O
618
and CO2 for a storage depth of ∼5 km (Delgado et al.,2019). On the other hand, a relevant
619
question is why did the deflating sources shift from Cordillera Nevada caldera and Puyehue
620
volcano to the Cordon Caulle graben during the first month of the eruption? (Figure 4a-b).
621
Since magma flow is proportional to the pressure gradient, the first two reservoirs had less
622
magma capable of flowing than the third one or their hydraulic conductivity decreased very
623
rapidly compared with that of the source below Cordon Caulle. This is a topic that requires
624
further studies.
625
6.4
Mechanisms of unrest during pre and post-eruptive uplift
626
The similarities in the ground deformation during the transient uplift in 2003-2007,
2007-627
2008 and 2012-2019 and their chronology with respect to the eruption suggest that the same
628
processes are responsible for observed signals, which for simplicity I related to magma
in-629
jection. Since the 2012-2015 uplift started immediately after the end of the eruption, this
630
episode of unrest can be easily explained as a pulse of magma injection. This episode was
631
triggered by the 20-50 MPa co-eruptive pressure drop (Delgado et al.,2019), allowing magma
632
to flow from a deep mantle source to the shallow sill source (e.g., Lengline et al.,2008;
Del-633
gado et al.,2016). The prediction of this mechanism is a decreasing exponential trend in the
634
ground deformation data which was observed during 2012-2015 (Figure 5, Delgado et al.,
635
2016; Euillades et al., 2017). The similarity in the deformation pattern between the
2012-636
2015, 2016-2017 and 2017-2019 pulses of uplift suggest that the three are produced by magma
637
injection in the same reservoir, although the time series does not show evidences of
expo-638
nential signals (Figure 4). On the other hand, viscoelastic relaxation produced by transient
639
pressurization followed by stress relaxation in a viscous shell surrounding the reservoir was
out that more complex viscoelastic rheologies (e.g., Head et al., 2019) or a more realistic
642
pressure functions can explain the data equally well than the magma injection model. Also,
643
this does not rule out that viscoelastic relaxation is important over longer time scales (10-100
644
years).
645
It is also striking that some of these episodes of uplift can be very short, ranging from ∼6
646
months to several years. However, their episodic nature for both the onset and end of uplift
647
is not predicted by the models of pressure-driven magma injection because they assume
648
that injection is a prescribed boundary condition. The only option is to incorporate some
649
aspect of the internal dynamics of magma reservoirs into these models (Walwer et al.,2019).
650
Delgado et al.,2016cited inelastic effects such as conduit clogging to explain the abrupt end
651
of the deformation in 2015, as it occurred before the exponential trend in the data reached
652
a value close to its asymptote (Figure 5). The factors controlling the transient deformation
653
before the eruption are also relevant. However, the poor temporal resolution of the
2003-654
2011 data does not allow to resolve the actual onset and end of the episodes of uplift within
655
several months or even years (Figure 3).
656
Rhyolitic genesis at Cord´on Caulle suggests fractional crystallization from basaltic melts
657
(Gerlach et al., 1988; Singer et al., 2008), raising the questions to whether the InSAR data
658
are sensitive to the composition of the magma injected in the storage level of neutral buoyancy
659
or not. Delgado et al. 2018 used the Poiseuille flow law (Jaupart,2000) to infer the magma
660
composition and concluded that the problem is ill-conditioned because the magma viscosity –
661
a proxy for composition, depends on the fourth power of the conduit radius. This parameter
662
is poorly constrained and this uncertainty results in a wide range of magma viscosities
663
spanning many orders of magnitude. Studies on basaltic systems estimate conduit radii of
1-664
5 m (Fukushima et al.,2010;Pedersen and Sigmundsson,2006) and these values indicate that
665
the injected magma at Cord´on Caulle must be basaltic. Therefore, at the moment InSAR
666
cannot provide robust constrains on the magma composition during transient episodes of
667
uplift.
668
I infer that successive intrusions in the remarkably stable level of neutral buoyancy at ∼6
669
km depth result in the coalescence of these magma bodies on time scales of 10-100 kyr,
670
while the individual magma injections during 2003-2019 should not be able to coalesce on
671
these short scales of less than 10 years (Biggs and Annen, 2019). Therefore, these multiple
672
injections rejuvenate the system thermally but do not interact chemically with each other
673
(e.g., Morgado et al., 2019). Instead, these individual and small pockets of melt might
674
remain molten and isolated as high melt fraction magma surrounded by the much bigger
675
crystal mush (e.g., Gansecki et al., 2019). Finally, is it possible that the InSAR data shows
676
evidence of a mush reorganization process that occurs at depths between 4 and 8 km due
677
to volatile exsolution? Here layers of melt can segregate and migrate over multiple levels in
678
the upper crust (Cashman et al., 2017; Sparks and Cashman, 2017; Sparks et al., 2019). I
consider this a plausible situation for the storage depths of 4-9 km and deserves its detailed
680
analysis. Geophysical imaging like seismic tomography should be able to provide insights
681
between these scenarios.
682
Despite the 1 m of post-eruptive uplift between March 2012 until April 2019, the likely
683
injection of magma has not resulted in an eruption. The injection of 0.146 km3 (Delgado
684
et al.,2018) of magma, most likely basalt, is significantly smaller than the co-eruptive volume
685
change of ∼0.6 km3(Jay et al.,2014;Delgado et al.,2019) and about twice the volume change
686
of the pre-eruptive sources during 2003-2011. I use the rupture criteria of Browning et al.,
687
2015 to estimate the maximum rupture pressure pe for an individual episode of magma
688
injection (Equation 5- Equation 6).
689 pe = ∆Vm Vmβ (5) Vm = Ve T0β (6)
Here Vm is the volume of the reservoir, Ve is the erupted volume, T0 is the tensile strength
690
of the rock, β is the combined reservoir and magma compressibility, pe is the reservoir
691
overpressure and ∆Vm is the volume of the injected magma. Assuming an erupted volume
692
Ve = 2.2 km3 that includes the tephra (1 km3), the lava flow and the shallow laccolith (1.2
693
km3 DRE, Delgado et al., 2019) and an intruded volume ∆V
m = 0.145 km3 during March
694
2012 and February 2017 and a tensile strength of the rock T0 = 20 MPa, then the maximum
695
pressurization in the reservoir is pe = 1.3 MPa. Therefore, I hypothesize that it will take
696
several decades to reach the same failure threshold inferred before the 2011 eruption and with
697
pulses of episodic injection similar to those observed during 2012-2019. This assumption only
698
holds if the mechanical conditions on the reservoir are time-invariant which is rarely the case
699
(e.g., Carrier et al., 2015).
700
6.5
Structural control of an active magma intrusion
701
Cord´on Caulle is considered a landmark case of a volcano in the SVZ where the local
struc-702
tural setting plays a role controlling magma and eruption dynamics (Lara et al., 2004,
703
2006a,b; Cembrano and Lara, 2009; Wendt et al., 2017). By tectonic control I refer to
704
the structural heritage and not to the current neotectonic characteristics of the SVZ. The
705
volcanic chain is emplaced on top of a NW-SE regional basement structure that is
misori-706
ented with respect to the current kinematic regime of the SVZ and could be resheared to
707
favor magma emplacement by static stress changes triggered by a megathrust earthquake
708
(e.g., Lara et al., 2006b; Cembrano and Lara, 2009). All the vents of the 1921-1922, 1960