HAL Id: hal-01789357
https://hal.archives-ouvertes.fr/hal-01789357
Submitted on 17 Jan 2021
HAL is a multi-disciplinary open access
archive for the deposit and dissemination of
sci-entific research documents, whether they are
pub-lished or not. The documents may come from
teaching and research institutions in France or
abroad, or from public or private research centers.
L’archive ouverte pluridisciplinaire HAL, est
destinée au dépôt et à la diffusion de documents
scientifiques de niveau recherche, publiés ou non,
émanant des établissements d’enseignement et de
recherche français ou étrangers, des laboratoires
publics ou privés.
Riding the Right Wavelet: Quantifying Scale Transitions
in Fractured Rocks
Roberto Rizzo, David Healy, Natalie Farrell, Michael Heap
To cite this version:
Roberto Rizzo, David Healy, Natalie Farrell, Michael Heap. Riding the Right Wavelet: Quantifying
Scale Transitions in Fractured Rocks. Geophysical Research Letters, American Geophysical Union,
2017, 44 (23), pp.11,808 - 11,815. �10.1002/2017GL075784�. �hal-01789357�
underlying causes that prompt this shift from a distributed to a localized assemblage of cracks or fractures. For the first time, we used an image analysis tool developed to investigate orientation changes at different scales in images of fracture patterns in faulted materials, based on a two-dimensional continuous wavelet analysis. We detected the abrupt change in the fracture pattern from distributed tensile microcracks to localized shear failure in a fracture network produced by triaxial deformation of a sandstone core plug. The presented method will contribute to our ability of unraveling the physical processes at the base of catastrophic rock failure, including the nucleation of earthquakes, landslides, and volcanic eruptions.
Plain Language Summary
Rocks contain cracks; these cracks are important because when rocks are placed under load (whether natural or man made), these flaws concentrate stress. Stress concentrations lead cracks to link up to form throughgoing features, such as faults. This is how earthquakes, landslides, and volcanic eruptions start: processes occurring at a small scale (e.g., micrometers) have large-scale consequences. Laboratory experiments have shown that there is a rapid transition in behavior of porous materials under stress: at a certain point, the cracks interact and coalesce in a narrow zone, rather than being distributed throughout the material. In this work we present a novel technique that is able to quantify the transition between distributed (“stable”) deformation and localized (“unstable”) deformation, in terms crack sizes and orientations at the point of failure. This will help us to understand the physics underlying the initiation of catastrophic events, such as earthquakes, landslides, and volcanic eruptions.1. Introduction
Experimental evidence suggests that the nucleation of a fault is due to an abrupt change in the fracture pat-tern from distributed (“stable”) damage accumulation to localized (“unstable”) and well-organized fracturing (Lockner et al., 1992). This discontinuous change in the mechanical state of a rock sample under stress can be compared to a first-order phase transition involving a “latent” energy (e.g., a transition from a liquid to a gaseous state) (Alava et al., 2006); cracks of a certain length (that we will define as the critical length) and with certain spatial distribution (density) accumulate energy until the critical stress (𝜎C) are reached. At𝜎C dam-age manifests itself as an abrupt jump from distributed microcracks to the growth of a macroscopic localized feature, that is, a fault.
Ouillon et al. (1995) offered an interesting synthetic example of short en echelon cracks merging at a larger scale into a throughgoing shear fracture (or fault). They detected the length scale transition at which the finer scale en echelon crack pattern gives way to, or is dominated by, the coarser oblique fracture using a Mexican hat wavelet. Wavelets are highly flexible and efficient tools for signal and image processing. The method involves translating and scaling (“zooming”) a basic filter, the analyzing wavelet, onto a signal, the analyzed image (Kirby & Swain, 2004; Swain & Kirby, 2006). Wavelets can focus, recognize, and visually sepa-rate the entities detected at different scales (Audet & Mareschal, 2007). Compared to the Fourier transform, wavelet analysis results are more satisfactory (Perrier et al., 1995), for two main reasons. First, the physical extent of the analyzing wavelet can be unambiguously controlled with the scaling parameter; that is, the size
Supporting Information: • Supporting Information S1 • Figure S1 • Figure S2 • Figure S3 • Figure S4 Correspondence to: R. E. Rizzo, rerizzo@abdn.ac.uk Citation:
Rizzo, R. E., Healy, D., Farrell, N. J., & Heap, M. J. (2017). Riding the right wavelet: Quantifying scale transi-tions in fractured rocks. Geophysical Research Letters, 44, 11,808–11,815. https://doi.org/10.1002/2017GL075784
Received 22 SEP 2017 Accepted 10 NOV 2017
Accepted article online 13 NOV 2017 Published online 11 DEC 2017
©2017. The Authors.
This is an open access article under the terms of the Creative Commons Attribution License, which permits use, distribution and reproduction in any medium, provided the original work is properly cited.
Geophysical Research Letters
10.1002/2017GL075784
Figure 1. (a) Two-dimensional Morlet wavelet in the space domain, seen in 3-D perspective. Top image shows the wavelet in the spatial domain, seen in a 3-D perspective. The bottom image shows the wavelet represented as level curves; here the black ellipse is the envelope that contains most of the energy of the wavelet. Representations of the location parameter (b) and of the orientation parameter (𝜃) are also viewed in the Cartesian coordinates (x,y). Wavelet magnitude and length units are dimensionless. (b) Synthetic fracture network used to compare the quality of the two wavelet analyses carried out in this study; inset (red frame) shows a close-up sketch of the simulated network, showing the organization of fractures. A summary of the parameters used to generate the fracture traces can be found in the supporting information (Table T1).
of the wavelet can be adjusted to the scale of the entity under consideration. Second, and critically for our purpose, the analysis can be performed by choosing the wavelet function, which best adapts to the analyzing features (i.e., in our case, the fracture traces). Antoine et al. (2008) argued that the Mexican hat wavelet used by Ouillon et al. (1995) was not the most suitable filter for the purposes of their study; instead, they recom-mended using a Morlet wavelet (Figure 1a) for detecting linear features, such as fracture and fault traces, which would yield a much better precision due to its intrinsic anisotropy. We adopt the suggestion of Antoine et al. (2008) and use a Morlet wavelet to analyze brittle deformation in a faulted sandstone sample, that is, a physi-cal example rather than the synthetic one used in Ouillon et al. (1995). Through this methodology, we aim to understand what controls the transition from distributed small cracks to a single larger rupture plane. To do so, we delineate where and for which crack length this process happens. In a recent study, Vasseur et al. (2017) focus on the role played by interflaw distance as a tool for assessing the time of failure. Our work complements that of Vasseur et al. (2017), focussing on the physical attributes that control localization in a porous gran-ular material (i.e., grain, pores, and cracks), from distributed tensile microcracks to a localized throughgoing shear fracture.
2. Methods: Wavelet Analysis
The aim of the two-dimensional continuous wavelet transform (WT) is to decompose a signal into details of various scales, using a bank of filters, that is, the wavelets, all derived from a single mother function (𝚿). In the context of this study, the analyzed signal is a digital, binary image: a binary distribution of locally cracked or intact material, mathematically described as a function I(x), equal to 1 for pixels representing fracture traces and equal to 0 otherwise. A wavelet coefficient is then defined at each point b, b = (bx, by), of the signal under study:
WΨ(b, a, 𝜃) = a−1
∫ d2x Ψ(a−1r−𝜃(x − b)) I(x) = a ∫ d
2keib⋅k ̂Ψ(ar
−𝜃k)̂s(k), (1)
where𝜃 (r−𝜃 is the rotation matrix) allows us to rotate the analyzing wavelet. The positive real
parame-ter a is the central parameparame-ter; it allows us to dilate (high a) or contract (low a) the wavelet, to analyze the image with either a fine or a coarse resolution (Audet & Mareschal, 2007; Ouillon et al., 1995). The hat sym-bol (right-hand side of equation (1) denotes a Fourier transform, that is a projection of the signal on the analyzing wavelet𝚿, while the bar (left-hand side of the equation) indicates the complex conjugate of the function required to linearize the transform. If𝚿 is well localized in the space domain (x), and in the frequency domain (k), around some value k0≠ 0, it follows that the WT analysis is a local filtering in all four parameters,
tions, which reduces its effectiveness for the detection of directional features. These results are in accordance with Daugman (1983), who showed that no real wavelet (i.e., a Mexican hat) rendered anisotropic by mere stretching in one direction can have a good directional selectivity, no matter how large the anisotropy (𝜖) is taken. These outcomes suggest the use of a wavelet whose transform is more sensitive to the directions of lin-ear features, that is, a two-dimensional Morlet wavelet (Antoine et al., 2008; Kumar, 1995). Here we use a fully anisotropic directional Morlet wavelet, as implemented by Neupauer and Powell (2005) for permeability anal-ysis, which is anisotropic in both its real and imaginary parts and also in its magnitude (details in supporting information Text S2).
4. Wavelet Coefficient Maps
For each analyzing wavelet, obtained when we dilate/contract, rotate, and translate a mother wavelet (Ψ), the signal is transformed into a set of coefficients WΨthrough convolution (Darrozes et al., 1997) (see details
in supporting information Text S3). This set is called the wavelet image and is represented by a coefficient map. A constant signal would produce a null coefficient. On the other hand, if the signal shows “irregularities” (i.e., nonnull pixels), the wavelet reacts producing nonnull coefficients. Weak WΨreflects a poor match, while the strongest coefficients denote optimal correlations between the local signal and the analyzing wavelet. To identify all the organized structures on a binary image, each pixel of the 2-D signal is analyzed using a range of the parameter triplet: b, a,𝜃. Then, the calculated coefficients WΨ(b, a, 𝜃) at each point of the image are
nor-malized with respect to the theoretical maximum values obtained for a perfect match between the wavelet and the analyzed structure. This normalization of the coefficients results in an enhancement of the quality of the coefficient map. From the map obtained by varying the parameters (𝜖, 𝜃, b) at the chosen resolution
a, the maximal wavelet coefficient is selected as the local optimum filter. Consequently, for each resolution
a, the wavelet coefficient maps systematically show the best match in term of scale, location, anisotropy, and orientation (Gaillot et al., 1997). In this way, we determine the most significant features for the selected scale, a. Finally, the corresponding orientations of the selected optimum wavelet coefficients are plotted in a rose diagram. It is worth noting that an analysis in the wavelet vector space shows that a wavelet with semiaxis a identifies structures with a wavelength ∼2.2a (Ouillon et al., 1996). Therefore, for example, set-ting the scale parameter to a = 4 allows us to resolve entities ∼9 (2.2 × 4) pixels in size (Table T1 in the supporting information).
5. Results
We demonstrate the validity of the described analytical technique by the application to a synthetic fracture network—that is, artificially generated with known distribution of orientations and lengths—and then a frac-ture network produced in a rock sample deformed in the laboratory. Specifically, we deployed the synthetic pattern to verify our hypothesis that a Morlet wavelet performs better than a Mexican hat in detecting linear features; we then apply the Morlet wavelet to a real case study.
5.1. Synthetic Fracture Network
Here we analyzed a binary image of a set of synthetic fracture traces with a trimodal size distribution (Figure 1b). The small fracture traces are oriented north-south, corresponding to a position 90∘ from the hori-zontal reference line of the image. Medium and large traces are oriented 55∘ and 110∘, respectively, measured
Geophysical Research Letters
10.1002/2017GL075784
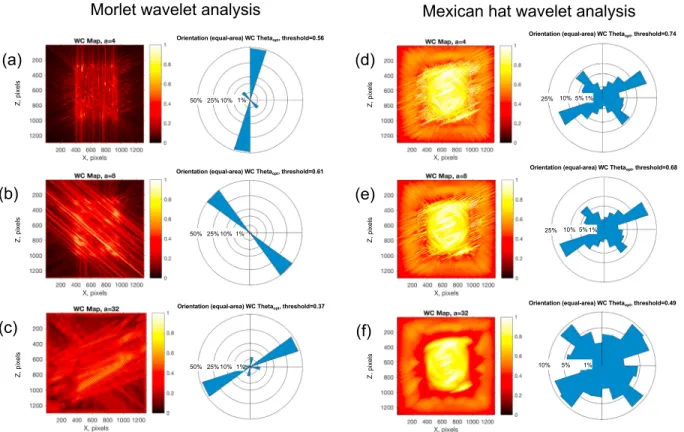
Figure 2. Comparison of the analyses of the synthetic fracture network (Figure 1) performed with the fully anisotropic directional (a–c) Morlet wavelet and the anisotropic (d–f ) Mexican hat wavelet, respectively. Results are integrated over all those anisotropy ratios as maximized by normalization. Morlet wavelet coefficient (WC) maps and relative equal-area rose diagrams obtained with increasing scale parameters,a = 4, 8, and 32; the ability of this wavelet in detecting and discriminating the correct orientations of the different fracture trace sizes is clear (Table T1 in the supporting information for a summary of the parameters used to generate the fracture traces). Mexican hat WC maps and relative rose diagrams; this wavelet, although still able to capture the major features present in the analyzed image, evidently shows a lower resolving power if compared with the Morlet. The orientation transitions from small to large fracture traces are poorly distinguished.
counterclockwise with respect to the former element (Table T1 in the supporting information). Relative to the fracture trace lengths, we have assigned a line width that increases by a factor of 2, starting from the small features with an assigned thickness of 1 pixel. This is done to mimic the behavior of natural fracture networks, where fracture apertures usually increase proportionally to the fracture length (Vermilye & Scholz, 1995). We performed the analysis of this synthetic fracture network using a fully anisotropic directional Morlet wavelet and then an anisotropic Mexican hat wavelet (Figure 2). For both the wavelet types, the analyses are per-formed varying the scaling parameter a as multiple of 2 (a = 2n, n = 1, 2, … , 32) and simultaneously varying the anisotropy ratio𝜖 as multiple of 2 (𝜖 = 2, 4, … , 64). For each couple (a, 𝜖), the azimuth 𝜃 varies from 0∘ to 180∘ by 5∘. We show results for three selected values of scaling parameters, namely, a = 4, 8, 32, which are the resulting maximal wavelet coefficients—that is, best filters—for small, medium, and large synthetic frac-ture traces, respectively. The relative wavelet coefficient (WC) obtained using the Morlet wavelet show that the matches are excellent, as are the related rose diagrams (Figures 2a–2c). Conversely, when the same syn-thetic fracture network is analyzed using the anisotropic Mexican hat, the latter shows less resolving power; it cannot sharply detect and separate the different objects into individual features (Figures 2d–2f ). The Morlet wavelet visibly distinguishes three dominant orientations, corresponding to the three size distributions of the synthetic fracture traces, thus allowing us to detect precisely the orientation scale transition in this data set—that is, the length scale at which fracture orientations change significantly from one dominant trend to another.
5.2. Case Study: Experimentally Produced Fracture Network
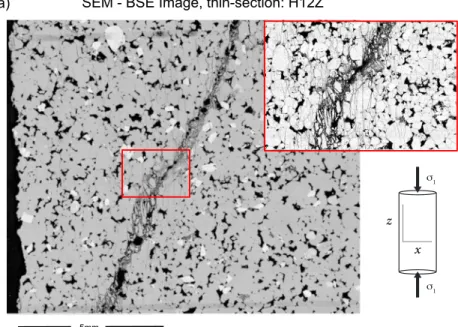
We studied the fracture network on a 2.5 cm × 1.1 cm mosaic of high-resolution scanning electron microscope-backscattered electron (SEM-BSE) digital images from a polished thin section cut parallel to the axis (Figure 3a) of a cylindrical sample of Hopeman Sandstone (20 mm in diameter and 40 mm in length;
Figure 3. (a) Analyzed high-resolution SEM-BSE digital image from a polished thin section cut parallel toXZ
(i.e., parallel to the maximum length) of a Hopeman Sandstone core plug. Experimental conditions: constant strain rate of1 × 10−5s−1; effective pressure of 15 MPa (pore fluid (deionized water) pressure= 10MPa); peak compressive strength was290.8MPa. (b) Fracture network observed on the SEM-image, with associated equal-area rose diagram. Fracture traces are colored based on their lengths using FracPaQ (color bar at the bottom as reference, in pixels) (Healy et al., 2017).
porosity = 0.11; mean grain diameter = 25–400 μm) using the fully anisotropic directional Morlet wavelet. The fracture network was produced by deforming the aforementioned sample until failure (at a constant strain rate of 1 × 10⁻⁵s−1) under triaxial conditions at an effective pressure of 15 MPa (supporting information
Text S4). The binary fracture map was produced by tracing all the visible fractures of the BSE mosaic using a vector graphic editor (i.e., Adobe IllustratorTM) (Figure 3b). The resulting map was embedded in a white square
Geophysical Research Letters
10.1002/2017GL075784
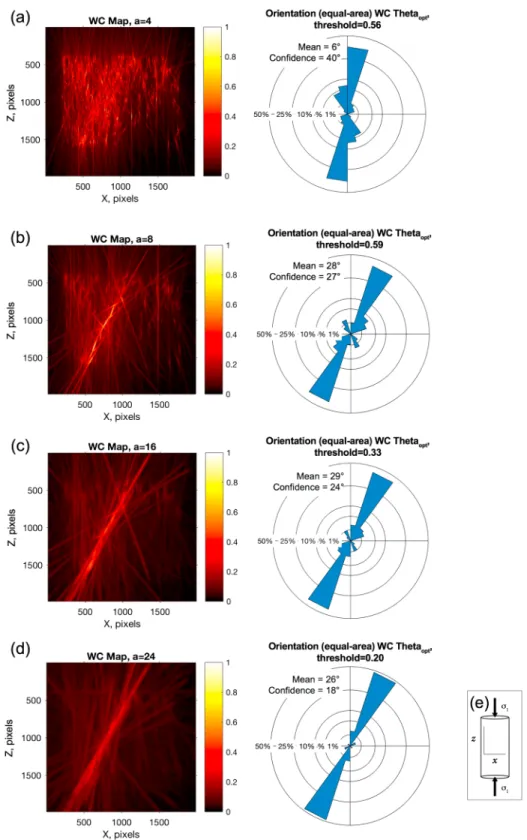
Figure 4. Morlet wavelet analysis applied to the natural fracture network seen in Figure 1c. Parameters used: scale parametera = 2n(n = 1, 2, … , 32); anisotropy𝜖 = 2, 4, … , 64; and azimuth𝜃varies from 0∘to 180∘by 5∘steps. Results are integrated over all those anisotropy ratios as maximized by normalization. The color scale shows the values of the normalized wavelet coefficients. Equal-area rose diagrams of fracture orientations are associated with the wavelet coefficient (WC) maps for each filter resolution. The inset text boxes contain descriptive statistics: mean vector azimuth (mean) and angular confidence interval. (a–d) The orientation transitions from distributed microcracks to localized large-scale fractures are clearly captured with increasing size of the filter. (e) Reference frame—cartoon—for the studied fracture network,𝜎1vertical.
6. Discussion and Conclusions
One of the main achievements of our analysis is that by using a Morlet wavelet, we are able to sharply sep-arate characteristic orientations at different scales of analysis, which would not be captured by only plotting all fracture orientations simultaneously in a single rose diagram (compare Figure 3b and Figures 4a–4d). A complementary outcome arises from the wavelet coefficient maps produced by increasing the scale param-eter. These plots (Figure 4) not only reflect the quality of the match between the analyzing wavelet and the image, but they also map the spatial distribution of the analyzed entities (Gaillot et al., 1997), meaning that we retrieve information on their spatial density distribution for a specific length scale. The results obtained with wavelet coefficient maps can be quantitatively compared to other techniques used for the localization of developing fractures and faults, for example, location and acoustic emissions source types (e.g., Lockner et al., 1991; Reches & Lockner, 1994; Stanchits et al., 2006). Finally, we can interpret the diffuse entities detected at the smallest resolution (a = 4) in the fracture pattern of the deformed Hopeman sandstone sample to be tensile cracks confined to the sandstone grains (intragranular fractures); these sparse microcrack popu-lations are the earliest fractures to develop during the deformation of the sample prior to fault nucleation (Lockner et al., 1992; Stanchits et al., 2006). For lower resolutions (i.e., larger length scales), Figure 4b, the wavelet analysis reveals the critical scale at which microcrack damage accumulates: at this stage, the cracks are dense enough to start interacting, forming an array, which is oblique to the applied𝜎1(reference in
Figure 4e). At the same moment, we observe a clustering of the cracks, displayed by the very good matches between the relatively bigger wavelet and the analyzed entities, and a narrowing of the zone with high wavelet coefficients, corresponding to a higher concentration of fracture in the area where faulting will ini-tiate. The transition between small-scale dispersed and noninteracting microcracks (Figure 4a) to a relatively large scale denser fault-like fracture array (Figures 4b–4d) occurs at a wavelet scale between a = 4 and
a = 8, which is equivalent to 8.8 and 17.4 pixels, respectively. In turn, this range coincides with the measured
average length for intragranular tensile cracks, 0.24 mm (supporting information Figure S4). We interpret this characteristic scale to be the critical crack length needed to achieve significant interactions between fractures at the time of fault nucleation. This coincidence between critical crack length and the grain size sug-gests further research to test whether different rocks with different grain sizes and porosities would display a similar link, or if other factors (e.g., interflaw length; Vasseur et al., 2017) play a predominant role in the failure process.
We have shown that the Morlet wavelet is excellent at detecting directional linear features, that is, the region where the amplitude of the signal is regular along one direction and has a sharp variation along the perpendic-ular direction, because of its inherent anisotropy. When applied to a natural fracture network, the combination of fully anisotropic directional Morlet wavelet and wavelet coefficient maps allowed us to detect the char-acteristic scale orientation and length transitions associated with the shift from distributed damage to the growth of localized macroscopic cracking. When the external stress reaches its critical value (𝜎C), the energy
is latently accumulated until the cracks become long enough (critical length) to interact and transform the system completely in a rapid, abrupt failure process. Morlet wavelet analysis is a powerful tool to quantify the scale at which the phase transition from distributed to localized deformation occurs, which can be eas-ily applied to existing collections of thin sections to extract the critical crack lengths. We only discussed the case of failure in a controlled laboratory setting in this contribution. The next challenge for the application
Geophysical Research Letters
10.1002/2017GL075784
of two-dimensional Morlet wavelet analysis is to find a suitable scaling for the relevant length scales of het-erogeneities controlling broader geophysical phenomena, such as regional-scale fault ruptures and fracture propagation during volcanic activity.References
Alava, M. J., Nukala, P. K. V. V., & Zapperi, S. (2006). Statistical models of fracture. Advances in Physics, 55(3–4), 349–476. https://doi.org/10.1080/00018730300741518
Antoine, J.-P., Carrette, P., Murenzi, R., & Piette, B. (1993). Image analysis with two-dimensional continuous wavelet transform. Signal Processing, 31(3), 241–272. https://doi.org/10.1016/0165-1684(93)90085-O
Antoine, J.-P., Murenzi, R., Vandergheynst, P., & Ali, S. T. (2008). Two-dimensional wavelets and their relatives (2nd ed.). Cambridge, UK: Cambridge University Press.
Arnéodo, A., Argoul, F., Bacry, E., Elezgaray, J., Freysz, E., Grasseau, G., & Pouligny, B. (1992). Wavelet transform of fractals. In A. Arnéodo, et al. (Eds.), Wavelets and Applications (pp. 286–352). Verlag, Berlin: Springer.
Audet, P., & Mareschal, J. C. (2007). Wavelet analysis of the coherence between Bouguer gravity and topography: Application to the elastic thickness anisotropy in the Canadian Shield. Geophysical Journal International, 168(1), 287–298. https://doi.org/10.1111/j.1365-246X.2006.03231.x
Darrozes, J., Gaillot, P., De Saint-Blanquat, M., & Bouchez, J. L. (1997). Software for multi-scale image analysis: The normalized optimized anisotropic wavelet coefficient method. Computers & Geosciences, 23(8), 889–895. https://doi.org/10.1016/S0098-3004(97)00063-0 Daugman, J. G. (1983). Six formal properties of two-dimensional anisotropic visual filters: Structural principles and frequency/orientation
selectivity. IEEE Transactions on Systems, Man, and Cybernetics, SMC-13(5), 882–887. https://doi.org/10.1109/TSMC.1983.6313083 Gaillot, P., Darrozes, J., Saint De Blanquat, M., & Ouillon, G. (1997). The normalised-optimised anisotropic wavelet coefficient (NOAWC)
method: An image processing tool for multi-scale analysis of rock fabric. Geophysical Research Letters, 24(14), 1819–1822. https://doi.org/10.1029/97GL01601
Healy, D., Rizzo, R. E., Cornwell, D. G., Farrell, N. J. C., Watkins, H., Timms, N. E.,…Smith, M. (2017). FracPaQ: A MATLAB toolbox for the quantification of fracture patterns. Journal of Structural Geology, 95, 1–16. https://doi.org/10.1016/j.jsg.2016.12.003.
Kirby, J. F., & Swain, C. J. (2004). Global and local isostatic coherence from the wavelet transform. Geophysical Research Letters, 31, L24608. https://doi.org/10.1029/2004GL021569
Kumar, P. (1995). A wavelet based methodology for scale-space anisotropic analysis. Geophysical Research Letters, 22(20), 2777–2780. https://doi.org/10.1029/95GL02934
Lockner, D. A., Byerlee, J. D., Kuksenko, V., Ponomarev, A., & Sidorin, A. (1991). Quasi-static fault growth and shear fracture energy in granite. Nature, 350(6313), 39–42.
Lockner, D. A., Reches, Z., & Moore, D. (1992). Microcrack interaction leading to shear fracture. In The 33th U.S. Symposium on Rock Mechanics, June, Santa Fe, New Mexico (pp. 807–816).
Neupauer, R. M., & Powell, K. L. (2005). A fully-anisotropic Morlet wavelet to identify dominant orientations in a porous medium. Computers & Geosciences, 31(4), 465–471. https://doi.org/10.1016/j.cageo.2004.10.014
Ouillon, G., Castaing, C., & Sornette, D. (1996). Hierarchical geometry of faulting. Journal of Geophysical Research, 101(B3), 5477. https://doi.org/10.1029/95JB02242
Ouillon, G., Sornette, D., & Castaing, C. (1995). Organisation of joints and faults from 1-cm to 100-km scales revealed by optimized anisotropic wavelet coefficient method and multifractal analysis. Nonlinear Processes in Geophysics, 2, 158–177.
https://doi.org/10.5194/npg-2-158-1995
Perrier, V., Philipovitch, T., & Basdevant, C. (1995). Wavelet spectra compared to Fourier spectra. Journal of Mathematics and Physics, 36(3), 1506–1519.
Reches, Z., & Lockner, D. A. (1994). Nucleation and growth of faults in brittle rocks. Journal of Geophysical Research, 99(B9), 18,159–18,173. https://doi.org/10.1029/94JB00115
Stanchits, S., Vinciguerra, S., & Dresen, G. (2006). Ultrasonic velocities, acoustic emission characteristics and crack damage of basalt and granite. Pure and Applied Geophysics, 163(5–6), 974–993. https://doi.org/10.1007/s00024-006-0059-5
Swain, C. J., & Kirby, J. F. (2006). An effective elastic thickness map of Australia from wavelet transforms of gravity and topography using Forsyth’s method. Geophysical Research Letters, 33, L02314. https://doi.org/10.1029/2005GL025090
Vasseur, J., Wadsworth, F. B., Heap, M. J., Main, I. G., Lavallée, Y., & Dingwell, D. B. (2017). Does an inter-flaw length control the accuracy of rupture forecasting in geological materials?Earth and Planetary Science Letters, 475(2017), 181–189. https://doi.org/10.1016/j.epsl.2017.07.011
Vermilye, J. M., & Scholz, C. H. (1995). Relation between vein length and aperture. Journal of Structural Geology, 17(3), 423–434. https://doi.org/10.1016/0191-8141(94)00058-8
Acknowledgments
We thank Peter Chung at Glasgow for acquiring the SEM-BSE images and Thierry Reuschlé for the maintenance of the triaxial press at Strasbourg. This work forms part of the NERC grant “Anisotropy of permeability” for David Healy (NE/N003063/1), which is gratefully acknowledged. The codes for the wavelet analy-sis used in this study are available on GitHub as a complementary tool in FracPaQ (https://github.com/ DaveHealy-Aberdeen/FracPaQ); the synthetic data and the SEM-BSE image of the thin section are available from the same webpage.