HAL Id: hal-00184479
https://hal.archives-ouvertes.fr/hal-00184479
Submitted on 7 May 2021
HAL is a multi-disciplinary open access
archive for the deposit and dissemination of
sci-entific research documents, whether they are
pub-lished or not. The documents may come from
teaching and research institutions in France or
abroad, or from public or private research centers.
L’archive ouverte pluridisciplinaire HAL, est
destinée au dépôt et à la diffusion de documents
scientifiques de niveau recherche, publiés ou non,
émanant des établissements d’enseignement et de
recherche français ou étrangers, des laboratoires
publics ou privés.
Distributed under a Creative Commons Attribution| 4.0 International License
Balaenoptera physalus blubber with respect to body
heterogeneity and trophic interaction
Diane Ruchonnet, Marc Boutoute, Christophe Guinet, Patrick Mayzaud
To cite this version:
Diane Ruchonnet, Marc Boutoute, Christophe Guinet, Patrick Mayzaud. Fatty acid composition
of Mediterranean fin whale Balaenoptera physalus blubber with respect to body heterogeneity and
trophic interaction. Marine Ecology Progress Series, Inter Research, 2006, 311, pp.165-174.
�hal-00184479�
MARINE ECOLOGY PROGRESS SERIES Mar Ecol Prog Ser
Vol. 311: 165–174, 2006 Published April 13
INTRODUCTION
Fin whales Balaenoptera physalus L. are the largest
marine predator in the Mediterranean Sea, with a sum-mer abundance estimated to be around 3500 individ-uals (Forcada et al. 1996). Each summer, around 900 individuals concentrate in the Northern part of the occidental basin (Gannier 1997, Notarbartolo di Sciara
et al. 2003) to feed on euphausiids (mostly Meganyc-tiphanes norvegica) (Orsi-Relini & Giordano 1992,
Notarbartolo di Sciara et al. 2003).
The biochemical composition of the fin whale blub-ber has been mainly investigated in individuals from the Atlantic Ocean, and no study has been reported for the western Mediterranean Sea. The ventral groove blubber is a fibrous and tough tissue, while the rest of
© Inter-Research 2006 · www.int-res.com *Corresponding author. Email: [email protected]
Fatty acid composition of Mediterranean fin whale
Balaenoptera physalus blubber with respect to
body heterogeneity and trophic interaction
Diane Ruchonnet
1, 3, Marc Boutoute
1, Christophe Guinet
2, Patrick Mayzaud
1,*
1Océanographie Biochimique et Ecologie, LOV, UMR CNRS 7093, Observatoire Océanologique, BP 28,
06230 Villefranche-sur Mer, France
2Centre d’Etudes Biologiques de Chizé, UPR-CNRS 1934, 79360 Villiers-en-Bois, France 3Present address: Environmental Research Institute, Castle Street, Thurso, Caithness KW14 7JD, UK
ABSTRACT: Blubber blocks were collected from both a recently killed (dead whale complete sam-ples; DWCS) and several live (living whale partial samsam-ples; WPS) Mediterranean fin whales Bal-aenoptera physalus and analyzed for their lipid and fatty acid (FA) composition. Mean lipid content
for the different body parts of DWCS samples ranged from 33 to 69% of the wet weight and triacyl-glycerols (TG) represented 80 to 86% of the total lipids; 36 FAs were observed in all blubber layers in greater than trace amounts (> 0.2%). Multivariate correspondence analysis showed that the major variation in FAs structure was related to body position (dorsal versus ventral and lateral) and to a lesser extent to the blubber stratification. Dorsal blubber TG could be distinguished from the other locations by the relative levels of 20:0 and 20:1 FA, whereas polyunsaturated fatty acids (PUFA) were the main descriptors of the lateral and ventral blubber. Stratification resulted in a slight increase in monoenoic fatty acid (MUFA) content from the inner to the outer layers and a decreasing PUFA con-tent. The 6 biopsies from living whales showed a similar FA composition and displayed FA profiles similar to those of the dorsal outer blubber blocks. Comparison of blubber FA structure with fin whales from the North Atlantic showed major differences, with a far lower percentage of 22:1 FA for the Mediterranean individuals and smaller differences in long chain MUFA between the inner and outer layer. Fin whales feed on the euphausiid Meganyctiphanes norvegica. Ligurian Sea M. norvegica appeared to have lower percentages of 20:1 and 22:1 FAs than their North Atlantic
coun-terparts. Hence, the lower percentages of 20:1 and 22:1 FAs in the inner layer could reflect the struc-ture of the prey assimilated. The slightly higher values in the outer layer could reflect the previous fall and winter feeding periods in Atlantic waters. The relative homogeneity of the blubber through-out the body suggested that sampling live animals to describe trophic interactions may be more realistic in the Mediterranean Sea than in the Atlantic.
KEY WORDS: Balaenoptera physalus · Blubber · Fatty acid · Trophic interaction
the body, with the exception of the upper jaw, is less fibrous and more fatty (Ackman et al. 1975a). Lipid content is 8.9 to 36.5% in the anterior ventral groove blubber, and 54.2 to 77.4% in the posterior dorsal blub-ber (Lockyer et al. 1984). This difference has been related to a difference in the blubber function, with the posterior dorsal part representing a fat store for energy reserves (Lockyer et al. 1984).
Vertical stratification within the blubber depth has also been described. Lockyer et al. (1984) reported on blubber cross-sections at one body site, and described it as a macroscopic subdivision in 3 layers: the ‘top layer’ (or ‘outermost layer’), located beneath the skin, the ‘central layer’, comprising the looser fatty tissue in the centre, and the ‘basal layer’ (or ‘innermost layer’), adjacent to the connective tissue between the blubber and the underlying musculature. In previous studies, the top layer exhibited the highest lipid content and was considered to be catabolically more stable. The basal layer, on the other hand, presented the highest protein content. It has been suggested that in the basal layer, fat may be in a state of dynamic equilibrium between storage and catabolic breakdown, whereas the top and central layers may function as long-term energy storage zones (Ackman et al. 1975b).
Dietary fatty acids affect the FAs composition of the blubber lipids of whales and seals, and FA signature of the blubber lipids is to some extent related to the composition and changes in the diet (Ackman et al. 1971, Iverson 1993, Smith et al. 1997). This concept has also been extended to groups other than whales and seals (Reidinger et al. 1985, Rouvinen & Kiiskinen 1989, Pond et al. 1995). In the case of cetaceans, the analysis is classically performed with samples of sub-cutaneous blubber. This type of sample, however, lacks certain information regarding the dietary history of the animals, as vertical stratification occurs in the whale blubber. Indeed, baleen whale blubber lipids consist of triacylglycerols (TG) deposited over time, with the most recent deposits in the innermost layer, close to the muscle boundary (Lockyer et al. 1984). This introduces a source of uncertainly in the signa-ture from prey to predator (e.g. in elephant seals; Best et al. 2003).
The main objectives of the present study were: (1) to establish the variability of Mediterranean fin whale blubber both according to body sector and within a given body sector, in terms of both total lipid content and TG FA composition; (2) to evaluate the degree of FA stratification in fin whale blubber and its relationship with the euphausiid Meganyctiphanes norvegica, the principal element of the
Mediterranean fin whale diet.
MATERIALS AND METHODS
Sampling.Viale (1985) pointed out the impossibility of collecting whale material at will, underlining the fact that results in cetology are always isolated; it is not possible to plan for them and they are not reproducible in detail.
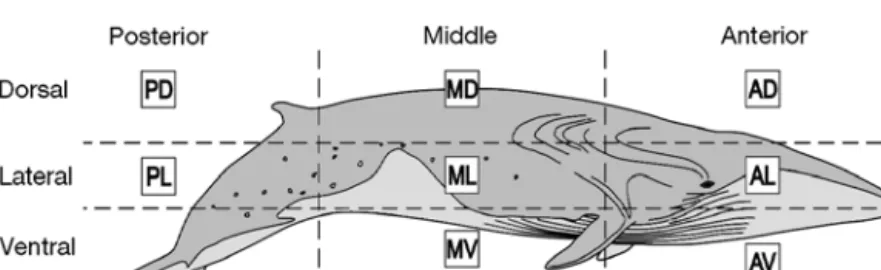
For this reason, blubber blocks were sampled from a recently deceased animal, a 17.80 m length adult male fin whale accidentally killed by a container ship (Fast Trader) in the Mediterranean Sea on October 20, 2000. The animal was examined by veterinarians prior to sampling and it was considered to be in good nutri-tional health, without any signs of pathology (F. Dehr-main, pers. comm.). The samples were collected by the ‘Groupe d’Etude des Cétacés en Méditerranée’ (GECEM) within 10 h of death; 10 blocks of fat tissue of various sizes were collected from positions between the skin layer and the beginning of the muscle layer, and were then wrapped in aluminium foil and frozen at –80°C. The skin was left on each sample to preserve the top/basal orientation (Fig. 1). Note that the anterior lateral section of the whale was only collected from the right side of the dead body, as it was not accessible from the left side. The blubber blocks were referred to as the dead whale complete samples (DWCS).
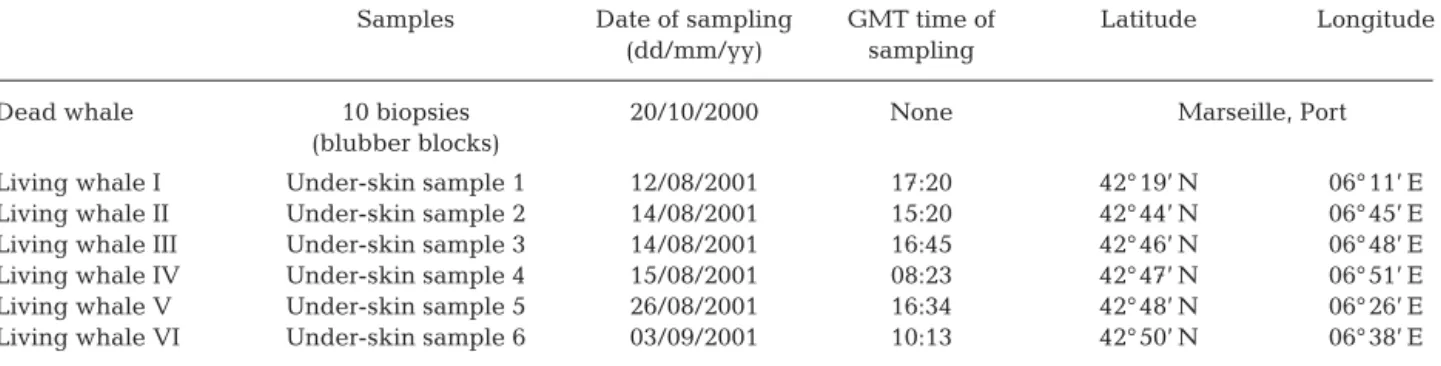
In addition to sampling the dead whale, 6 living Mediterranean fin whales were also sampled in the Ligurian Sea from sailing boats of the ‘Swiss Cetacean Society’ (SCS) during the summer cruise of 2001 (Table 1). Biopsies, 1 from each animal, were extracted from the back of the whales using a compressed air gun containing a ‘punch’ of 2 cm in length and 0.5 cm in diameter. These 6 biopsies were referred to as the living whale partial samples (LWPS).
Lipid extraction and analyses.For each block, the skin was cut off and the remaining blubber was mea-sured (length × width; thickness). The blubber blocks were sliced laterally to subsample the different layers, and the position of each slice within the whole block was calculated from the outer to the inner blubber from the mean thickness of each slice. To avoid oxidation, only the centre of each slice was retained for lipid
Fig. 1. Balaenoptera physalus. Sample code locations on the recently deceased
fin whale. Samples from the lateral sector of the body were taken from the right side of the whale
Ruchonnet et al.: Fatty acid composition of fin whale blubber
extraction. In the case of the biopsies, the extraction was carried out on the whole material (skin removed) according to Bligh & Dyer (1959). The extracted lipids were stored under nitrogen at –80°C.
Lipid classes were quantified in all samples after chromatographic separation coupled with flame ion-ization detection (FID) on an Iatroscan MK-V accord-ing to Ackman (1981). Total lipid extracts were applied to Chromatorods SIII (Chromarod; Iatron Laboratories) using microcapillaries (1 µl), and analyzed in triplicate. Neutral lipids were separated using a double develop-ment procedure with the following solvent systems: n-hexane:benzene:formic acid 80:20:1 (v/v) followed by n-hexane:diethyl ether:formic acid 97:3:1.5 (v/v). Calibration was achieved using commercial standards. TG were isolated by thin layer chromatography (TLC) (Mayzaud et al. 1998).
FA analysis of the TG was achieved on a subset of the 10 blubber blocks of the dead whale. The subset of samples consisted of the dorsal, lateral and ventral por-tions from the middle of the whale body (MD, ML and MV, see Fig. 1). All biopsies collected at sea were also analyzed for TG FA composition. FA methyl esters (FAME) were prepared with 2N KOH in methanol (Christopherson & Glass 1969). Gas liquid chromato-graphy (GLC) of esters was carried out on a 30 m length × 0.32 mm internal diameter quartz capillary column coated with Famewax (Restek) in a Perkin-Elmer XL Autolab gas chromatograph equipped with FID. The column was operated isothermally at 190°C. Helium was used as carrier gas at 7 psig. Injector and detector were maintained at 225 and 250°C, respec-tively. Individual components were tentatively identi-fied by comparing the retention time data with those obtained from authentic and laboratory standards. In addition to the examination of esters as recovered, a part of all ester samples was completely hydrogenated and the products examined qualitatively and quantita-tively by GLC. The results are given to within 2 deci-mal places but this does not represent the level of accuracy. Major components (>10%) are accurate to
± 5%, moderate size components (1 to 9%) to ±10% and minor components to ± 30 to 50%.
Statistical treatment. ANOVA and non-parametric Kruskal-Wallis tests (K-W) were performed using Statgraphics Plus 5.1 software. K-W was used when-ever the variance test suggested significant differ-ences between groups.
The FAs responsible for the variability were deter-mined by performing a correspondence analysis (Lebart et al. 1995). The data matrix consisted of the TG FA distributions from the MD, ML and MV DWCS normalized with arcsine transformation (Zar 1996). The distance between FA profiles was computed with χ2metrics. In brief, the χ2metrics established
symme-try between the variables and the observations, ren-dering a simultaneous representation of both variables and observations. The co-ordinates that best explained the largest variance among samples were used in the analysis. Live biopsies were used in the same analysis as supplementary observations, which are not used in the definition of the factorial axes but are projected in the system of the active variables and observations. Proper interpretation of correspondence analysis does not only require that the proximity between variables and observations is monitored, but also requires that the quality of the representation in the factorial plan considered is correct. Such quality is generally expressed by the cos2index, which illustrates the
dis-tance to the axes. To visualize the quality of represen-tation, the size of the data points is made proportional to the value of cos2within the plan of projection used. Hence large symbols indicate good representation while small symbols indicate that such data is better represented in a different factorial system of axes. Computation was done using SPAD 3.0 software.
Comparisons of FA profiles between samples from LWPS and body part composition from DWCS was performed through cluster analysis using the Bray-Curtis index. The analysis was performed on a subset of the data matrix of the TG FA profiles of the mid-dorsal (MD), -lateral (ML) and -ventral (MV) samples
167
Samples Date of sampling GMT time of Latitude Longitude (dd/mm/yy) sampling
Dead whale 10 biopsies 20/10/2000 None Marseille, Port (blubber blocks)
Living whale I Under-skin sample 1 12/08/2001 17:20 42° 19’ N 06° 11’ E Living whale II Under-skin sample 2 14/08/2001 15:20 42° 44’ N 06° 45’ E Living whale III Under-skin sample 3 14/08/2001 16:45 42° 46’ N 06° 48’ E Living whale IV Under-skin sample 4 15/08/2001 08:23 42° 47’ N 06° 51’ E Living whale V Under-skin sample 5 26/08/2001 16:34 42° 48’ N 06° 26’ E Living whale VI Under-skin sample 6 03/09/2001 10:13 42° 50’ N 06° 38’ E Table 1. Balaenoptera physalus. Sampling characteristics for the 10 blubber blocks of a recently deceased whale and the biopsies
regrouped as outer and middle sections. Distances between clusters were defined using farthest-neigh-bour clustering (Pielou 1984) using arcsine trans-formed data. Computation was done using MVSP (MultiVariate Statistical Program) 3.1 software.
RESULTS
The blubber of the DWCS did not show any macro-scopic heterogeneity that clearly distinguished an outer, a central and an inner blubber layer. However, slight differences in colour were observed from the outermost to the innermost blubber. The outermost blubber was pinkish to whitish, whereas the innermost one was mostly red. The innermost blubber of the blubber block from the MV position of the whale was particularly difficult to slice.
Blubber lipid content of DWCS and LWPS
The mean lipid content recorded for different body sites of the recently deceased whale is presented in Table 2. When all data were combined, i.e. all blub-ber blocks and slices, the ventral position showed a significantly lower lipid content (F2,59 = 12.01, p >
0.0001) with a mean value of 33.4 ± 17% wet weight. The dorsal and lateral sections, with a global mean of 53.2 ± 12.1%, exhibited the highest lipid content and did not show any significant differences between each other (p < 0.05). The position of the different blocks within a given body location (anterior, mid, posterior) showed very few significant differences: the MD blubber showed lower lipid content than the AD and PD samples (F2,13= 4.71, p = 0.029), while no
significant differences could be established for the posterior and anterior dorsal blubber (PD and AD). The MV block showed a straightforward pattern of variation with a maximum lipid content at around
1 cm from the skin and a steady decrease throughout the deeper part of the blubber. The other sites exhib-ited less straightforward patterns. Because of the lack of replication in the analysis, which prevented statis-tical validation of the results, these changes are not detailed here.
The lipid values obtained for the biopsies of the 6 liv-ing whales (i.e. samples I to VI) ranged from 12 to 35% for the first 5, while biopsy VI showed lipid content at around 83% of wet weight. The reason for this high value is unclear. When comparing these values to those of the 10 blubber blocks, none of them appeared to correspond to a particular body sector, even using weighed mean to correct for blubber thickness.
Blubber lipid class and FA composition of DWCS
TG accounted for 80 to 86% of the total lipids in all blubber blocks analyzed. The remaining material was composed of polar lipids, diacylglycerols, sterols and unresolved compounds. No significant differences could be established among the different body sites (p > 0.05).
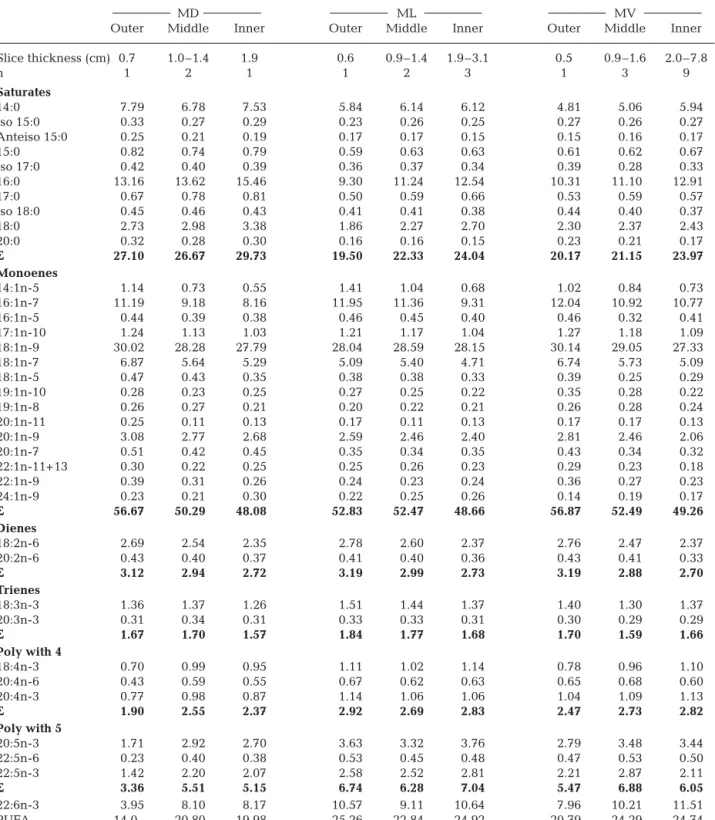
MD, ML and MV were analyzed for FA composition; 36 FAs were always observed in more than trace amounts in the different body sectors. The FA compo-sition of various slices within a given profile were com-bined into 3 groups based on the lipid heterogeneity of the various layers: the outermost layer (0.5 cm), the middle layer (level: 0.9 to 1.4 or 1.6 cm with maximum lipid content) and the inner layer (level: >1.9 cm with decreasing lipid content).
The FA profiles (Table 3) of all 3 body sectors were dominated by MUFAs (monoenoic FAs), with smaller proportions of SFAs (saturated FAs) and PUFAs (polyunsaturated FAs). Comparisons of FA profiles from the innermost to the outermost blubber at each body site indicated a significant increase in MUFA from the innermost to the outermost layers (F21,2= 16.3,
p = 0.0001) and a significant decrease in PUFA (F2, 21=
3.7, p = 0.04). Changes in SFA were not significant (p > 0.05). The same pattern was observed for each body sector considered individually (not shown).
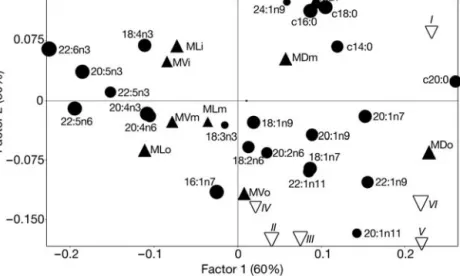
The most abundant FA for all samples was the short-chain MUFA 18:1n-9 (Table 3), followed by both palmitic (16:0) and palmitoleic acids (16:1n-7). Sources of variability in the blubber composition were characterized using factorial correspondence analysis (FCA). The first 2 factorial axes accounted for 91.6% of the total variance. The first axis re-presented the variation between the dorsal portion and the 2 other body portions (Fig. 2), with 20:0, 20:1n-7, 22:1n-9 as main descriptors of the dorsal blubber and the PUFA 22:2n-3, 20:5n-3, 22:5n-6 and
Body site Sample No. Total lipid length (cm) slices (% wet wt) Anterior dorsal (AD) 3.3 6 57.5 ± 11.8 Anterior lateral (AL) 3.4 8 43.5 ± 12.1 Anterior ventral (AV) 3.6 6 33.6 ± 10.1 Mid-dorsal (MD) 1.8 4 39.1 ± 10.2 Mid-lateral (ML) 3.1 6 68.9 ± 1.5 Mid-ventral (MV) 6.6 12 33.3 ± 21.0 Posterior dorsal (PD) 3.1 6 53.4 ± 5.7 Posterior lateral (PL) 6.4 13 57.7 ± 6.9 Table 2. Balaenoptera physalus. Mean total lipid content
(± SD) of the different blubber blocks of a recently deceased whale
Ruchonnet et al.: Fatty acid composition of fin whale blubber
22:5n-3 as main descriptors of the lateral and ventral blubber. For the second axis, accounted for the va-riation between the innermost and the outermost layers in the samples (Fig. 2). The innermost layers
were best represented by the SFA (16:0, 17:0, 18:0 and 14:0) and the monoenoic acid 24:1, while the out-ermost layers were best described by 14:1, 20:1n-11 and 16:1n-7.
169
MD ML MV
Outer Middle Inner Outer Middle Inner Outer Middle Inner Slice thickness (cm) 0.7 1.0–1.4 1.9 0.6 0.9–1.4 1.9–3.1 0.5 0.9–1.6 2.0–7.8 n 1 2 1 1 2 3 1 3 9 Saturates 14:0 7.79 6.78 7.53 5.84 6.14 6.12 4.81 5.06 5.94 Iso 15:0 0.33 0.27 0.29 0.23 0.26 0.25 0.27 0.26 0.27 Anteiso 15:0 0.25 0.21 0.19 0.17 0.17 0.15 0.15 0.16 0.17 15:0 0.82 0.74 0.79 0.59 0.63 0.63 0.61 0.62 0.67 Iso 17:0 0.42 0.40 0.39 0.36 0.37 0.34 0.39 0.28 0.33 16:0 13.16 13.62 15.46 9.30 11.24 12.54 10.31 11.10 12.91 17:0 0.67 0.78 0.81 0.50 0.59 0.66 0.53 0.59 0.57 Iso 18:0 0.45 0.46 0.43 0.41 0.41 0.38 0.44 0.40 0.37 18:0 2.73 2.98 3.38 1.86 2.27 2.70 2.30 2.37 2.43 20:0 0.32 0.28 0.30 0.16 0.16 0.15 0.23 0.21 0.17 ΣΣ 27.10 26.67 29.73 19.50 22.33 24.04 20.17 21.15 23.97 Monoenes 14:1n-5 1.14 0.73 0.55 1.41 1.04 0.68 1.02 0.84 0.73 16:1n-7 11.19 9.18 8.16 11.95 11.36 9.31 12.04 10.92 10.77 16:1n-5 0.44 0.39 0.38 0.46 0.45 0.40 0.46 0.32 0.41 17:1n-10 1.24 1.13 1.03 1.21 1.17 1.04 1.27 1.18 1.09 18:1n-9 30.02 28.28 27.79 28.04 28.59 28.15 30.14 29.05 27.33 18:1n-7 6.87 5.64 5.29 5.09 5.40 4.71 6.74 5.73 5.09 18:1n-5 0.47 0.43 0.35 0.38 0.38 0.33 0.39 0.25 0.29 19:1n-10 0.28 0.23 0.25 0.27 0.25 0.22 0.35 0.28 0.22 19:1n-8 0.26 0.27 0.21 0.20 0.22 0.21 0.26 0.28 0.24 20:1n-11 0.25 0.11 0.13 0.17 0.11 0.13 0.17 0.17 0.13 20:1n-9 3.08 2.77 2.68 2.59 2.46 2.40 2.81 2.46 2.06 20:1n-7 0.51 0.42 0.45 0.35 0.34 0.35 0.43 0.34 0.32 22:1n-11+13 0.30 0.22 0.25 0.25 0.26 0.23 0.29 0.23 0.18 22:1n-9 0.39 0.31 0.26 0.24 0.23 0.24 0.36 0.27 0.23 24:1n-9 0.23 0.21 0.30 0.22 0.25 0.26 0.14 0.19 0.17 ΣΣ 56.67 50.29 48.08 52.83 52.47 48.66 56.87 52.49 49.26 Dienes 18:2n-6 2.69 2.54 2.35 2.78 2.60 2.37 2.76 2.47 2.37 20:2n-6 0.43 0.40 0.37 0.41 0.40 0.36 0.43 0.41 0.33 ΣΣ 3.12 2.94 2.72 3.19 2.99 2.73 3.19 2.88 2.70 Trienes 18:3n-3 1.36 1.37 1.26 1.51 1.44 1.37 1.40 1.30 1.37 20:3n-3 0.31 0.34 0.31 0.33 0.33 0.31 0.30 0.29 0.29 ΣΣ 1.67 1.70 1.57 1.84 1.77 1.68 1.70 1.59 1.66 Poly with 4 18:4n-3 0.70 0.99 0.95 1.11 1.02 1.14 0.78 0.96 1.10 20:4n-6 0.43 0.59 0.55 0.67 0.62 0.63 0.65 0.68 0.60 20:4n-3 0.77 0.98 0.87 1.14 1.06 1.06 1.04 1.09 1.13 ΣΣ 1.90 2.55 2.37 2.92 2.69 2.83 2.47 2.73 2.82 Poly with 5 20:5n-3 1.71 2.92 2.70 3.63 3.32 3.76 2.79 3.48 3.44 22:5n-6 0.23 0.40 0.38 0.53 0.45 0.48 0.47 0.53 0.50 22:5n-3 1.42 2.20 2.07 2.58 2.52 2.81 2.21 2.87 2.11 ΣΣ 3.36 5.51 5.15 6.74 6.28 7.04 5.47 6.88 6.05 22:6n-3 3.95 8.10 8.17 10.57 9.11 10.64 7.96 10.21 11.51 PUFA 14.0 20.80 19.98 25.26 22.84 24.92 20.79 24.29 24.74 Table 3. Balaenoptera physalus. Fatty acid profiles (% total FAs) from mid body samples from a stranded fin whale from the
Ligurian Sea. MD = mid-dorsal, ML = mid-lateral and MV = mid-ventral. Only fatty acids contributing > 0.2% are reported. n: number of slices
Blubber lipid class and FA composition of LWPS
The blubber FA composition of the biopsies from the living whales (Table 4) was relatively similar to the pat-tern recorded for the dead whale. The MUFAs repre-sented 53 to 66% of the total FA, and exceeded the SFA and PUFA. The SFAs were secondarily dominant. Oleic acid (18:1n-9) was the dominant FA, followed by palmitic acid (16:0), palmitoleic acid (16:1n-7), vaccenic acid (18:1n-7), myristic acid
(14:0), DHA (22:6n-3), 20:1n-9, stearic acid (18:0), linoleic acid (18:2n-6), EPA (20:5n-3) and linolenic acid (18:3n-3). Projection of the 6 biopsies as supple-mentary observations into the previous FCA (Fig. 2) showed that all biopsies have dorsal characteristics (positive side of Axis 1) and that while biopsies II to VI have stronger similarities with the outer layer, biopsy I displayed charac-teristics closer to the inner blubber.
Blubber and diet
The main prey item of fin whales in the Ligurian Sea is the euphausiid
Meganyctiphanes norvegica. The aim of
the analysis here was not to identify which prey was responsible for the TG constituent of the blubber, but rather to
evaluate whether or not the pattern of the blubber FAs showed equal proximity to the FA signature of euphausiids from the Ligurian Sea and from the Atlantic Ocean. A comparison of the triglyceride fatty acid composition from animals col-lected in different parts of the Atlantic Ocean and the Ligurian Sea was achieved by factorial correspondence analysis. The first 2 axes accounted for > 60% of the total inertia (Fig. 3). The Ligurian Sea individuals are discrimi-nated on the first factorial axis in opposi-tion the eastern (Nova Scotia) and west-ern Atlantic samples (Kattegat and Clyde Sea). The descriptors responsible for this pattern are the monoenoic acids 16:1n-7, 18:1n-5, 20:1n-11, 20:1n-9, C22:1n-11, 22:1n-9 and 22:1n-7, which appeared deficient in the triglycerides from the Mediterranean krill popula-tions. The contribution of C20 and C22 monoenoic is greatest for the western At-lantic samples (Nova Scotia shelf), inter-mediate for the western Atlantic samples (Kattegat, Clyde Sea) and negative for the Ligurian Sea samples.
DISCUSSION
Comparisons of total lipid content in blubber for indi-viduals from different geographic locations is likely to show large variability. However, some features seem
Fig. 2. Balaenoptera physalus. Correspondence analysis of the middle section
blubber layers. Biplot of the coordinates on the first and second factorial axes of the fatty acids in the samples MD, ML and MV regrouped in outer (o), mid-dle (m) and inner (i) layers. MD: mid-dorsal; ML: mid-lateral; MV: mid-ventral. Live biopsies I to VI were projected as supplementary observations. d: Fatty acid descriptors; m: blubber block from various body location; y: live biopsies. The size of the symbols is proportional to the quality of the
represen-tation on the factorial plan
Fig. 3. Meganyctiphanes norvegica. Correspondence analysis of the fatty acid
composition (n) of the triacylglycerols of the northern krill from western Atlantic (N S1–2: Nova Scotia shelf), eastern atlantic (K 1–4: Kattegat, S 1–4: Clyde Sea), L 1–4: Ligurian Sea. d: location of krill populations. Size of symbols
Ruchonnet et al.: Fatty acid composition of fin whale blubber
relatively constant in the few studies reported thus far. The mean percentage lipid content (per wet weight of tissue) calculated in the present study for the DWCS revealed a non-uniform distribution of fat in the blub-ber. The low values recorded for the ventral sector of the whale and the high fat content observed for the PD and PL sites (53 and 58% of wet weight, respectively) agreed with the observations of Lockyer et al. (1985), who suggested that the tail region of the whale may be a major site for fat storage. Conversely, the value we
report for the MD site is much lower than that indi-cated by Lockyer et al. (1985) (i.e. 39% of wet weight versus 56%), and also much lower than earlier results by Feltmann et al. (1948). The lack of correlation between blubber thickness and blubber fat content observed in our study is also in contradiction with the findings of Lockyer et al. (1985).
In most studies on baleen whales, blubber stratifica-tion has been considered over 1, 2 or at most 3 macro-scopic levels, i.e. the outermost (nearest skin), the cen-tral and the innermost (adjacent to muscle) zones. All studies agree that the outermost zones (top and central) are the chief fat storage areas (Ackman et al. 1975b, Lockyer et al. 1984, Lockyer 1987), as well as being the site that is metabolically stable, as opposed to the ex-tensive fluctuations in fat deposition or depletion in the inner blubber layer (Ackman et al. 1975b). In agree-ment with the findings agree-mentioned above, the total lipid content in our study was heterogeneous throughout the blubber depth. Only the MV site clearly indicated a higher fat content in the outermost layers than in the innermost ones. This result confirms that the ventral blubber section may be linked to feeding processes, rather than being solely associated with passive storage of energy reserves (Ackman et al. 1975b).
As expected for an energy storage tissue like blub-ber, Lockyer et al. (1984) reported TG as the largest constituent of the total lipids (55 to 63%) in adult fin whales. Similarly, Ackman et al. (1968) and Bottino (1978) found that blubber of fin and sei whales was also dominated by TG. In the present study, TG domi-nated in all samples, with percentages ranging from 80 to 86% of wet weight, without significant differences among body sites. Our analysis of the FA constituents of the TG was limited to 3 body sites of the dead whale, i.e. MD, ML and MV, and the 6 biopsies from living whales. The range of FAs found in the blubber samples of the Mediterranean fin whales indicated a higher percentage of PUFA and a lower percentage of MUFA compared to North Atlantic individuals (Ackman et al. 1965, Ackman & Eaton 1966, Lockyer et al. 1984, Lockyer 1987). The pattern of major FAs was relatively similar to that of previous studies, with 16:0 and 14:0 dominating in the SFA group, 18:1n-9, 16:1n-7 and 20:1n-9 accounting for most MUFA, and 22:6n-3, 18:2n-6, 22:5n-3 and 20:5n-3 dominating in the PUFA fraction. The major difference corresponded to a lower content in 22:1 for the Mediterranean individuals (0.4 to 0.6% versus 9 to 18%).
Blubber has 3 primary functions in marine mam-mals: energy storage, insulation and buoyancy (Iver-son 2002). Blubber FAs originate from a variety of processes (Allen 1976, Best 2003). Two different sce-narios of changes in metabolic processes can be pro-posed: (1) FAs are retained and accumulated in the
171 FA profile Saturates 14:0 5.03 ± 0.51 Iso 15:0 0.22 ± 0.03 Antéiso 15:0 0.15 ± 0.01 15:0 0.57 ± 0.04 Iso 17:0 0.32 ± 0.02 16:0 10.72 ± 2.26 17:0 0.64 ± 0.17 Iso 18:0 0.37 ± 0.03 18:0 2.89 ± 1.34 20:0 0.24 ± 0.04 ΣΣ 21.15 ± 4.16 Monoenes 14:1n-5 1.02 ± 0.36 16:1n-7 10.58 ± 2.36 16:1n-5 0.40 ± 0.06 17:1n-10 1.27 ± 0.18 18:1n-9 36.39 ± 2.74 18:1n-7 5.60 ± 0.28 18:1n-5 0.39 ± 0.04 19:1n-10 0.31 ± 0.04 20:1n-11 0.18 ± 0.04 20:1n-9 3.44 ± 0.39 20:1n-7 0.43 ± 0.06 22:1n-11+13 0.27 ± 0.07 22:1n-9 0.32 ± 0.08 24:1n-9 0.23 ± 0.05 ΣΣ 60.82 ± 4.14 Dienes 18:2n-6 2.62 ± 0.23 20:2n-6 0.40 ± 0.04 ΣΣ 3.01 ± 0.25 Trienes 18:3n-3 1.29 ± 0.20 20:3n-3 0.27 ± 0.03 ΣΣ 1.56 ± 0.23 Poly with 4 18:4n-3 0.61 ± 0.13 20:4n-6 0.48 ± 0.15 20:4n-3 0.84 ± 0.13 ΣΣ 1.93 ± 0.27 Poly with 5 20:5n-3 1.88 ± 0.63 22:5n-6 0.34 ± 0.09 22:5n-3 1.91 ± 0.65 ΣΣ 4.13 ± 1.27 22:6n-3 4.93 ± 1.65 Table 4. Fatty acid profile (% total FAs; mean ± SD) from 6
blubber when the animal is in a state of net energy gain and (2) blubber FAs are mobilized and used to provide energy when the animal is in a state of net energy loss. Direct assimilation and accumulation of dietary FA into the blubber has been observed for baleen whales (Ackman & Eaton 1966), but differ-ences between dietary FA and blubber composition, suggesting important reorganization, have also been reported (Ackman et al. 1971, Bottino 1978, Olsen & Grahl-Nielsen 2003).
Our study is based on a single individual, and as such is only a preliminary report on Mediteranean fin whale blubber characteristics. Heterogeneity in the blubber FA composition was related to both body sec-tor and blubber stratification, a general feature in most marine mammals with higher proportion of MUFAs and lower proportion of PUFAs and SFAs in the outer layers of whales (Ackman et al. 1965, Lockyer et al. 1984, Olsen & Grahl-Nielsen 2003) and pinnipeds (Fredheim et al. 1995, Best et al. 2003). However, the dynamics of MUFAs vary, depending on the chain length considered. If short chain MUFAs (up to C18) always increased from the inner layer to the outer, long chain MUFA may show a similar pattern (Ackman et al. 1965, Lockyer et al. 1984) or the opposite pattern in both whales and pinnipeds (Freidheims et al. 1995, Best et al. 2003, Olsen & Grahl-Nielsen 2003). In the Mediterranean Sea, the differences in FA stratification were small in range and also varied with body location. Dorsal differences in SFAs, MUFAs and PUFAs were the largest (respectively 2.6, 8.6 and 6.0%) and lateral differences were the smallest (respectively 4.5, 4.2 and 0%). Irrespective of body location, long chain MUFAs (20:1 and 22:1) showed relatively small differences with respect to blubber stratification but with an obvi-ous trend for higher values in the outer layer.
The low values of 20:1 and 22:1 FAs raised the ques-tion of the nutriques-tional state of the recently deceased male. Lockyer et al. (1985) and Lockyer (1987) sug-gested that blubber thickness and fat content from the posterior ventral section should illustrate body fat con-ditions. In the Atlantic Ocean, male blubber thickness varies from 4 to 8 cm in the ventral sections (Ackman et al. 1975, Lockyer et al. 1984, 1985). Corresponding lipid content (% wet weight) ranges from 25 to 60% in the inner layer and from 40 to 75% in the outer layer (Ackman et al. 1975a) or from 50 to 80% (Lockyer et al. 1984) when whole blubber is considered. The values for the Ligurian Sea fin whale fits quite well with those reported earlier, with a blubber thickness of 5 to 6 cm for the ventral sections with corresponding lipid con-tent ranging from 20% in the inner to 75% in the outer layer. Based on these criteria, the individual sampled appeared to be in a nutritional state similar to that of North Atlantic animals.
The role of blubber stratification in whales remains uncertain. Temperature regulation has been proposed in seals (Fredheim et al. 1995) because of lower MUFA and higher PUFA contents in the inner layers of the blubber. Extreme stratification would lower the melt-ing point of lipid and maintain membrane fluidity close to the limit between muscle and blubber. Ackman et al. (1965) suggested that in seals and whales, metabo-lism (synthesis and/or deposition) is a more likely form of fatty acid regulation. The data for the Ligurian Sea showed that blubber stratification followed the same pattern despite a higher temperature regime (mini-mum 13°C, surface maxi(mini-mum 25°C). The increase in PUFA (essentially 22:6n-3, 22:5n-3, 20:5n-3 and 18:4n-3) between the outer and the inner layer recorded was only slightly smaller than that of the fin whale from the colder North Atlantic waters studied by Ackman & Eaton (1966), and similar to those of the minke whales captured in the North Sea and in Norwegian waters (Olsen & Grahl-Nielsen 2003). If any relationship between thermal regime, body insulation and blubber stratification affects blubber composition, this is not the main controlling factor.
Metabolic processes related to FA deposition and mobilization within the inner layer may also result in enhanced stratification. The inner blubber is the re-gion where FAs are initially deposited and later mobi-lized (Ackman et al. 1975b, Lockyer et al. 1984) and the FA composition is likely in a state of dynamic equi-librium with dietary deposition and reorganization fol-lowing assimilation and transformation in the liver. Conversely, the outer layer is more stable and may integrate over time the excess fat deposited initially at the inner interface. If the high percentages of 20:1 and 22:1 FAs reported for the North Atlantic fin whale sup-port the view that those acids originated from con-version of diet any material or from de novo synthesis from the acetate pool in the liver (Ackman et al. 1965, 1966), our results suggest a different balance between these controlling factors.
The pathways of whale oil synthesis should consider the influence of prey intake in relation to the charac-teristics of Ligurian zooplankton. Studies on Mediter-ranean fin whale feeding habits the Ligurian-Corsi-can-Provençal area, have shown that the euphausiid
Meganyctiphanes norvegica is virtually the sole food
item in this sector of the Mediterranean Sea (Notarbar-tolo di Sciara et al. 2003). Irrespective of season and growth stage, the FA composition of Ligurian Sea krill is characterized by low levels C20 and C22 monoenes (0.1 to 3%), and a dominance of 20:1 over 22:1 FAs (Mayzaud et al. 1999, Virtue et al. 2000), which con-trasts with the composition of North Atlantic popu-lations (Ackman & Eaton 1966). Eastern Atlantic krill showed intermediate percentages of long chain
MU-Ruchonnet et al.: Fatty acid composition of fin whale blubber
FAs (Virtue et al. 2000). Direct deposition of krill lipids in Ligurian Sea whale blubber could only yield an in-ner layer with low percentages of long chain MUFAs, though selectively reorganized to give a composition more species specific with similar levels of 22:1n-9 and 22:1n-11+13, lower levels of 18:1n-9 and higher levels of PUFAs. The extremely low levels of 20:1 and 22:1 FAs alcohols reported for Ligurian Sea copepods (Virtue et al. 2000) confirmed the absence of wax-ester rich Calanus type copepods responsible for the North
Atlantic and Arctic pattern of long chain monoenes. The slightly higher levels of these monoenoic acids in the outer blubber layer could simply be related to the different feeding areas used in summer and winter, as the Ligurian fin whale population overwinters in Span-ish Atlantic waters and returns in spring and summer to the Mediterranean Sea (B. Mate et al. unpubl. data). The biopsies and the dorsal blubber samples sug-gested strong similarities with the outer layer and in one case the inner layer of the DWCS. The increasing use of FAs to investigate diet in high level marine predators raises the question of the validity of the blubber sample used (Best et al. 2003). Sampling free ranging whales re-sults in partial cores which often comprise less than 25% of the entire blubber layer and correspond to the outer and upper middle sections. Hence, the validity of the FA profiles is strongly linked to the degree of stratification. In the Mediterranean Sea, the relative homogeneity of the blubber throughout the body limits the potential bias and justifies the air-gun partial biopsy technique.
In conclusion, our study presents a first insight into the biochemical composition of Mediterranean fin whale blubber. The blubber was relatively homoge-neous in terms of TG FA composition and probably indicates a well fed individual. It also illustrates the the influence of the FA structure of prey-neutral lipids on the degree of conversion by the predator. Hence, prey lacking wax esters are likely limiting the extent of long chain monoenoic acid (20:1 and 22:1) reorganization, which contrasts with the pattern observed in the North Atlantic.
LITERATURE CITED
Ackman RG (1981) Application of flame ionization detectors to thin layer chromatography on coated quartz rods. Methods Enzymol 72:205–252
Ackman RG, Eaton CA (1966) Lipids of the fin whale ( Bal-aenoptera physalus) from North Atlantic waters. III.
Occurrence of eicosenoic and docosenoic fatty acids in the zooplankter Meganyctiphanes norvegica (M. Sars) and
their effect on whale oil composition. Can J Biochem 44: 1561–1566
Ackman RG, Eaton CA, Jangaard PM (1965) Lipids of the fin whale (Balaenoptera physalus) from North Atlantic
waters. I. Fatty acid composition of whole blubber and blubber sections. Can J Biochem 43:1513–1520
Ackman RG, Eaton CA, Hooper SN (1968) Lipids of the fin whale (Balaenoptera physalus) from North Atlantic
waters. IV. Fin whale milk. Can J Biochem 46:197–203 Ackman RG, Eaton CA, Sipos JC, Hooper SN, Castell JD
(1970) Lipids and fatty acids of two species of North Atlantic krill (Meganyctiphanes norvegica and Thysa-noessa inermis) and their role in the aquatic food web.
J Fish Res Board Can 27:513–533
Ackman RG, Hingley JH, Eaton CA, Logan VH, Odense PH (1975a) Layering and tissue composition in the blubber of the Northwest Atlantic sei whale (Balaenoptera borealis).
Can J Zool 53:1340–1344
Ackman RG, Hingley JH, Eaton A, Sipos JC, Mitchell ED (1975b) Blubber fat deposition in mysticeti whales. Can J Zool 53:1332–1339
Allen WV (1976) Biochemical aspects of lipid storage and uti-lization in animals. Am Zool 16:631–647
Best NJ, Bradshaw CJA, Hindell MA, Nichols PD (2003) Ver-tical stratification of fatty acids in the blubber of the south-ern elephant seals (Mirounga leonina): implications for
diet analysis. Comp Biochem Physiol 134B:253–263 Bligh EG, Dyer WJ (1959) A rapid method of total lipid
extrac-tion and purificaextrac-tion. Can J Biochem Physiol 37:911–917 Bottino NR (1978) Lipids of the Antarctic sei whale,
Bal-aenoptera borealis. Lipids 13:18–23
Christopherson SW, Glass RL (1969) Preparation of milk fat methyl esters by alcoholysis in an essentially nonalcoholic solution. J Dairy Sci 52:1289–1290
Feltmann CF, Slijper EJ, Vervoort W (1948) Preliminary researches on the fat-content of meat and bone of blue and fin whales. Proc K Ned Akad Wet Ser C Bid Med Sci 51:604–1316
Forcada J, Aguilar A, Hammond P, Pastor X, Aguila R (1996) Distribution and abundance of fin whales (Balaenoptera physalus) in the western Mediterranean Sea during the
summer. J Zool (Lond) 238:23–34
Fredheim B, Holen S, Ugland KI, Grahl-Nielsen O (1995) Fatty acid composition in blubber, heart and brain from phocid seals. In: Blix AS, Walloc L, Ulltang O (eds) Whales, seals, fish and man. Elsevier, Amsterdam, p 153–168 Gannier A (1997) Estimation du l’abondance estivale de
rorqual commun Balaenoptera physalus (Linné, 1758)
dans le bassin liguro-provençal (Méditerranée occiden-tale). Rev Ecol Terre Vie 52:69–86
Iverson SJ (1993) Milk secretion in marine mammals in rela-tion to foraging; can milk fatty acids predict diets? Symp Zool Soc Lond 66:263–291
Iverson SJ (2002) Blubber. In: Thewissen JGM (ed) Encyclo-pedia of marine mammals. Academic Press, San Diego, CA, p 107–112
Lebart L, Morineau A, Piron M (1995) Statistique exploratoire multidimensionnelle. Dunod, Paris
Lockyer C (1987) Evaluation of the role of fat reserves in rela-tion to the ecology of North Atlantic fin and sei whales. In: Huntley AC, Costa DP, Worthy GAJ, Castellini MA (eds) Approaches to marine mammal energetics. Allen Press, Lawrence, KS, p 183–203
Lockyer CH, McConnell LC, Waters TD (1984) The biochem-ical composition of fin whale blubber. Can J Zool 62: 2553–2562
Lockyer CH, McConnell LC, Waters TD (1985) Body condition in terms of anatomical and biochemical assessment of body fat in North Atlantic fin and sei whales. Can J Zool 63:2328–2338
Mayzaud P, Albessard E, Cuzin-Roudy J (1998) Changes in lipid composition of the Antarctic krill Euphausia superba
in the Indian sector of the Antarctic Ocean. Distribution 173
among organs and sexual maturity stage. Mar Ecol Prog Ser 173:149–162
Mayzaud P, Virtue P, Albessard E (1999) Seasonal changes in the lipid and fatty-acid composition of the euphausiid
Meganyctiphanes norvegica from the Ligurian Sea. Mar
Ecol Prog Ser 186:199–210
Notarbartolo di Sciara G, Zanardelli M, Jahoda M, Panigada S, Airoldi S (2003) The fin whale, Balaenoptera physalus
(L. 1758), in the Mediterranean Sea. Mammal Rev 33: 105–150
Olsen E, Grahl-Nielsen O (2003) Blubber fatty acids of minke whales: stratification, population identification and rela-tion to diet. Mar Biol 142:13–24
Orsi Relini L, Giordano A (1992) Summer feeding of the fin whales, Balaenoptera physalus, in the Liguro-Provençal
Basin. Eur Res Cetac 6:138–141
Pielou EC (1984) The interpretation of ecological data. John Wiley & Sons, New York
Pond CM, Mattacks CA, Gilmour I, Johnston MA, Pillinger CT (1995) Chemical and carbon isotopic composition of fatty acids in adipose tissue as indicators of dietary history
in wild arctic foxes (Alopex lagopus) on Svalbard. J Zool
(Lond) 236:611–623
Reidinger RF, Labows JN, Fellows D, Mason JR (1985) Fatty acid composition of adipose tissue as an indicator of diet: a preliminary assessment. J Wildl Manag 49:170–177 Rouvinen K, Kiiskinen T (1989) Influence of dietary fat source
on the body fat composition of mink (Mustela vison) and
blue fox (Alopex lagopus). Acta Agr Scand 39:279–288
Smith SJ, Iverson SJ, Bowen WD (1997) Fatty acid signatures and classification trees: new tools for investigating the for-aging ecology of seals. Can J Fish Aquat Sci 54:1377–1386 Viale D (1985) Cetaceans in the North-western Mediter-ranean: their place in the ecosystem. Oceanogr Mar Biol Annu Rev 23:491–571
Virtue P, Mayzaud P, Albessard E, Nichols P (2000) Use of fatty acids as dietary indicators in northern krill,
Meganyctiphanes norvegica, from north-eastern Atlantic,
Kattegat, and Mediterranean waters. Can J Fish Aquat Sci 57 (Suppl 3):104–114
Zar JH (1996) Biostatistical analysis, 3rd edn. Prentice-Hall, New York
Editorial responsibility: Otto Kinne (Editor-in-Chief), Oldendorf/Luhe, Germany
Submitted: October 18, 2004; Accepted: September 19, 2005 Proofs received from author(s): February 22, 2006