HAL Id: hal-00302837
https://hal.archives-ouvertes.fr/hal-00302837
Submitted on 31 May 2007HAL is a multi-disciplinary open access
archive for the deposit and dissemination of sci-entific research documents, whether they are pub-lished or not. The documents may come from teaching and research institutions in France or abroad, or from public or private research centers.
L’archive ouverte pluridisciplinaire HAL, est destinée au dépôt et à la diffusion de documents scientifiques de niveau recherche, publiés ou non, émanant des établissements d’enseignement et de recherche français ou étrangers, des laboratoires publics ou privés.
Evidence of gravity waves into the atmosphere during
the March 2006 total solar eclipse
C. S. Zerefos, E. Gerasopoulos, I. Tsagouri, B. Psiloglou, A. Belehaki, T.
Herekakis, A. Bais, S. Kazadzis, C. Eleftheratos, N. Kalivitis, et al.
To cite this version:
C. S. Zerefos, E. Gerasopoulos, I. Tsagouri, B. Psiloglou, A. Belehaki, et al.. Evidence of gravity waves into the atmosphere during the March 2006 total solar eclipse. Atmospheric Chemistry and Physics Discussions, European Geosciences Union, 2007, 7 (3), pp.7603-7624. �hal-00302837�
ACPD
7, 7603–7624, 2007Gravity waves during the March 2006 total
solar eclipse C. S. Zerefos et al. Title Page Abstract Introduction Conclusions References Tables Figures ◭ ◮ ◭ ◮ Back Close Full Screen / Esc
Printer-friendly Version Interactive Discussion
EGU
Atmos. Chem. Phys. Discuss., 7, 7603–7624, 2007 www.atmos-chem-phys-discuss.net/7/7603/2007/ © Author(s) 2007. This work is licensed
under a Creative Commons License.
Atmospheric Chemistry and Physics Discussions
Evidence of gravity waves into the
atmosphere during the March 2006 total
solar eclipse
C. S. Zerefos1,3, E. Gerasopoulos1, I. Tsagouri1, B. Psiloglou1, A. Belehaki1, T. Herekakis1, A. Bais2, S. Kazadzis2, C. Eleftheratos3, N. Kalivitis4, and N. Mihalopoulos4
1
National Observatory of Athens, V. Pavlou & I. Metaxa, P. Penteli, 15236, Athens, Greece
2
Aristotle University of Thessaloniki, Physics Department, Laboratory of Atmospheric Physics, Thessaloniki, Greece
3
Foundation for Biomedical Research, Academy of Athens, Greece
4
University of Crete, Chemistry Department, Environmental and Chemical Processes Laboratory, Crete, Greece
Received: 26 April 2007 – Accepted: 12 May 2007 – Published: 31 May 2007 Correspondence to: C. S. Zerefos (zerefos@geol.uoa.gr)
ACPD
7, 7603–7624, 2007Gravity waves during the March 2006 total
solar eclipse C. S. Zerefos et al. Title Page Abstract Introduction Conclusions References Tables Figures ◭ ◮ ◭ ◮ Back Close Full Screen / Esc
Printer-friendly Version Interactive Discussion
EGU
Abstract
This study aims at testing the hypothesis according to which the movement of the moon’s shadow sweeping the ozone layer at supersonic speed during a solar eclipse creates gravity waves in the atmosphere. An experiment was conducted to study fluc-tuations of the ozone layer, the Ionosonde Total Electron Content (ITEC) and the peak 5
electron density height (hmF2) in the ionosphere, as well as at a number of other pa-rameters before, during and after the total solar eclipse. We found the existence of dominant oscillations with periods ranging between 30–40 min in most of the ters. Cross-spectrum analyses between total ozone and various atmospheric parame-ters resulted to statistically significant square coherences between the observed oscil-10
lations, while the respective phase spectra show that the perturbation originates in the stratosphere and reaches the various layers at speeds around 20 km min−1. Additional evidence supporting these findings was provided by the amplitude of the oscillations in the ionospheric electron density, which increased upwards from 160 to 220 km height.
1 Introduction
15
Gravity waves (GWs) constitute an essential motion component of the atmospheric cir-culation due to their important contribution in the momentum and energy budget and in the wind systems of the atmosphere (Fritts and Alexander, 2003). A varying number of sources are believed to generate GWs at lower levels of the atmosphere including to-pography, convective and frontal activity, wind shear and geostrophic adjustment, while 20
at greater heights their sources include nonlinear wave-wave interactions, auroral cur-rents, ion drag and Joule heating but also the differential heating of the atmosphere at dawn and dusk terminator and during solar eclipses (Fritts and Luo, 1993, and refer-ences therein).
Chimonas and Hines (1970) were the first to suggest that during a solar eclipse 25
ACPD
7, 7603–7624, 2007Gravity waves during the March 2006 total
solar eclipse C. S. Zerefos et al. Title Page Abstract Introduction Conclusions References Tables Figures ◭ ◮ ◭ ◮ Back Close Full Screen / Esc
Printer-friendly Version Interactive Discussion
EGU
moon’s shadow could generate GWs. The source of these waves was initially assumed to be either at higher altitudes e.g. at around 90 km where molecular oxygen heating begins (Chimonas, 1970), or at lower altitudes e.g. water vapor IR absorption (Lamb waves) and the ground cooling (Chimonas and Hines, 1971; Chimonas, 1973). More recently, the disturbance of the heat balance during an eclipse was attributed to the 5
cooling caused by the supersonic travelling of the moon’s shadow on the ozone layer (e.g. Zerefos et al., 2000).
Theoretical approaches to the eclipse induced GWs generation and propagation re-veal a bow wave structure (forward and outward from the eclipse track) with horizontal and vertical scales of 5000–10 000 km and 200 km, respectively, while the wave am-10
plitudes were found to increase dramatically with altitude, due to the density decrease with height (Fritts and Luo, 1993). Concerning the wave periods, Chimonas and Hines (1971) calculated an order of 20 min at 5000 km from the source and about 4 h at more than 10 000 km. However, Fritts and Luo (1993) computed that the dominant period is 2–4 h for distance from the source between 5000 and 10 000 km. Along the path of the 15
eclipse the extra wave energy could tend to be spatially focused leading to interference effects such as amplitude enhancement or additional frequency dispersion, resulting to variable GW characteristics during different eclipses (Chimonas and Hines, 1970).
There have been a number of attempts to detect ground level atmospheric pressure waves resulting from solar eclipses. In only few cases does the balance probability lie 20
in favour of a detection of such waves (Jones, 1999; references therein). Anderson et al. (1972) reported on surface pressure fluctuations from 15–150 min but with larger amplitudes than those predicted by Chimonas (1970). Seykora et al. (1985) reported a surface pressure response with a period of about 4 h and a speed of 320 m s−1. The periods of such waves range from the order of 1 min to 1 h or so, the decay times range 25
from half the wave period upwards, and the ground level amplitude is unlikely to exceed 100 Pa, and is typically far less (Jones, 1999).
A limited number of attempts to detect GW signals on total ozone have been made. Mims and Mims (1993) identified a sequence of 4–5 nearly uniformly spaced
fluctua-ACPD
7, 7603–7624, 2007Gravity waves during the March 2006 total
solar eclipse C. S. Zerefos et al. Title Page Abstract Introduction Conclusions References Tables Figures ◭ ◮ ◭ ◮ Back Close Full Screen / Esc
Printer-friendly Version Interactive Discussion
EGU
tions, however with small periods (4.5–7.2 min), on total ozone series, using a TOPS (Total Ozone Portable Spectrophotometer), but the linkage with eclipse induced GWs appears weak. Zerefos et al. (2000), deploying power spectral analysis on erythemal irradiance, revealed a significant oscillation in the ozone layer with a period of about 20 min.
5
In the ionosphere waves with a period of 10–40 min have been measured at more than 500 km from the zone of totality (Singh et al., 1989), traveling at subsonic (Davis and da Rosa, 1970) or supersonic velocities (Hanuise et al., 1982). Lastly, a source location has been identified in the thermosphere at 170 km altitude, based on the anal-ysis of ionosonde measurements (Liu et al., 1998; Altadill et al., 2001; Sauli et al., 10
2006), while larger periods of about 1 h have also been reported (Altadill et al., 2001). In this work, an attempt to shed light on the generation of GWs during solar eclipses is made, with measurements at the three critical layers in the atmosphere namely the troposphere, the stratosphere and the ionosphere. The main goal is to test the hy-pothesis that the cooling of the ozone layer in the stratosphere by the moon shadow 15
travelling at supersonic speed during the eclipse, constitutes a source of gravity waves propagating both upwards and downwards.
2 Instrumentation and data methods
Ultraviolet direct and global solar spectral measurements were performed at Kastelorizo, Thessaloniki and Athens using Brewer spectroradiometers (MKIII, MKII 20
and MKIV respectively). The characteristics of the instrument and details about their calibration procedures are described in detail by Bais et al. (1996). The three instru-ments followed the same measuring schedule on the eclipse day (29 March) and on the previous day. For this study the operating software of the instrument was modified to allow the alternating measurement (every 30 s) of global and direct spectral irradiance 25
at 6 wavelengths between 302 and 320 nm that are used for measuring total column ozone and columnar SO2. These measurements were performed from 07:30 UTC
ACPD
7, 7603–7624, 2007Gravity waves during the March 2006 total
solar eclipse C. S. Zerefos et al. Title Page Abstract Introduction Conclusions References Tables Figures ◭ ◮ ◭ ◮ Back Close Full Screen / Esc
Printer-friendly Version Interactive Discussion
EGU
until 14:30 UTC. More details are given by Blumthaler et al. (2006) and Kazadzis et al. (2007)1.
The PM10 mass at Finokalia, Crete (35◦20 N, 25◦40 E) was monitored with an Eber-line FH 62 I-R (EberEber-line Instruments GmbH) Particulate Monitor, designed to mea-sure continuously the mass concentration of the suspended particles in ambient air 5
based on β-attenuation (Gerasopoulos et al., 2006a). Filter radiometers (Meteorologie Consult, Germany) were used for continuous measurements of the photo dissociation rates JO1D and JNO2(Gerasopoulos et al., 2006b). Meteorological measurements at Kastelorizo and Finokalia are described by Founda et al. (2007)2.
Ionospheric observations from the National Observatory of Athens Digisonde 10
(http://www.iono.noa.gr) were used for the investigation of the ionospheric response to the solar eclipse of 29 March 2006 over Athens (38◦
00 N, 23◦
30 E). In particular, cal-culations of electron density profiles up to 1000 km, obtained under a vertical incidence ionospheric sounding campaign, were used for the derivation of the peak electron den-sity height, hmF2, and the estimation of the Ionosonde Total Electron Denden-sity, ITEC., 15
(Gerasopoulos et al., 20073). In addition, two data series, the electron densities at fixed ionospheric altitudes zones and the reflection altitude at fixed frequencies of sounding, were also obtained from the electron density profiles. The first enabled us to study the electron density variations as a function of time and altitude, while the second was used, to some extent, for the study of the ionospheric dynamics as a function of time 20
and altitude (Altadill et al., 2001).
1
Kazadzis, S., Bais, A., Kouremeti, N., Blumthaler, M., Webb, A., Kift, R., Schallhart, B., and Kazantzidis, A.: Effects of total solar eclipse of 29 March 2006 on surface radiation, Atmos. Chem. Phys. Discuss., in preparation, 2007.
2
Founda, D., Melas, D., Lykoudis, S., Lysaridis, I., Kouvarakis, G., and Petrakis, M.: The effect of the total solar eclipse of 29 March 2006 on meteorological variables in Greece, Atmos. Chem. Phys. Discuss., in preparation, 2007.
3
Gerasopoulos, E., Zerefos, C. S., Tsagouri, I., et al.: The Total Solar Eclipse of March 2006: Overview, Atmos. Chem. Phys. Discuss., in preparation, 2007.
ACPD
7, 7603–7624, 2007Gravity waves during the March 2006 total
solar eclipse C. S. Zerefos et al. Title Page Abstract Introduction Conclusions References Tables Figures ◭ ◮ ◭ ◮ Back Close Full Screen / Esc
Printer-friendly Version Interactive Discussion
EGU
3 Analysis and results
3.1 Investigation of observed oscillations in various atmospheric layers using Spectral Fourier Analysis
Observations from various atmospheric layers were analyzed deploying Spectral Fourier Analysis, in an effort to investigate the possible detection of GWs propagating 5
in various atmospheric heights. In this study we have used the following parameters: i. total ozone over Kastelorizo, Athens and Thessaloniki, mainly as an index of the disturbance in the stratospheric ozone layer, ii. the Ionosonde Total Electron Content (ITEC) as an indicator for the total ionosheric ionization disturbances, and the peak density height of the F2 layer (hmF2) as a first indicator for the propagation of wave-10
like motions in the ionosphere, iii. ground measurements of temperature and wind speed at Kastelorizo to capture near surface GW signals, and PM10, JO1D and JNO2 at Finokalia to additionally provide the linkage between ground signals and the source of the GWs.
As input data for the spectral analysis, we have used the residual time series of the 15
above parameters. The residuals have been calculated by applying polynomial fitting to the initial time series, to remove the combined effect of the eclipse and the diurnal vari-ability of each parameter. An example of the polynomial removal of the eclipse effect on total ozone at Kastelorizo is shown in Fig. 1a (upper panel), and the resulting residuals (lower panel) are accompanied by a smoothing line for the better visualization of the 20
lower frequency fluctuation. Similarly, the residuals of ITEC, hmF2 and temperature are shown in Figs. 1b and c to represent oscillations at various heights.
During the course of the eclipse, a gradual decrease in total ozone, followed by a symmetric increase after the totality is observed (Fig. 1a). This effect has been re-ported earlier by Zerefos et al. (2000), and it was attributed partly to the limb darkening 25
effect and partly to the increasing influence of direct irradiance by the diffuse radiance entering the field of view of the total ozone instruments. Blumthaler et al., (2006), con-firmed this finding by calculating a correction for total ozone. This correction was found
ACPD
7, 7603–7624, 2007Gravity waves during the March 2006 total
solar eclipse C. S. Zerefos et al. Title Page Abstract Introduction Conclusions References Tables Figures ◭ ◮ ◭ ◮ Back Close Full Screen / Esc
Printer-friendly Version Interactive Discussion
EGU
to be very small (less than 0.01%). Therefore the most possible reason for the reduced total ozone values during the eclipse is the contamination of direct irradiance measure-ments by the diffuse radiation (Kazadzis et al., 2007). For the period between 09:00 and 13:00 UT, the total ozone column was changing on the day before the eclipse from about 335 DU down to about 325 DU, and on the day of the eclipse it was increas-5
ing from about 290 DU to 305 DU. The complete time series of the main parameters used in this study as well as the main effect of the eclipse on the data can be found in Gerasopoulos et al. (2007).
The observational period used for the spectral analyses in the present study was the same for all parameters (10:00–11:52 UTC). The choice was based on simultaneous 10
intervals with clear sky conditions at each site and additional noise during this period was removed by substituting the respective values with zeroes. For all parameters except for the ionospheric, 1 min time resolution data were available. Ionospheric pa-rameters were available with a 4 min time resolution. Because of the short duration of the investigated period, series were appropriately padded prior to the analysis, to allow 15
checking for successive frequencies at smaller increments; the results are shown in Fig. 2 and summarized as follows:
3.1.1 The ozone layer
The power spectrum of total ozone over Kastelorizo reveals a significant oscillation (99% confidence level, not shown) with a period in the range 28–38 min (Fig. 2b). A 20
secondary oscillation is found at periods 12–13 min which approaches the 95% confi-dence level. The peak-to-peak amplitude of the residuals is about 2–3.5% of the total ozone averaged over the same period, and three main oscillations were observed start-ing 30 min after the first contact (Fig. 1a). Cloud development a little before last contact prevented the further capture of the evolution of the waves. The same spectrum is also 25
revealed when 4-min averages are first extracted (not shown). The latter ensures that no bias is imposed on the cross-spectrum between the 4-min averages of total ozone and the ionospheric parameters.
ACPD
7, 7603–7624, 2007Gravity waves during the March 2006 total
solar eclipse C. S. Zerefos et al. Title Page Abstract Introduction Conclusions References Tables Figures ◭ ◮ ◭ ◮ Back Close Full Screen / Esc
Printer-friendly Version Interactive Discussion
EGU
The same process was applied on the total ozone time series at Thessaloniki (not shown). A significant oscillation (95% confidence level) with a period of 28–32 min was found in agreement with the respective finding at Kastelorizo, denoting the spatial extent of the ozone layer perturbation. The amplitude of the residuals was found to be in the order of 3–4% of the total ozone, averaged over the same period. The influence 5
of clouds was much more extended on total ozone over Athens, thus hindering the attribution of fluctuations to GWs. The discussed range of periodicities could not be identified on the previous and next day spectra of the total ozone series over all sites (for the same time interval; not shown).
3.1.2 Ionospheric parameters 10
The power spectra of ITEC and hmF2 are shown in Fig. 2a. Significant oscillations (95% confidence level) in the range 34–43 and 34–38 min are revealed for ITEC and hmF2, respectively. An additional peak is observed on the ITEC spectrum at 18– 20 min. The peak-to-peak amplitude of the ITEC residuals was 10–15% of the ITEC averaged over the eclipse period, while for hmF2 it was about 2%. It is worth to note 15
that this solar eclipse took place under low geomagnetic and magnetospheric activities (Fig. 3), providing clear advantage for the identification of signals from solar eclipse induced GWs in the ionosphere. In particular, the geomagnetic activity remained low, since the Dst index values ranged above −30 nT during the whole week (27–31 March
2006), and the same holds for the magnetosheric activity. Some moderate excursions 20
in AE index (Mayaud, 1980) recorded in very early morning or very late evening hours the days prior to the eclipse day, cannot impose an effect in the ionosphere over Athens at the local time of the eclipse occurrence (Pr ¨olss, 1995). Power spectra were also cal-culated for all “quiet” geomagnetic conditions on days between 27 and 31 March 2006, and no significant fluctuations were found, denoting that the 29 March periodicities 25
ACPD
7, 7603–7624, 2007Gravity waves during the March 2006 total
solar eclipse C. S. Zerefos et al. Title Page Abstract Introduction Conclusions References Tables Figures ◭ ◮ ◭ ◮ Back Close Full Screen / Esc
Printer-friendly Version Interactive Discussion
EGU
3.1.3 Troposphere related parameters
The power spectra of the temperature and wind speed fields at Kastelorizo are shown in Fig. 2d. A significant periodicity (95% confidence level) in the range 28–38 min can be observed in both parameters. The peak-to-peak amplitude of the temperature residuals was about 1% of the temperature averaged over the eclipse period, while the 5
wind speed variations are described in Founda et al. (2007). The wind speed spec-trum shows also a lower frequency periodicity (∼45 min), probably due to interference with meteorological discontinuities. Similar oscillations were found in the spectra of the temperature time series at almost all sites (not shown, see Gerasopoulos et al., 2007, for the measurement sites), however within relatively increased range of the periodici-10
ties and varying statistical significance. This probably has to do with the fact that any fluctuations of the parameters inside the boundary layer (BL) are subject to multiple justifications and increased uncertainty, related to meteorological or other local scale factors, that may well mask the signal imposed by the propagation of GWs down to the surface.
15
The spectra of the total irradiance measured at the ground at Kastelorizo and Fi-nokalia were additionally calculated (not shown). Two main periodicities were identi-fied in both series at 32–37 min and 13–16 min. The oscillations had amplitudes in the range between 6–12% with respect to the average irradiances. The total irradiance, even though measured at the ground, cannot serve itself as an ideal parameter for 20
investigating the influence of GWs in the troposphere. This is because it could subject to fluctuations due to absorption by various atmospheric compounds, or fluctuations of the particulate matter inside the BL either by changes in the wind field or the BL itself, or finally to thin cirrus or other clouds formed after the abrupt cooling of the atmosphere and increase of the relative humidity during the eclipse phenomenon.
25
To overcome the multiple factors that influence the total irradiance, the photolysis rates of the reaction of O3 to O(
1
D), JO1D, and of NO2, JNO2, both measured at Fi-nokalia, were used. JO1D and JNO2 are both sensitive to the total aerosol optical
ACPD
7, 7603–7624, 2007Gravity waves during the March 2006 total
solar eclipse C. S. Zerefos et al. Title Page Abstract Introduction Conclusions References Tables Figures ◭ ◮ ◭ ◮ Back Close Full Screen / Esc
Printer-friendly Version Interactive Discussion
EGU
depth while JO1D is additionally sensitive to the total column O3 (Ruggaber et al., 1994). Moreover, both photolysis rates are affected by aerosol growth with relative hu-midity and by clouds depending on the optical depth of the cloud. The power spectra of the two photolysis rates are presented in Fig. 2c. JO1D shows a very strong periodicity at 32–45 min (99% significance level, not shown). On the other hand, JNO2 spectrum 5
consists of a fluctuation at the same frequency range but with reduced statistical signif-icance (<95%) and a secondary peak at the 13–16 min range (99% signifsignif-icance level). The peak-to-peak amplitude of the JO1D residuals was 7–14% and for JNO2 4–10%. The relatively lower percentage deviation of JNO2 from the average JNO2 compared to that of JO1D, taking also into account the fact that the two measurements are from 10
the same site thus subjected to the same non-GW induced noise (e.g. meteorology), possibly demonstrates columnar ozone perturbation as the most significant source of GWs with periods 30–40 min.
Overall, one main group of oscillations in the range 30–40 min could be identified on the spectra of parameters monitored at various atmospheric levels. These periodicities 15
were in all cases significant at the 95% confidence level. A 15–20 min oscillation was present in almost all spectra even though not always statistically significant. The fact that the second group coincides with the first harmonic of the main oscillation compli-cates the interpretation of this oscillation. According to the initial hypothesis of a source in the stratosphere, a general tendency of increasing periodicities both upwards and 20
downwards is observed in Fig. 2, possibly indicating the gradually attenuated propaga-tion of the waves.
3.2 Linking the GWs occurrence at the different atmospheric layers
3.2.1 Cross Spectrum Analysis
Cross-Spectrum Analysis has been applied between time series of total ozone and 25
other parameters studied. The amplitude of the cross spectra and the phase spec-trum between certain pairs of parameters is shown in Fig. 4. The respective square
ACPD
7, 7603–7624, 2007Gravity waves during the March 2006 total
solar eclipse C. S. Zerefos et al. Title Page Abstract Introduction Conclusions References Tables Figures ◭ ◮ ◭ ◮ Back Close Full Screen / Esc
Printer-friendly Version Interactive Discussion
EGU
coherences are shown in Table 1.
A very distinct covariance between the frequency components corresponding to the 34–38 min periodicity is found in the cross spectra between total ozone, hmF2 and ITEC (Fig. 4a). The respective square coherences are highly significant, 0.99 and 0.88 (Table 1), and the positive sign of the phase spectrum demonstrates that the perturba-5
tion reached the ionosphere at speeds ∼20 km min−1
(Fig. 4a). The cross-spectrum of the temperature and the wind speed with total ozone over Kastelorizo has also revealed strong covariance in the range 28–38 min (Fig. 4b). The positive phase spectrum indi-cates once more that total ozone fluctuations preceded those of the temperature. The respective square coherences of total ozone with temperature and wind speed were 10
0.96 and 0.77 (Table 1). Overall, it is shown that the total ozone oscillations are highly co-varied and preceded those of the ionospheric and the tropospheric parameters and therefore it can be deduced that the oscillations found at the different atmospheric lay-ers were related to perturbations in the ozone layer.
To validate the presence of oscillations on JO1D and JNO2 induced by total ozone 15
and aerosols, cross-spectrum analysis was performed on total ozone vs. JO1D and PM10 vs. JNO2 (Fig. 4c). A strong peak in the cross spectrum between total ozone and JO1D is clearly depicted corresponding to a fluctuation of 32–38 min with square coherence equal to 0.75 (Table 1) and a positive phase shift. A significant covariance is also found at periods 14–17 min, between the aerosol loading at the surface expressed 20
via the PM10 concentration and JNO2, with a square coherence of 0.97; however the phase shift has a negative sign which can be partly explained by the fact that JNO2is affected by the total aerosol in the column while PM10 represents the surface fluctua-tions.
3.2.2 Variation of electron density amplitudes with height 25
Electron density variations at fixed ionospheric altitude zones of 20 km depth were ad-ditionally used to further speculate on the main source of GWs that have reached
iono-ACPD
7, 7603–7624, 2007Gravity waves during the March 2006 total
solar eclipse C. S. Zerefos et al. Title Page Abstract Introduction Conclusions References Tables Figures ◭ ◮ ◭ ◮ Back Close Full Screen / Esc
Printer-friendly Version Interactive Discussion
EGU
spheric heights. Consistent fluctuations with maximum amplitude in the altitude range of 200–220 km were observed during the first phase of the eclipse. Such oscillations were previously reported in the literate and are attributed to solar eclipse induced GWs during or after the solar eclipse (Altadill et al., 2001; Sauli et al., 2006). In this case, the fluctuations were considerably attenuated during the solar reappearance phase. The 5
spectrum analysis (not shown) depicted a dominant periodicity of 15–18 min, coinciding with the higher frequency oscillations in total ozone and ITEC.
The change in the amplitude of these oscillations was used to speculate on the loca-tion of the GWs source responsible for the ionospheric signal. The amplitude of these oscillations was calculated as the difference between successive minima and maxima 10
of the electron densities at the fixed altitude zones. These oscillations were clearly present in the altitude range 140–220 km. However, the 140–160 km zone was not in-cluded in our discussion here in order to keep the E-layer conditions clearly out of the analysis, since the electron concentration is very low and the detection of oscillations is ambiguous. Moreover, no such analysis was performed above 220 km since the main 15
response of the ionosphere to the eclipse was gradually diminished from that height up (Gerasopoulos et al., 2007).
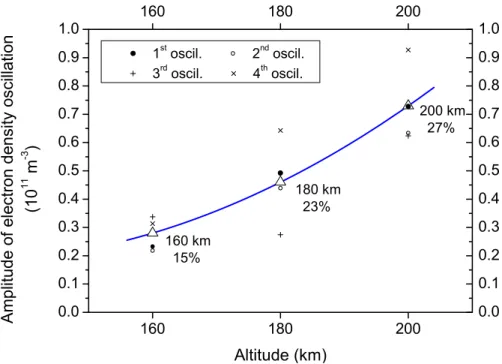
The amplitude of each of the four oscillations that can be identified with relative good precision as well as the average amplitude per altitude is presented in Fig. 5. A tendency of increasing amplitude with altitude is clearly evidenced in both raw and 20
standardized amplitudes, a result consistent with the effect of density decrease with height on the amplitude of a vertically propagating wave (Fritts and Luo, 1993).
In summary, taking into account that the observed oscillations i) are clearly present in the ionospheric height range 140–220 km, ii) are well attenuated above 220 km, iv) they have the same period at each height, iv) they have an important vertical propagation 25
component, with increasing amplitude with height and v) are not of auroral origin, one could argue that they seem to originate from below the studied ionospheric heights. The above characteristics lie in favour of propagating waves attributed to the movement of the cooled spot produced by the moon’s shadow in the ozone layer at heights around
ACPD
7, 7603–7624, 2007Gravity waves during the March 2006 total
solar eclipse C. S. Zerefos et al. Title Page Abstract Introduction Conclusions References Tables Figures ◭ ◮ ◭ ◮ Back Close Full Screen / Esc
Printer-friendly Version Interactive Discussion
EGU
45 km (Sauli et al., 2006) as was the initial hypothesis of this study.
4 Summary
In this paper we have tested the hypothesis that the cooling of the ozone layer in the stratosphere by the supersonic travel of the moon’s shadow during an eclipse con-stitutes a source of gravity waves propagating both upwards and downwards. It is 5
expected that ozone, particularly in the upper stratosphere, where it is in radiative equilibrium, would respond more rapidly to the transient cooling due to the eclipse of the sun. To examine the above mentioned hypothesis, concurrent measurements at three critical layers in the atmosphere namely in the troposphere, in the stratosphere and in the ionosphere, were conducted.
10
Spectral Fourier Analyses revealed the existence of a dominant oscillation of 30– 40 min period in total ozone over Kastelorizo (100% maximum occultation), and this was also found at larger distances with less sun coverage (Thessaloniki, 75% maxi-mum occultation), denoting a spatially extended propagation of the GWs. The same oscillation was also evident in the spectra of the Ionosonde Total Electron Content 15
(ITEC) and the peak electron density height in the ionosphere (hmF2). Cross-spectrum analysis between total ozone and the ionospheric parameters depicted the high covari-ance in the range of 30–40 min, while the phase spectrum provided a first indication that the perturbation reached the ionosphere with a time lag with respect to total ozone corresponding to speeds of about 20 km min−1
. The initial argument that the source of 20
the perturbation originates below the ionosphere was further strengthened by the fact that the amplitude of the electron density oscillation increased upwards from 160 to 220 km.
The identification of the GWs oscillation in the troposphere has been a more diffi-cult task. The spectra of the surface temperature and the wind speed at Kastelorizo 25
revealed oscillations at periods 30–40 min and similar signals were also found in the temperature spectra at almost all sites, however with enhanced dispersion of
frequen-ACPD
7, 7603–7624, 2007Gravity waves during the March 2006 total
solar eclipse C. S. Zerefos et al. Title Page Abstract Introduction Conclusions References Tables Figures ◭ ◮ ◭ ◮ Back Close Full Screen / Esc
Printer-friendly Version Interactive Discussion
EGU
cies. It should be kept in mind that the intensity of the waves downwards could be con-siderably suppressed by the fact that the propagation takes place in a denser mean, and that inside the BL any periodical signal in the parameters subjects to multiple justifications also controlled by meteorological or other local scale factors. The GW induced oscillations in the troposphere were additionally endorsed via the photolysis 5
rates of O3and NO2at Finokalia. JO 1
D measured at the surface, being more sensitive to changes in the total column of ozone, fluctuated with a period of 30–40 min, and its cross-spectrum with total ozone revealed a strong covariance at this range of periods. On the other hand, in the spectrum of JNO2, which mostly follows the changes of the aerosol loading in the column, a periodicity of 15–20 min dominated, in conjunction 10
with a similar ground PM10 oscillation.
Overall, this study has provided evidence supporting a hypothesis put forward about 30 years ago, linking the formation of GWs during a solar eclipse. In particular, it was shown that the supersonic travel of the moon’s shadow during an eclipse cools the ozone layer in the stratosphere, and this cooling can act as a source of GWs. These 15
GWs propagate both upwards to the ionosphere and downwards into the troposphere and the boundary layer, where the GW signals are coupled with meteorological and other local factors.
Acknowledgements. The Dst and AE indices’ records used in this analysis were obtained from the World Data Center for Geomagnetism, Kyoto archives (http://swdcdb.kugi.kyoto-u.ac.jp/).
20
References
Altadill, D., Sole, J. G., and Apostolov, E. M.: Vertical structure of a gravity wave like oscillation in the ionosphere generated by the solar eclipse of 11 August 1999, J. Geophys. Res., 106, 21 419–21 428, 2001.
Anderson, R. C., Keefer, D. R., and Myers, O. E.: Atmospheric pressure and temperature
25
changes during the 7 March 1970 solar eclipse, J. Atmos. Sci., 29, 583–587, 1972.
ACPD
7, 7603–7624, 2007Gravity waves during the March 2006 total
solar eclipse C. S. Zerefos et al. Title Page Abstract Introduction Conclusions References Tables Figures ◭ ◮ ◭ ◮ Back Close Full Screen / Esc
Printer-friendly Version Interactive Discussion
EGU
single monochromator Brewer ozone spectroradiometers, Geophys. Res. Lett., 23, 833–836, 1996.
Blumthaler, M., Bais, A., Webb, A., Kazadzis, S., Kift, R., Kouremeti, N., Schallhart, B., and Kazantzidis, A.: Variations of solar radiation at the Earth’s surface during the total solar eclipse of 29 March 2006, Remote Sensing of Clouds and the Atmosphere XI., edited by:
5
Slusser, J. R., Sch ¨afer, K., and Comer ´on, A., Proceedings of the SPIE, 6362, 2006.
Chimonas, G.: Internal gravity-waves motions induced in the Earth’s atmosphere by a solar eclipse, J. Geophys. Res., 75, 5545–5551, 1970.
Chimonas, G.: Lamb waves generated by the 1970 solar eclipse, Planetary Space Science, 21, 1843–1854, 1973.
10
Chimonas, G. and Hines, C. O.: Atmospheric gravity waves induced by a solar eclipse, J. Geophys. Res., 75, 875, 1970.
Chimonas, G. and Hines, C. O.: Atmospheric gravity waves induced by a solar eclipse, 2, J. Geophys. Res., 76, 7003–7005, 1971.
Davis, M. J. and da Rosa, A. V.: Possible detection of atmospheric gravity waves generated by
15
the solar eclipse, Nature, 226, 1123, 1970.
Fritts, D. C. and Luo, Z.: Gravity wave forcing in the middle atmosphere due to reduced ozone heating during a solar eclipse, J. Geophys. Res., 98, 3011–3021, 1993.
Fritts, D. C. and Alexander, M. J.: Gravity wave dynamics and effects in the middle atmosphere, Rev. Geophys., 41, 1003, doi:10.1029/2001RG000106, 2003.
20
Gerasopoulos, E., Kouvarakis, G., Babasakalis, P., Vrekoussis, M., Putaud, J. P., and Mihalopoulos, N.: Origin and variability of particulate matter (PM10) mass concentrations over the eastern Mediterranean, Atmos. Environ., 40, 4679–4690, doi:10.1016/j.atmosenv.2006.04.020, 2006a.
Gerasopoulos, E., Kouvarakis, G., Vrekoussis, M., Donoussis, C., Kanakidou, M., and
Mi-25
halopoulos, N.: Photochemical ozone production in the Eastern Mediterranean, Atmos. En-viron., 40, 3057–3069, doi:10.1016/j.atmosenv.2005.12.061, 2006b.
Hanuise, C., Broche, P., and Ogubazghi, G.: HF Doppler observations of gravity waves during the 16 February 1980 solar eclipse, J. Atmos. Solar-Terr. Phys., 44, 963–966, 1982.
Jones, B. W.: A search for atmospheric pressure waves from the total solar eclipse of 9 March
30
1997, J. Atmos. Solar-Terr. Phys., 61, 1017–1024, 1999.
Liu, J. Y., Hsiao, C. C., Tsai, L. C., Liu, C. H., Kuo, F. S., Lue, H. Y., and Huang, C. M.: Vertical phase and group velocities of internal gravity waves from ionograms during the solar eclipse
ACPD
7, 7603–7624, 2007Gravity waves during the March 2006 total
solar eclipse C. S. Zerefos et al. Title Page Abstract Introduction Conclusions References Tables Figures ◭ ◮ ◭ ◮ Back Close Full Screen / Esc
Printer-friendly Version Interactive Discussion
EGU
of 24 October 1995, J. Atmos. Solar-Terr. Phys., 60, 1679–1686, 1998.
Mayaud, P. N.: Derivation, Meaning and Use of Geomagnetic Indices, AGU Geophysical Mono-graph, 22, 1980.
Mims III, F. M. and Mims, E. R.: Fluctuations in column ozone during the total solar eclipse of 11 July 1991, Geophys. Res. Lett., 20, 367–370, 1993.
5
Pr ¨olss, G. W.: Ionospheric F-region storms in Handbook of Atmospheric Electrodynamics, Vol-ume II, CRC Press, 195–248, 1995.
Ruggaber, A., Dlugi, R., and Nakajima, T.: Modelling Radiation Quantities and Photolysis Fre-quencies in the Troposphere, J. Atmos. Chem., 18, 171–210, 1994.
Sauli, P., Abry, P., Boska, J., and Duchayne, L.: Wavelet characterization of ionospheric
acous-10
tic and gravity waves occurring during the solar eclipse of 11 August 1999, J. Atmos. Solar-Terr. Phys., 68, 586–598, 2006.
Seykora, E. J., Bhatnagar, A., Jain, R. M., and Streete, J. L.: Evidence of atmospheric gravity waves produced during the 11 June 1983 total solar eclipse, Nature, 313, 124–125, 1985. Singh, L., Tyagi, T. R., Somayajulu, Y. V., Vijayakumar, P. N., Dabas, R. S., Loganadham, B.,
15
Ramakrishna, S., Rama Rao, P. V. S., Dasgupta, A., Naneeth, G., Klobuchar, J. A., and Hartmann, G. K.: A multi-station satellite radio beacon study of ionospheric variations during solar eclipses, J. Atmos. Solar-Terr. Phys., 51, 271–278, 1989.
Zerefos, C. S., Balis, D. S., Meleti, C., Bais, A. F., Tourpali, K., Kourtidis, K., Vanicek, K., Cappellani, F., Kaminski, U., Colombo, T., Stubi, R., Manea, L., Formenti, P., and Andreae,
20
M. O.: Changes in surface solar UV irradiances and total ozone during the solar eclipse of 11 August, 1999, J. Geophys. Res., 105, 26 463–26 473, 2000.
ACPD
7, 7603–7624, 2007Gravity waves during the March 2006 total
solar eclipse C. S. Zerefos et al. Title Page Abstract Introduction Conclusions References Tables Figures ◭ ◮ ◭ ◮ Back Close Full Screen / Esc
Printer-friendly Version Interactive Discussion
EGU Table 1. Square coherence derived from cross spectrum analysis between total ozone and
various atmospheric parameters, for the period ranges 30–40 and 15–20 min.
Range of Depended variabilities PM10vs. periods (min) hmF2 TEC JO1D JNO2 Temp Ws JNO2 Total 30–40 0.99 0.88 0.75 0.68 0.96 0.77 – ozone 15–20 – – – 0.72 0.90 – 0.97
ACPD
7, 7603–7624, 2007Gravity waves during the March 2006 total
solar eclipse C. S. Zerefos et al. Title Page Abstract Introduction Conclusions References Tables Figures ◭ ◮ ◭ ◮ Back Close Full Screen / Esc
Printer-friendly Version Interactive Discussion
EGU Fig. 1. (a) Upper panel: Total ozone over Kastelorizo during the eclipse (open circles) and
second order polynomials fitted on the data (dash red line). Lower panel: The total ozone residuals (blue dots) calculated as the difference between the total ozone time series and the fitted lines. A Savitzky-Golay (2nd order moving polynomial, 10 points) smoothing line is applied on the residuals (continuous red line). (b) Residuals of TEC (blue dots) and hmF2 (red dots) at a 4-min time resolution and (c) residuals of surface temperature at Kastelorizo (blue dots) and the 2nd order S-G smoothing (continuous red line).
ACPD
7, 7603–7624, 2007Gravity waves during the March 2006 total
solar eclipse C. S. Zerefos et al. Title Page Abstract Introduction Conclusions References Tables Figures ◭ ◮ ◭ ◮ Back Close Full Screen / Esc
Printer-friendly Version Interactive Discussion EGU 0 4 8 12 16 20 0 40 80 120 160 100 10 100 10 0 2 4 6 8 10 (d) Period (min) Period (min) T e mp , W s 100 10 0.0 0.2 0.4 0.6 0.8 1.0 1.2 1.4 (c) JN O2 JO 1 D 100 10 0 50 100 150 200 (b) T o ta l O z o n e 100 10 0.0 0.4 0.8 1.2 1.6 h mF 2 T E C (a) 70 50 30 20 7 5 4 3 2 70 50 30 20 7 5 4 3 2
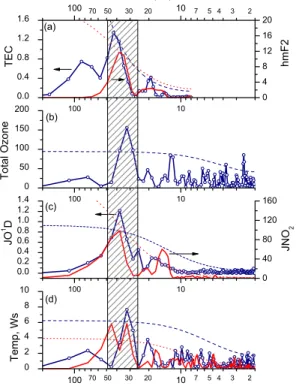
Fig. 2. Power spectrum analysis applied on the residuals of various atmospheric parameters
during the eclipse (10:00–11:52 UTC, 29 March 2006); Y-axes correspond to the spectral es-timates for the following parameters: (a) Ionosonde TEC (blue line + circles) and hmF2 (red line), (b) total ozone at Kastelorizo, (c) JO1D (blue line + circles) and JNO2 (red line) at
Fi-nokalia, (d) temperature (blue line + circles) and wind speed (red line) at Kastelorizo. Similarly colored dash and dot lines represent the 95% confidence limits.
ACPD
7, 7603–7624, 2007Gravity waves during the March 2006 total
solar eclipse C. S. Zerefos et al. Title Page Abstract Introduction Conclusions References Tables Figures ◭ ◮ ◭ ◮ Back Close Full Screen / Esc
Printer-friendly Version Interactive Discussion EGU 0 12 24 36 48 60 72 84 96 108 120 -100 -80 -60 -40 -20 0 20 0 12 24 36 48 60 72 84 96 108 120 0 200 400 600 800 1000 AE
Hours after 27 March 2006 Ecl ipse day D s t
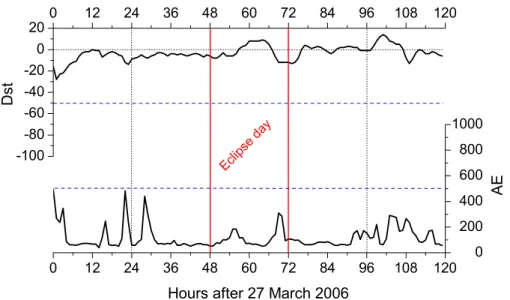
Fig. 3. Hourly records of Dst index (http://swdcdb.kugi.kyoto-u.ac.jp/dstdir/), as indicator of
the geomagnetic activity level (top panel) and of AE index (http://swdcwww.kugi.kyoto-u.ac.jp/
aedir/index.html) indicating the level of the auroral electrojets intensity (bottom panel) for the
time interval 27–31 March 2006. The blue dash lines represent indicative thresholds for the identification of considerable geomagnetic/magnetospheric disturbances.
ACPD
7, 7603–7624, 2007Gravity waves during the March 2006 total
solar eclipse C. S. Zerefos et al. Title Page Abstract Introduction Conclusions References Tables Figures ◭ ◮ ◭ ◮ Back Close Full Screen / Esc
Printer-friendly Version Interactive Discussion
EGU Fig. 4. Cross Spectrum Analysis between various atmospheric parameters during the eclipse;
Y-axes correspond to the amplitude of the cross-spectrum for the following pairs: (a) Total Ozone vs. Ionosonde TEC (blue line + circles) and Total Ozone vs. hmF2 (red line), (b) Total Ozone vs. Temperature (blue line + circles) and Total Ozone vs. Wind Speed (red line), (c) Total Ozone vs. JO1D (blue line + circles) and PM10 vs. JNO2 (red line). Similarly colored
dash and dot lines represent the phase spectrum (internal axis-labels). The phase in panel (a) corresponds to the 4 min data while in the rest of the panels to the 1 min resolution.
ACPD
7, 7603–7624, 2007Gravity waves during the March 2006 total
solar eclipse C. S. Zerefos et al. Title Page Abstract Introduction Conclusions References Tables Figures ◭ ◮ ◭ ◮ Back Close Full Screen / Esc
Printer-friendly Version Interactive Discussion EGU 160 180 200 0.0 0.1 0.2 0.3 0.4 0.5 0.6 0.7 0.8 0.9 1.0 160 180 200 0.0 0.1 0.2 0.3 0.4 0.5 0.6 0.7 0.8 0.9 1.0 200 km 27% 180 km 23% 160 km 15% Amp lit u d e o f e le c tro n d e n si ty o s ci lla ti o n (1 0 1 1 m -3 ) Altitude (km) 1st oscil. 2nd oscil. 3rd oscil. 4th oscil.
Fig. 5. Amplitudes of the electron density oscillations, calculated as the difference between
successive minima and maxima at fixed altitudes (160, 180 and 200 km). Triangles represent the average amplitude of four oscillations at each altitude accompanied by the respective re-gression line (blue line), while each individual oscillation is shown with different symbol (see label). The percentage below the respective altitudes expresses the standardized to the aver-age electron density (between first contact and maximum occultation) amplitude.