Prof. W. A. Rosenblith Dr. N. Y-S. Kiangtt J. G. Krishnayya Prof. M. A. B. Braziert Dr. T. T. Sandeltt R. G. Mark Prof. M. Eden Dr. Eda Berger Vidale P. Mermelstein Prof. M. H. Goldstein, Jr. J. A. Aldrich C. E. Molnartft
Prof. W. T. Peake R. M. Brown Donna A. Molnar
Prof. W. M. Siebert S. K. Burns R. R. Pfeifferttt Dr. J. S. Barlow$ R. R. Capranica Cynthia M. Pyle Dr. A. Cavaggioni-** Eleanor K. Chance D. M. Snodderly, Jr.
W. A. Clarktt R. J. Clayton G. F. Svihula
Dr. B. G. Farleytt A. H. Crist Aurice V. Weiss
Dr. G. L. Gerstein P. R. Gray T. F. Weiss
Dr. Frangois Gr6myfS J. L. Hall II J. R. Welch Dr. E. Giberman"*** F. T. Hambrecht M. L. Wiederhold
Dr. R. D. Hall G. R. Wilde
RESEARCH OBJECTIVES AND SUMMARY OF RESEARCH
Our basic objective is a better understanding of the communication senses. Hearing, in particular, will continue to receive our major attention.
A number of experimental studies are aimed at increasing our knowledge of the neural coding of sensory stimuli. These include: recording from single nerve cells located in the accessory olive of the cat under conditions of binaural stimulation; patterns of single-unit activity in the cochlear nucleus of cat in relation to the sound stimulus and anatomical lo-cation of the unit; unit responses from the lateral geniculate body of the rat to patterns of light and shadow in the visual field. Studies of "ongoing" activity also continue to be of interest. A study of conditioning of the bullfrog's heart rate by sound stimuli is aimed at
determining which sounds get coded into this animal's auditory system and at his behav-ioral responses to natural and unnatural sounds.
In a number of electrophysiological studies we are attempting to correlate neuroelec-tric activity with physiological state. These include: behavioral studies of rats with gross
electrodes recording from locations on and in their sensory pathways; studies of neuro-electric activity recorded from cats in different stages of sleep and wakefulness; studies in unanesthetized cats with brain stem sections of cortical responses to shocks delivered to the sensory pathways; and studies of the olivocochlear bundle.
The development of mathematical models closely related to neurophysiological mech-anisms is a major effort of the group. In this category are the following modeling studies: coding of auditory signals as patterns of neural impulses in the eighth nerve; mechanisms of some features of binaural localization; some limitations on auditory discrimination
This work was supported in part by the National Science Foundation (Grant G-16526); and in part by the National Institutes of Health (Grant MH-04737-0Z).
Visiting Professor in Communication Sciences from the Brain Research Institute, University of California at Los Angeles.
Research Associate in Communication Sciences from the Neurophysiological Labo-ratory of the Neurology Service of the Massachusetts General Hospital.
From the Istituto di Fisiologia, Universit'a di Pisa. "Staff Member, Lincoln Laboratory, M. I. T.
tU(Ma1re de Conferences, Laboratoire de Physique) Visitor from Facult6 de Medecine (Paris).
From the Department of Physics, Weizmann Institute of Science, Israel. tAlso at Massachusetts Eye and Ear Infirmary.
(XXIII. COMMUNICATIONS BIOPHYSICS)
implied by the nature of peripheral coding; and "ongoing" activity of single units.
Psychophysical studies form an important adjunct to the physiological and modeling
work. These include studies of judgments of various binaural patterns, and of
discrimina-bility of noiselike signals.
Considerable instrumentation is involved in our experimental work, in presentation of
stimuli, recording and processing of neuroelectrical signals, and physiological monitoring
of the animals. Design of instruments ranging from telemetering systems to mixer
amplifiers, from real-time correlators to heart-rate meters, from digital devices for
generating precisely controlled sounds to sacks for restraining cats are an important and
indispensible part of our effort.
Close cooperation with the Eaton-Peabody Laboratory of the Massachusetts Eye and
Ear Infirmary and with various groups at Lincoln Laboratory, M. I. T., continues to play
a crucial role in our work.
In particular, we anticipate a number of important
applica-tions for the LINC, a Laboratory Instrument Computer of considerable generality and
utility, developed at Lincoln Laboratory under the leadership of Wesley A. Clark and with
the collaboration of several Lincoln Laboratory staff members, the engineering
assist-ance of Lt. Charles E. Molnar of Air Force Cambridge Research Laboratories, and the
aid of members of the Research Laboratory of Electronics.
M. H. Goldstein, Jr., W. M. Siebert, W. A. Rosenblith
References
1. C. D. Geisler and W. A. Rosenblith, Average responses to clicks recorded
from the human scalp, J. Acoust. Soc. Am. 34 125-127 (1962).
2.
M. H. Goldstein, Jr., L. S. Frishkopf, and C. D. Geisler, Representation of
sounds by responses of single units in the eighth nerve of the bullfrog, J. Acoust. Soc.
Am. 34, 734 (1962).
3.
N. Y-S. Kiang, M. H. Goldstein, Jr., and W. T. Peake, Temporal coding
of neural responses to acoustic stimuli, Trans. IRE, Vol. IT-8, pp. 113-119, 1962.
4.
N. Y-S. Kiang, T. Watanabe, Eleanor C. Thomas, and Louise F. Clark,
Stim-ulus coding in the auditory nervous system and its implications for otology, Trans. Am.
Otol. Soc. 50, 264-283 (1962).
5.
W. T. Peake, M. H. Goldstein, Jr., and N. Y-S. Kiang, Responses of the
auditory nerve to repetitive acoustic stimuli, J. Acoust. Soc. Am. 34, 562-570
(1962).
6.
W. T. Peake, N. Y-S. Kiang, and M. H. Goldstein, Jr., Rate function for
auditory nerve responses to bursts of noise: Effect of changes in stimulus parameters,
J. Acoust. Soc. Am. 34, 571-575 (1962).
7.
M. A. B. Brazier, The analysis of brain waves, Sci. American 206, 142-153
(1962).
8.
M. A. B. Brazier, The problem of periodicity in the electroencephalogram:
Studies in the cat, EEG Clin. Neurophysiol. 14, 943-949 (1962).
9. J. S. Barlow, Simulation of normal and abnormal electroencephalograms,
Quar-terly Progress Report No. 65, Research Laboratory of Electronics, M. I. T., April 15,
1962, pp. 221-228.
10.
S. K. Burns, The electroencephalogram of fraternal twins, S. B. Thesis,
Department of Electrical Engineering, M. I. T., June 1962.
11.
B. G. Farley, Some results of computer simulation of neuron-like nets, Fed.
Proc. 21, 92-96 (1962).
12.
B. G. Farley, Problems in the study of the nervous system, Proceedings of
the 1962 Spring Joint Computer Conference (National Press, Palo Alto, Calif., 1962),
pp. 147-152.
13. B. G. Farley, Some similarities between the behavior of a neural network model and the electrophysiological experiments, Self-Organizing Systems, edited by M. C. Yovits, G. T. Jacobi, and G. D. Goldstein Spartan Books, Washington, D. C.,
1962), pp. 535-550.
14. R. J. Clayton, Cortical activity correlated with behavior in the rat, S. B. Thesis, Department of Electrical Engineering, M. I. T., June 1962.
15. A. K. Ream, EEG correlates of behavioral states in the rat, S. B. Thesis, Department of Electrical Engineering, M. I. T., June 1962.
16. R. W. Rodieck, N. Y-S. Kiang, and G. L. Gerstein, Some quantitative methods for the study of spontaneous activity of single neurons, Biophys. J. 2, 351-368 (1962).
17. G. L. Gerstein, Mathematical models for the all-or-none activity of some neu-rons, Trans. IRE, Vol. IT-8, pp. 137-143, 1962.
18. J. S. Barlow, A phase-comparator model for the diurnal rhythm of emergence of Drosophila, Ann. N.Y. Acad. Sci. 98, Art. 4, pp. 788-805, 1962.
19. M. Eden, Pattern recognition and handwriting, Trans. IRE, Vol. IT-8, pp. 160-166, 1962.
20. W. A. Rosenblith (Ed.), Processing Neuroelectric Data (The M. I. T. Press, Cambridge, Mass., 2d printing, 1962); see pp. ix-xxvii.
21. W. A. Rosenblith, Contribution to discussion on "What Computers Should Be Doing" in Management and the Computer of the Future, edited by M. Greenberger (The M. I. T. Press, Cambrice,TMass., and TohnWiley and Sons, Inc., New York, 1962), pp. 311-315; 320-321.
22. W. A. Rosenblith, Computers and Brains. To be published in the volume based on the Brown University Lecture Series on "Applications of Digital Computers"
(1961-1962).
23. W. A. Rosenblith, Introduction to Symposium on Mathematical Models of Bio-physical Mechanisms, Biophys. J. 2, 99-100 (1962). (Part 2, No. 2, Proc. Symposia, International Biophysics Congress, Stockholm, July 31-August 4, 1961).
A. BINAURAL INTERACTION IN SINGLE UNITS OF THE ACCESSORY SUPERIOR OLIVARY NUCLEUS IN CAT
There has been conjecture as to the physiological mechanisms associated with the 1-3
localization of sounds in space, and a number of models have been proposed. How-ever, there were meager electrophysiological data on the behavior of single units until the work of Galambos, Schwartzkopff, and Rupert,4 and even that study was far from exhaustive. Psychophysical experiments with humans indicate that the difference in time of arrival of the stimuli at the two ears, the difference in intensity of the stimuli at the two ears, and the average intensity (average of intensity at left and right ears expressed in decibels) are all influential in determining the apparent position of a sound source. Also, these experiments indicate that human observers are capable of detecting extremely small interaural time differences (of a few microseconds), and extremely small interaural intensity differences (of a few tenths of a decibel).9
(XXIII. COMMUNICATIONS BIOPHYSICS)
understanding of the neurophysiology of binaural localization, we are investigating the
electrical activity of single nerve cells in the accessory nucleus of the superior olive
in cats under conditions of binaural stimulation. Anatomical and electrophysiological
considerations indicate that this is a reasonable place in which to look. As far as is
known, the accessory nucleus is the most peripheral station in the classical ascending
auditory pathway to receive inputs from both ears.10 Previous electrophysiological
studies have demonstrated the existence of neurons in the accessory nucleus which are
extremely sensitive to small changes in interaural time difference.
4We have recorded
from several hundred cells in the accessory nucleus, giving major attention to the
ques-tion of binaural interacques-tion. A summary of our present results is given here. A model
is suggested which is in agreement with some aspects of binaural localization of sounds
in both cats and humans.
1. Methods
We have used as stimuli clicks presented through earphones. Clicks have the
desir-able feature of being punctate in time. Earphones provide independent control of
inter-aural time and intensity differences, which is not possible with free-field stimulation.
Clicks are produced by applying 100-4sec rectangular voltage pulses to PDR-10
ear-phones.
We have tried several kinds of microelectrodes and have settled on an etched
stainless-steel electrode.
The etching and insulating procedure is essentially the same
as that described by Brown and Tasaki, 11 but we also plate the tip of the electrode, first
with copper and then with platinum black.
An anesthetized (Dial) cat is in a soundproof, electrically shielded chamber. We
position the electrode on the ventral surface of the medulla, using the rack and pinion
controls of a stereotaxic instrument.
The electrode is advanced by means of a hydraulic
micromanipulation system from outside the soundproof chamber. As the electrode is
advanced, we present the cat with a stimulus consisting of clicks at approximately -50 db
rel .tive to 4 volts across the earphones (approximately 50 db relative to visual detection
level of the slow potential observed in the accessory nucleus) with an interaural time
interval of 25 msec and an over-all repetition period of approximately 300 msec. At
the same time, we monitor on an oscilloscope the electrical activity picked up by the
electrode.
The position of the electrode tip relative to the accessory nucleus is determined by
one or more of the following methods: (a) We measure the depth of penetration of the
electrode from the surface.
(b) We measure the position of the electrode relative to
the depth at which the slow-wave potential reverses polarity (see below). (c) In some
cases we have marked the electrode position by passing a current through the electrode,
with subsequent histological control. As far as we have been able to determine, the
nerve cells that exhibit binaural interaction are located in or near the accessory nucleus. We have taken as a measure of unit activity the percentage of stimulus presentations to which the unit responds at least once. We determine this by presenting a given num-ber of stimuli (usually 50) and counting the numnum-ber of stimulus presentations to which
the unit responds. In most of the cases this has been on-line by means of a level dis-criminator and electronic counter. In a few cases we have recorded the responses on magnetic tape.
Z. Results
As the electrode is advanced, we see two distinct kinds of electrical activity. One is what Galambos and his co-workers have termed the "slow-wave" potential4; the other is spike responses from individual nerve cells. The slow-wave potential follows the pattern described by Galambos, and others. Ventromedial to the accessory nucleus, stimulation of the contralateral ear evokes a negative-going slow wave, and stimulation of the ipsilateral ear evokes a positive-going slow wave. Dorsolateral to the accessory nucleus, the polarities are reversed. While this slow wave may, in some sense, rep-resent the excitation for cells in the accessory nucleus, we have not attempted to study in detail the interaction between slow wave and unit activity. We have been interested in the slow wave only insofar as it provides an indication of the position of the electrode relative to the accessory nucleus.
We have observed firing patterns of cells showing many sorts of binaural interaction. We shall mention briefly two kinds of interaction. Some cells show summation, in that
1.0 -- 1 .0 RIGHT L - 77 db ONLY R - 77db LEFT ONLY -0.5 .5 30-1 LEFT -80 -70 -60 -10 -8 -6 -4 -2 0 2 4 6 8 10
INTENSITY (db) RIGHT T LR(MSEC) LEFT
LEADING LEADING
(a) (b)
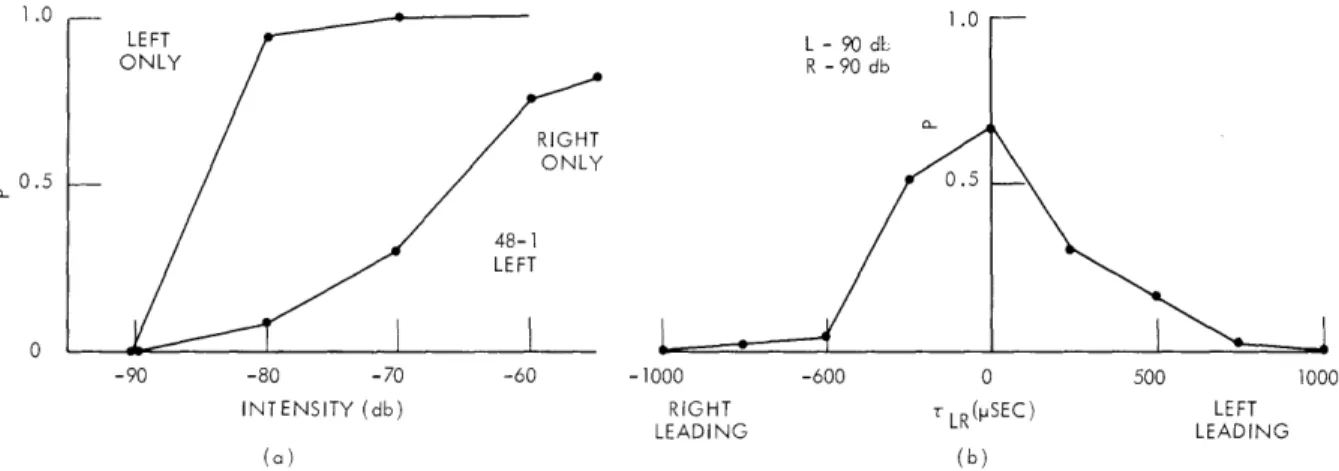
Fig. XXIII-1. Cell showing summation of stimuli to two ears. (a) Monaural intensity series. (b) Effect of interaural time difference. P is relative frequency of firing measured over 50 stimulus pres-entations at a rate of ~3 per second; TLR is time difference between clicks in left and right ears.
(XXIII. COMMUNICATIONS BIOPHYSICS)
if the stimuli are presented simultaneously to the two ears they respond more than they respond to stimulation of either ear alone. This summation may extend over several milliseconds, as shown in Fig. XXIII-1, or over a few hundred microseconds, as in Fig. XXIII-2. This property has been observed in approximately 20 cells.
Other cells have the cyclic behavior shown in Fig. XXIII-3. As the interval between the clicks to the two ears is varied, the unit shows several successive peaks of excit-ability. We have seen three such cells, all with a time between adjacent peaks of approximately 1 msec.
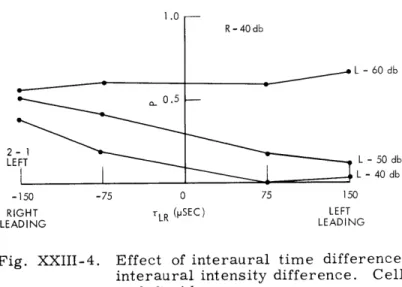
The group of cells in which we are most interested shows the properties summarized in Fig. XXIII-4. These cells respond to monaural stimulation of the contralateral ear,
L - 90 dL R - 90 db 1.0 r 0.5 -90 -80 -70 INTENSITY (db) (a)
Fig. XXIII-2.
-60 -1000 RIGHT LEADING -600~I
0 r LR(SEC) (b) 1000 LEFT LEADINGCell showing summation of stimuli to two ears. (a) Monaural
intensity series. (b) Effect of interaural time difference.RIGHT ONLY ONLY 42-3 RIGHT -90 -80 INTENSITY (db) (a) -1.5 RIGHT LEADING -1.0 -0.5 0 r LR(MSEC) (b) 0.5 1.0 1.5 LEFT LEADING
Fig. XXIII-3.
Cell showing cyclic interaction of stimuli to two ears.
(a) Monaural
intensity series. (b) Effect of interaural time difference.1 .0
1.0 -R-40db L - 60 db LEFT L - 50 db
I
L -40db -150 -75 0 75 150RIGHT rLR (pSEC) LEFT
LEADING LEADING
Fig. XXIII-4. Effect of interaural time difference, interaural intensity difference. Cell on left side.
but not to monaural stimulation of the ipsilateral ear. For all of these cells, the percentage of stimulus presentations to which the unit responds can be decreased either by making the stimulus to the ipsilateral ear more intense while holding interaural time difference constant or by making the stimulus to the ipsilateral ear arrive earlier
while holding interaural intensity difference constant.
There is a striking parallel between the properties of cells of the type shown in Fig. XXIII-4 and results of psychophysical experimentation in humans. The respon-siveness of these cells (we have recorded from approximately 50 of them) is a function of interaural time difference, interaural intensity difference, and average intensity. These parameters are also involved in determining the apparent location of a sound source with humans. This parallel of physiological and psychophysical data has led us to suggest the following model for the process of binaural localization: Binaural stimuli excite cells in the left and right accessory nuclei. If the stimulus at the left ear is more intense or arrives earlier than that at the right, more cells will be excited in the right accessory nucleus, and vice versa. Because of the sensitivity of these cells to both interaural time and intensity difference, time and intensity differences can be made to offset each other at the level of the individual cell. The psychophysical judgment of sidedness comes about as a result of any imbalance of the number of cells excited at the left and right accessory nuclei. This schema is similar to one proposed recently by van Bergeijk, 3 and, as pointed out by van Bergeijk, it has a great deal in common with a model proposed in 1930 by von B6k6sy.1 A simplified diagrammatic representation of our model is shown in Fig. XXIII-5.
In our model we assume that each cell that we observe is representative of a popu-lation of cells, and that the system is symmetrical; that is, there are similar popula-tions of cells in the left and right accessory nuclei. Although we are restricted to
LEFT EAR
Fig. XXIII-5.
Cells in both left and right accessory nuclei are innervated by
excitatory inputs from the contralateral ear and inhibitory inputs
from the ipsilateral ear. Ascending fibers from both accessory
nuclei go to hypothetical "higher centers." The psychophysical
judgment of sidedness is related to the relative number of cells
responding at the two sides.
The two solid cells are intended to
indicate that the system is symmetrical, that is, in the model
each cell on one side has its counterpart on the other.
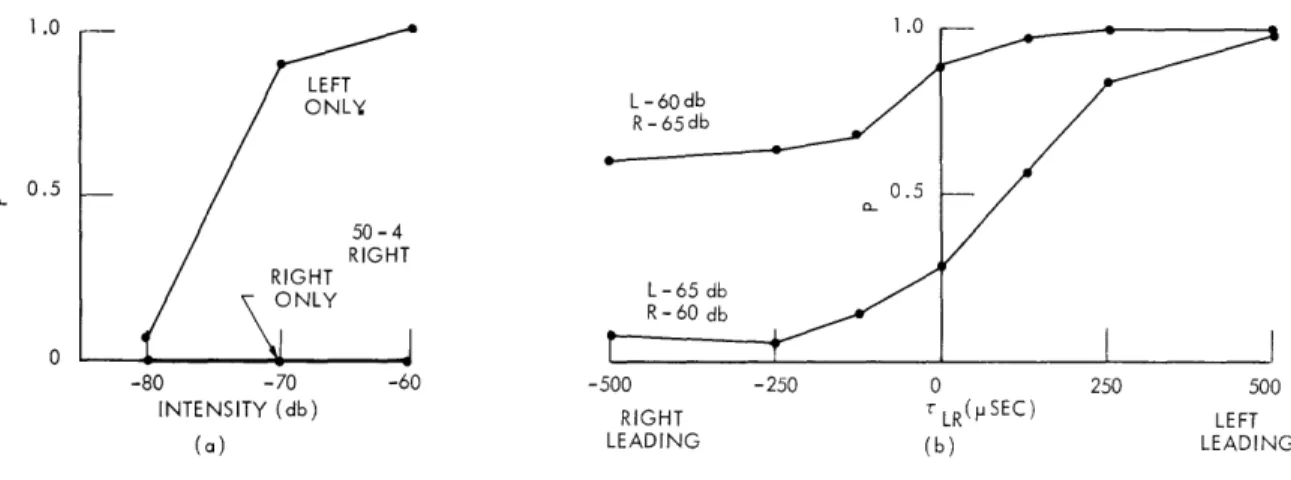
-80 -70 INTENSITY (db) (a) -500 RIGHT LEADING -250 0 250 SLR(pSEC) (b) 500 LEFT LEADING
Fig. XXIII-6.
(a) Monaural intensity series. (b) Effect of
interaural time difference and interaural
intensity difference.
Cell on right side.
observing cells on only one side at a time, we can infer the behavior of corresponding cells on the opposite side by this assumption. A typical example is shown in
Fig. XXIII-6. This cell was situated on the right-hand side of the cat. We observed the activity of the cell over a range of interaural time differences from plus to minus
500 lsec, where positive numbers indicate that the stimulus to the left ear is leading,
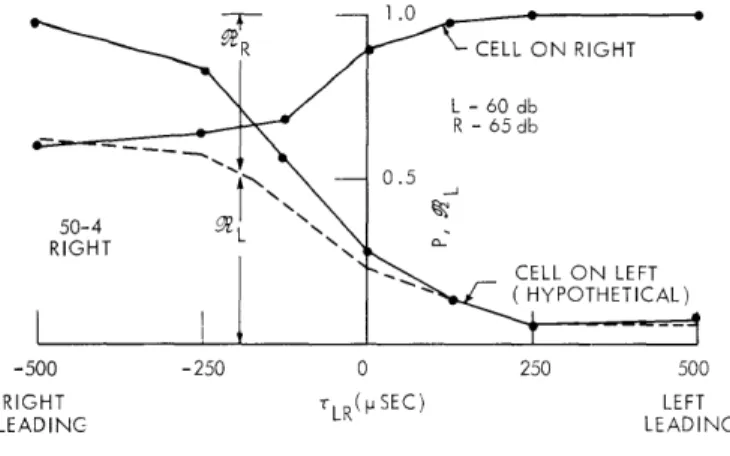
and negative numbers indicate that the stimulus to the right ear is leading. Two inten-sity conditions are illustrated: left -60 db, right -65 db; and left -65 db, right -60 db. In order to infer the behavior of a hypothetical symmetrical cell on the left side, we interchange "left" and "right," both for time difference and for intensity difference, for one of these two curves. The resulting plot for the condition left -60 db, right -65 db is shown in Fig. XXIII-7.
For purposes of the model, we are interested in the relative number of cells firing at the two sides. We have taken as a measure of this L = PL/(PL+PR)' where PR is the probability that the cell on the right will fire to a given stimulus presentation, and PL is the probability that the hypothetical cell on the left will fire to a given stimulus presentation. This measure is bounded between 0 (corresponding to activity on the right and no activity on the left) and 1 (corresponding to activity on the left and no activity on the right), and is symmetrical about 0. 5. That is, since A = 1 - , where
= PR/(P L +PR), the curve of R is the curve of 6L reflected about the 0. 5 level. If we had a homogeneous population of cells, we would be able to generalize directly from the behavior of a single cell to the total number of cells responding. Although we do not have a homogeneous population, it is still possible to set bounds on over-all activ-ity from our data. As an example, consider the situation in which the stimulus to the left ear is more intense than the stimulus to the right ear, and the two stimuli are
1.0 .R 1 CELL ON RIGHT L - 60 db R - 65 db " -- 0.5 50-4 L RIGHT \ CELL ON LEFT (HYPOTHETICAL) -500 -250 0 250 500
RIGHT rLR(p SEC) LEFT
LEADING LEADING
Fig. XXIII-7. Same cell as in Fig. XXIII-6, with "left" and "right" interchanged for original condition (left, -65 db; right, -60 db). Dashed line shows PL/(PL+PR) :
(XXIII. COMMUNICATIONS BIOPHYSICS)
presented simultaneously. While 1L is not necessarily the same for any two cells,
6
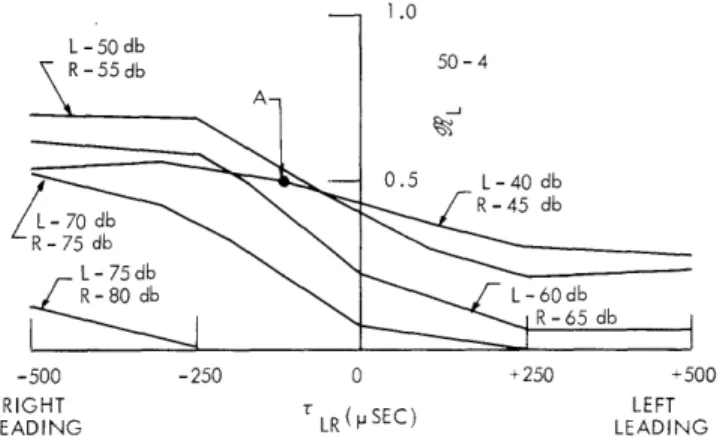
is less than 0. 5 for all cells that we have observed. Therefore we are justified in saying that, on the average, more cells respond to this particular stimulus configuration in the right population than in the left population.Figure XXIII-8 summarizes the behavior of a typical cell. In this plot, L is shown on the ordinate and interaural time difference is shown on the abscissa. Interaural intensity difference is held constant at 5 db, and average intensity is the parameter. Keeping in mind that (a) the data are from cats and (b) the model is highly simplified, we can compare predictions of the model and psychophysical results from humans. The effects of interaural time and interaural intensity difference are in qualitative agree-ment. With zero interaural time difference and the stimulus to the left ear more intense, we have 0 < 6 < 0. 5, corresponding to "image to the left." If interaural intensity dif-ference and average intensity are held constant and the stimulus to the left ear is made to arrive earlier,
61
decreases, corresponding to movement of the image to the left.Interaural time difference can offset the effect of interaural intensity difference for individual cells in terms of the model, just as it can in human centering experiments.5' 6 At point A in Fig. XXIII-8, for example, the stimulus to the left ear is 5 db more intense but lags the stimulus to the right ear by 120
psec,
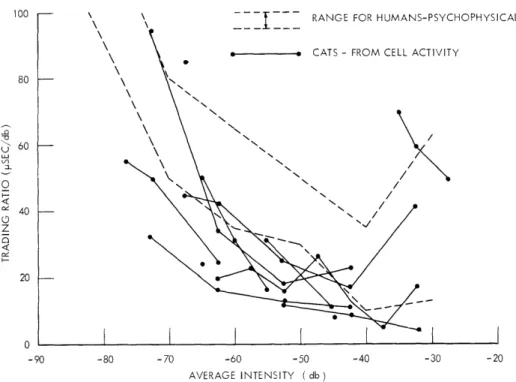
and 6L = 0. 5, corresponding to equal firing probabilities at the two sides. In this sense an interaural intensity difference can be said to be "equivalent" to an interaural time difference, and we can define a time-intensity trading ratio in microseconds per decibel. The time-intensity trading ratio for point A would be 120 tsec per 5 db, or 24 Isec per db.In Fig. XXIII-9, this time-intensity trading ratio is plotted as a function of average intensity for 12 cells that we have observed. The dashed lines indicate the range of time-intensity trading ratios obtained from human subjects presented with clicks with
1.0 L-50 db R - 5 5 d b 50-4 - 0.5 L- 40 db
L
7 db
b
R- 75db R -80 db L -60db R-65 db -500 -250 0 +250 +500 RIGHT r LEFTLEADING LR ( SEC) LEADING
Fig. XXIII-8. Effect of interaural time difference and average intensity on
61.
Interaural intensity difference, 5 db.80
-90 -80 -70 -60 -50
AVERAGE INTENSITY ( db)
-40 -30 -20
Fig. XXIII-9. Time-intensity trading ratio for human beings compared with that computed on the basis of the model. The dashed lines indicate the range of time-intensity trading ratios for humans (see E. E. David et al. 6). Solid points represent time-intensity trading ratios computed from single units on the basis of the model. Points from the same cell at different intensities are joined by a solid line. Not shown on this graph are two points computed from a single low-threshold cell: -99.5 db, 430 4sec/db; -101.5 db, 330 4sec/db.
L - 60 db R - 65 db L - 70 db R - 75 dbN" -500 RIGHT LEADING -200 0 rLR(Ip SEC) 0.20 L - 51 di R - 55 db LEFT LEADING
Fig. XXIII-10.
Slope of curves in Fig. XXIII-8. Ordinate is the change in
resulting from a 100-±sec change in interaural time difference.
. - CATS - FROM CELL ACTIVITY
-. /
"N./
20
--I
I
I
_
-(XXIII. COMMUNICATIONS BIOPHYSICS)
a given interaural intensity difference and asked to obtain a centered image by adjusting the interaural time difference (see David et al.,6 Fig. 5, impulse). The two sets of results are in close agreement, considering that they refer to two different species, etc., and they both show a trend downward with increasing intensity.
The range of interaural time differences over which a change in interaural time dif-ference produces a change in unit activity is consistent with reasonable assumptions about the cat's localization behavior. The sensitivity of a unit to changes in interaural time difference as measured by the slope of the curves in Fig. XXIII-8 is greatest for values of interaural time difference near zero, and it shows a sharp decrease for values of interaural time difference greater than 200-300
psec.
The slope of the curves in Fig. XXIII-8 is plotted as a function of interaural time difference in Fig. XXIII-10. The slopes are not symmetrical about zero interaural time difference because of the pres-ence of an interaural intensity differpres-ence.These curves can be related to a psychophysical parameter known as the Hornbostel-Wertheimer constant. This parameter is defined as the interaural time difference beyond which change in interaural time difference produces little change in position of the sound image. In humans this is approximately 500 Lsec.1 Since the distance between
the ears is smaller for cats than it is for humans, and therefore the maximum interaural time difference that could occur in free-field stimulation is smaller, it is perhaps not unreasonable to assume that the Hornbostel-Wertheimer constant for cats, if such a thing could be measured, would also be smaller.
A particularly interesting feature of the model is that the minimum interaural time difference that can be discriminated in terms of the model compares favorably with the minimum interaural time difference that the cat is capable of discriminating behavior-ally. We can obtain an estimate of the precision afforded by the model by making the following assumptions: (a) There is in each accessory nucleus a homogeneous popula-tion of n cells. (b) Each cell on the left fires to a given stimulus presentation with probability PL and does not fire with probability QL = 1 - PL* Similarly, each cell on
the right fires with probability PR. (c) Firings of individual cells are mutually inde-pendent.
We define random variables XL and XR as the number of cells on the left and right sides, respectively, which respond to a given stimulus presentation. From our assump-tions, the means and variances of these random variables are
E(XL) = mL = nPL, 2(XL) = L = nPLQL (1)
E(XR) = mR = nPR, 2 (XR) = = nPRQR. (2)
xD
XL - XR
(3)
It follows thatE(XD) = mD = mL - mR = n(PL -PR), (4)
and from the assumption of independence that
D(XD)
=
+c n(PLL PR QR).
(5)We now ask the question, For a given number of cells n, what is the smallest dif-ference AP between PL and PR which will result in XD being greater than zero with probability at least 0.75? (If the higher centers in our model made a "forced-choice" decision of right or left of center based simply on whether XL was greater than or less than XR , the choice of 0. 75 probability would mean that three out of four stimulus pres-entations would result in the judgment "right of center." The choice of 0.75 is arbitrary. It is chosen as a convenient level midway between 0. 5, corresponding to pure chance, and the asymptotic value 1. 0. While it is chosen on much the same basis as the 0. 75 level is chosen in psychophysical experiments, it should not be construed as corre-sponding to a behavioral just-noticeable difference.) If n is large, we can use the nor-mal approximation to the binomial, so that XD can be approximated by a nornor-mal dis-tribution, and from a tabulation of the normal distribution we find that
P(XD>0) > 0.75 if mD > 0. 7a D . (6)
Setting mD = 0. 70 D and substituting from Eqs. 4 and 5, we have
n(PL-P R) = 0.7 n(PLQL+PRQR) (7)
PL PR = AP = 0.7 (PLQL+PRQR)/n. (8)
Since we are interested in small differences between PL and PR, we can set PLQL + PRQR = Z(PLQL). Finally, we have
(9)
AP = (PLQL)/n.
Let us, for the moment, set n = 5000. This estimate is based on the density of cells in the accessory nucleus and the size of the accessory nucleus3 and on the assumption that one-fourth to one-half of the cells in the accessory nucleus are of the type that can be included in the model. It is probably conservative. Referring to Fig. XXIII-7, we
see for this particular cell and this particular stimulus configuration that PL = 0. 7,
(XXIII. COMMUNICATIONS BIOPHYSICS)
AP =
(o.7x0.3)/5000
= 0.006.
In order to determine the change in interaural time difference to which this corre-sponds, we observe from Fig. XXIII-7 that a change in interaural time difference of 50 ilsec results in a difference between PL and PR of -0. 12. Therefore AP = 0. 006 corresponds to a change in interaural time difference of 0. 006/0. 12 X 50 Jsec, or 2. 5 sec. This value is typical of the cells that we have observed and is of the same order of magnitude as the minimum change in interaural time difference that the cat is capable of discriminating behaviorally. 12
While our assumptions of homogeneity and independence are gross simplifications, we have an indication that the model potentially may be capable of discriminations of the right order of magnitude.
J. L. Hall II, Cynthia M. Pyle References
1. G. von B6k6sy, Experiments in Hearing, translated and edited by E. G. Wever (McGraw-Hill Book Company, Inc., New York, 1960), Chapter 8.
2. L. A. Jeffress, A place theory of sound localization, J. Comp. Physiol. Psychol. 41, 35-39 (1948).
3. W. A. van Bergeijk, Variations on a theme of B6k6sy: A model of binaural interaction, J. Acoust. Soc. Am. 34, 1431-1437 (1962).
4. R. Galambos, J. Schwartzkopff, and A. Rupert, Microelectrode study of supe-rior olivary nuclei, Am. J. Physiol. 197, 527-536 (1959).
5. B. H. Deatherage and I. J. Hirsh, Auditory localization of clicks, J. Acoust. Soc. Am. 31, 486-492 (1959).
6. E. E. David, Jr., N. Guttman, and W. A. van Bergeijk, Binaural interaction of high-frequency complex stimuli, J. Acoust. Soc. Am. 31, 774-782 (1959).
7. G. Moushegian and L. A. Jeffress, Role of interaural time and intensity dif-ferences in the lateralization of low-frequency tones, J. Acoust. Soc. Am. 31,
1441-1445 (1959).
8. R. G. Klumpp and H. R. Eady, Some measurements of interaural time dif-ference thresholds, J. Acoust. Soc. Am. 28, 859-860 (1956).
9. A. W. Mills, Lateralization of high-frequency tones, J. Acoust. Soc. Am. 32,
132-134 (1960).
10. W. A. Stotler, An experimental study of the cells and connections of the supe-rior olivary complex of the cat, J. Comp. Neurol. 28, 401-431 (1953).
11. K. T. Brown and K. Tasaki, Localization of electrical activity in the cat retina by an electrode marking method, J. Physiol. 15 281-295 (1961).
12. D. Katz, Animals and Men: Studies in Comparative Psychology (Longmans, Green, New York, 1937).
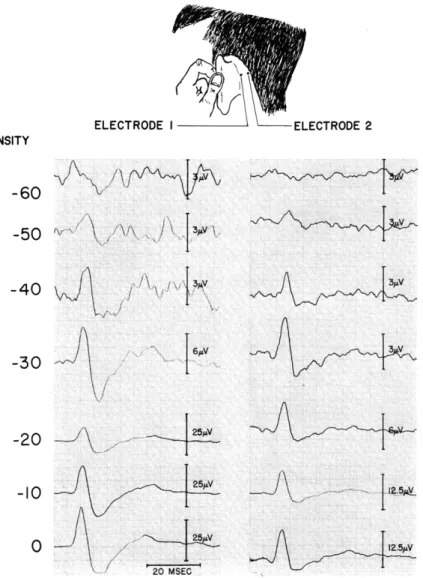
B. POSTAURICULAR ELECTRIC RESPONSE TO ACOUSTIC STIMULI IN HUMANS Many investigators have reported that acoustic stimuli alter the electric activity recorded from the scalp of humans. Several of these reports describe evoked responses
CLICK INTENSITY
-60
-50
-40
i
-30
-20
- 25jtV-O10
0
V 20 MSEcFig. XXIII- 1.
Averaged responses to clicks for two electrode locations behind
the left ear. The electrodes were stainless-steel needles. The
reference electrode was clipped to a saline-moistened cotton pad
on the right earlobe.
Negative polarity for the active electrodes
is plotted upward.
Responses are shown for 7 stimulus
intensi-ties. Clicks were produced by applying a 10-4sec rectangular
pulse to the terminals of an Altec 1-755A loud-speaker that was
located ~4 feet in front of the subject seated in a soundproof
room.
Clicks were presented at a 10/sec rate; reference level
(0 db) = 13 volts into the speaker. With this stimulus
arrange-ment the psychophysical threshold was approximately -65 db for
this subject.
(The beginning of each trace in this and subsequent
figures marks the instant at which a monitoring microphone
placed near the ear detects the arrival of the click.) Number of
responses averaged for each trace, N
=
1000.
Recording
ses-sion 1 on this subject (N. Y-S. K.,
1/12/62).
4V - ::LV
(XXIII. COMMUNICATIONS BIOPHYSICS)
1-6
with latencies of less than 70 msec. We have recently found a short latency response localized behind the external ear (auricle) which does not appear to have been previously reported. Some of the characteristics of this response are sufficiently unusual to war-rant a brief report.
The postauricular response has been recorded both from needle electrodes thrust into the skin posterior to the attachment of the ear (Fig. XXIII-11) and from wick elec-trodes curled over the attachment of the ear. Since the responses are not visually detectable in single traces except at high stimulus intensities, it was necessary to com-pute7 averaged responses on the ARC.
Figure XXIII- 11 shows responses recorded from two electrodes located behind the ear. The distance between the electrodes was 1.5 cm. The responses from electrode 1 show a peak approximately 11 msec after the acoustic stimulus arrives at the ear. This
* ELECTRODE I o ELECTRODE 2 0-_ -60 -50 -40 -30 -20 CLICK INTENSITY IN DB -10 0
Fig. XXIII-12.
Latencies and amplitudes of the negative peaks in the traces of
Fig. XXIII-11 as functions of click intensity.
Latencies are
measured from the beginning of each trace; amplitudes are
measured from base line to peak.
Z'
; d.P
i
o-(XXIII. COMMUNICATIONS BIOPHYSICS)
negative peak is followed approximately 7 msec later by a positive peak that is less
prominent in the recordings from electrode 2.
In general, the waveform of the
responses can vary considerably with location of the electrode, although the most
prom-inent deflections occur with latencies in the 10-20 msec range.
For a specific location
on any one subject,
the response waveform seems to be quite repeatable except as noted
below.
Figure XXIII-12 shows that the latency of the negative peak decreases and its
ampli-tude increases with increasing click intensity.
There is a relatively constant difference
of approximately 2 msec between the latencies of the responses from the two electrodes.
Note also that the amplitude of responses is smaller for electrode 2.
This is consistent
with our observation that the responses are largest in the region near the attachment of
the external ear.
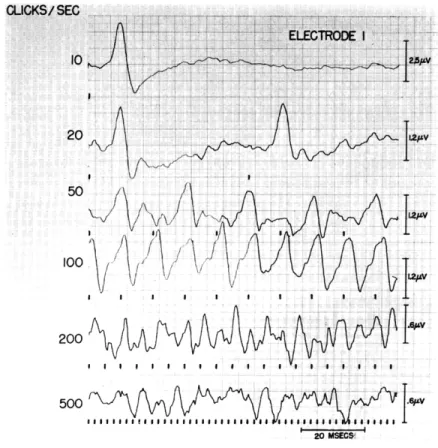
WOKS/ SEC
ELECTRODE
I
20
_ . . . * a . . . ..500
1,#1 a,..fill o$ gilf# 1#11*#,,8, *8#431f4 .4,,, -aFig. XXIII-13. Averaged postauricular responses for several click rates. The
marks under each trace denote the times of arrival of the clicks at
the ear. The electrode was placed in the same location as
elec-trode 1 of Fig. XXIII-11. The reference elecelec-trode was on the
right earlobe. Clicks were produced by 10-psec rectangular pulses
delivered to the loud-speaker terminals. Click
intensity,
-10 db
re 7 volts into loud-speaker; N
=
1000. Recording session 2 on
(XXIII. COMMUNICATIONS BIOPHYSICS)
Figure XXIII-13 shows the postauricular response for six different click rates. The responses at 200 clicks/sec and 500 clicks/sec are complicated by the overlap of responses to successive clicks. However, it is clear that some responses are synchro-nized with clicks, even at the 200/sec rate.
These results might seem to suggest that the relationship of these responses to the stimulus parameters can be easily described. However, this appears to be so only for the first few recording sessions. One of the exasperating aspects of working with this
NEEDLE ELECTRODE MINUTES AFTER
START OF RECORDING 0-1
1-2
3-4
4-5
-5-6
6-7
-7-8
WICK ELECTRODE8-9
9-10
10-11
T
20 MSEGC_Fig. XXIII-14.
11-12
T
20 MSEG "Averaged postauricular responses as a function of time after the
start of stimulation. Averages of responses recorded
simulta-neously from both a needle electrode and a wick electrode.
Ref-erence electrode on nose.
Clicks were produced by 100-p.sec
rectangular pulses. Click intensity, -20 db re 17 volts;
repe-tition rate, 10/sec; N = 500. Recording session 4 on this subject
(N. Y-S. K., 3/20/62).
1 I
BEFORE SHOCK
I
-10
MSEC
Fig. XXIII-15. Averaged postauricular responses from a subject before and after the delivery of electric shock to the bare feet. The responses of the sub-ject to steady clicks had decreased steadily with time from the start of the session. After the responses had declined to the level shown in the trace marked "before shock," the shock was delivered. The first 100 seconds of response activity were then processed to give the trace labeled "after shock." Responses recorded between a wick electrode and reference on nose. Stimulus conditions identical with those of Fig. XXIII-14; N = 1000. Session 5 for this subject (E. C. T., 4/5/62).
particular response is illustrated in Fig. XXIII-14. On the fourth recording session for this subject, responses were recorded for more than 12 minutes during which time click stimuli were delivered at the rate of 10/sec. Both needle and wick electrodes were used for this run. The wick electrode was in contact with almost the entire pos-terior line of attachment of the external ear. The responses recorded by the needle electrode are smaller than those in Fig. XXIII-11 because the needle could not be placed in the same locations with the wick in place. The waveforms of the responses from the two electrodes are quite different, particularly in that the initial negative peak is absent in the wick recordings. The later components in the responses recorded by the two electrodes seem to be comparable in latency, and they decline in amplitude in a similar way. This gradual decrease in response amplitude does not occur in initial recording sessions and occurs more rapidly in later recording sessions. For some of our more
"experienced" subjects, responses that had been stable in the initial sessions decreased rapidly in amplitude after the first few responses in later sessions. In sessions in which the amplitude had become small, various instructions to the subjects, such as "count the clicks," "relax," and "read," did not result in an increase in amplitude. Also, changes in room illumination or click intensity and repetition rate did not bring back the response. One instance in which the responses did become large again momentarily is shown in Fig. XXIII-15. Electric shocks to several of our subjects resulted in a spec-tacular increase in response amplitude with subsequent rapid decrease. After the shocks were repeated several times they, too, ceased to have significant effects.
(XXIII. COMMUNICATIONS BIOPHYSICS)
PO SITION
HEAD UP
IOV
- -- r IHEAD
BACK
HEAD FORWARD
Fig. XXIII- 16.
... . . . ....20
SE
20 MSEC
Postauricular responses influenced by head position. The head was
first oriented in an upright position. Then the head was allowed to
fall back until it rested comfortably on a support.
Finally, the head
was brought forward in a bending position. Changes in head
posi-tion often had dramatic 4ffects on the responses, but at other times
did not. Checks of the recording arrangement were always made
to ensure that no electrical connections were disturbed as a result
of head movements.
Stimulus conditions are identical with those of
Fig. XXIII-14.
N
=
1000 for the top and bottom traces; N
=
500 for
the middle trace. A needle electrode behind the left ear was used
in these recordings with the reference electrode on the right earlobe.
Session 4 for this subject (E. C. T., 3/26/62).
postauricular response.
For most of our subjects an upright position or forward bend of
the head resulted in larger responses than tilting the head back.
The effect is not always
as dramatic as that illustrated in Fig. XXIII- 16, even for the same subject. A similar
phenomenon has been previously reported for a longer latency response to auditory
stim-uli.
A few miscellaneous facts can also be noted. The postauricular responses are
obtainable with other transient stimuli, such as bursts of tone or bursts of noise. They
are obtainable bilaterally, even by using earphones to stimulate only one ear. Clear
responses were obtained from 8 of 10 subjects. Of these eight, four were male and four
female.
All subjects were less than 40 years of age and healthy. No responses could
be detected in records obtained from two subjects with severe hearing losses.
The ease of recording postauricular responses invites further experimentation to
determine their origin. The lability of the response challenges the ingenuity of the
experimenter.
This lability resembles the behavior of certain responses recorded from
the brains of unanesthetized cats.
In particular, a decrease in amplitude with prolonged
stimulation is characteristic of some components of the cortical responses in cats. It is difficult, however, to make direct comparisons between these two sets of data recorded in different ways from different species.
Despite the synchrony of the postauricular responses with stimuli at high rates (Fig. XXIII-13), it is possible that the response arises from activity of either ear or neck muscles. The sensitivity of the response to changes in electrode location and the effects of head position support such a view. The response is unlikely to be the result of stapedius muscle activity in the middle ear, since a clear response was obtained in a subject who had undergone stapes surgery with resultant severing of the muscle.
N. Y-S. Kiang, A. H. Crist, M. A. French, A. G. Edwards (Dr. A. G. Edwards is a Resident at the Massachusetts Eye and Ear Infirmary.)
References
1. J. Calvert, H-P. Cathala, F. Contamin, J. Hirsch, and J. Sherrer, Potentials 6voqu6s corticaux chez l'homme, Rev. Neurol. 95, 445-454 (1956).
2. C. D. Geisler, L. S. Frishkopf, and W. A. Rosenblith, Extracranial responses to acoustic clicks in man, Science 128, 1210-1211 (1958).
3. N. Y-S. Kiang, The use of computers in studies of auditory neurophysiology, Trans. Am. Acad. Ophthalmol. Otolaryngol. 65, 735-747 (1961).
4. E. L. Lowell, C. T. Williams, R. M. Ballinger, and D. P. Alvig, Measure-ments of auditory threshold with a special purpose analog computer, J. Speech Hearing Res. 4, 105-112 (1961).
5. T. Suzuki and I. Asawa, Evoked potential of waking human brain to acoustic stimuli, Acta Oto-laryngol. 48, 508-515 (1958).
6. H. L. Williams, D. I. Tepas, and H. C. Morlock, Jr., Evoked responses to clicks and electroencephalographic stages of sleep in man, Science 138, 685-686 (1962).
7. W.A. Clark, R.M.Brown, M.H. Goldstein, Jr., C.E. Molnar, D.F. O'Brien, and H. E. Zieman, The average response computer (ARC): A digital device for computing averages and amplitude and time histograms of electrophysiological response, Trans. IRE, Vol. BME-8, No. 1, pp. 46-51, 1961.
8. C. D. Geisler, Average Responses to Clicks in Man Recorded by Scalp Electrodes, Technical Report 380, Research Laboratory of Electronics, M. I. T., November 4, 1960, see p. 124.
9. D. C. Teas and N. Y-S. Kiang, Evoked cortical responses as a function of 'state variables,' Quarterly Progress Report No. 63, Research Laboratory of Elec-tronics, M.I.T., October 15, 1961, pp. 171-176.
C. RESPONSES OF A NEURONLIKE NET TO PAIRED STIMULI
We have reported previously that the response to the second of a pair of stimuli to a neuronlike net goes through damped "cycles" of alternate "enhancement" and "depres-sion" as a function of the length of the interval between the two stimuli. Other work on such "recovery curves" has confirmed and extended this result.
(XXIII. COMMUNICATIONS BIOPHYSICS)
less than 20-30 per cent of the amplitude of the cyclic oscillation, and sometimes exceeding it. The explanation for this variability lies in the fact that the stimulus pair never re-encounters identical conditions, since the net is spontaneously active.
We found that the intervals between the peaks in the recovery curves increase when the time constant that represents the refractory property of the neuronlike elements
is increased. This effect was expected, since the periods for spontaneous oscillations show a similar dependence.
Finally, we found that the "enhancement-depression" cycle varies in prominence as a function of the intensity of the stimuli. If the two stimuli are of equal intensity, there is one intensity level that produces the effect with greatest prominence. At high
intensities (for which a large proportion of the elements is stimulated), the activity of the net dies, or nearly dies, after the first stimulus, since most of the elements are
simultaneously refractory: the cycle vanishes under these conditions. At low stimulus intensities, "spontaneous" firings occur so frequently that the responses are small com-pared with the total activity; thus the effect vanishes into the noise level.
A detailed account of these results has been given in R. B. Keim's thesis.
R. B. Keim, B. G. Farley
References
1. B. G. Farley, Some results of computer simulation of neuronlike nets, Quarterly Progress Report No. 64, Research Laboratory of Electronics, M.I.T., January 15, 1962, pp. 258-267; N.B. p. 265.
2. R. B. Keim, Paired Stimuli Response of a Neural Net Model, S.B. Thesis, Department of Biology, M. I. T., September 1962.