HAL Id: hal-03205656
https://hal.inrae.fr/hal-03205656
Submitted on 23 Apr 2021HAL is a multi-disciplinary open access
archive for the deposit and dissemination of sci-entific research documents, whether they are pub-lished or not. The documents may come from teaching and research institutions in France or abroad, or from public or private research centers.
L’archive ouverte pluridisciplinaire HAL, est destinée au dépôt et à la diffusion de documents scientifiques de niveau recherche, publiés ou non, émanant des établissements d’enseignement et de recherche français ou étrangers, des laboratoires publics ou privés.
Thomas Desvignes, Jason Sydes, Jerôme Montfort, Julien Bobe, John
Postlethwait
To cite this version:
Thomas Desvignes, Jason Sydes, Jerôme Montfort, Julien Bobe, John Postlethwait. Evolution after whole genome duplication: teleost microRNAs. Molecular Biology and Evolution, Oxford University Press (OUP), 2021, �10.1093/molbev/msab105�. �hal-03205656�
Evolution after whole genome duplication: teleost
microRNAs
Thomas Desvignes1#, Jason Sydes1, Jerôme Montfort2, Julien Bobe2, John H. Postlethwait1# 1. Institute of Neuroscience, University of Oregon, Eugene OR 97403, USA
2. INRAE, LPGP, 35000, Rennes, France
# Correspondence to [email protected] and [email protected]
Email addresses:
Thomas Desvignes: [email protected] Jason Sydes: [email protected]
Jerôme Montfort: [email protected] Julien Bobe: [email protected]
John H. Postlethwait: [email protected]
ORCID:
Thomas Desvignes: 0000-0001-5126-8785 Jason Sydes: 0000-0003-4187-2828 Julien Bobe: 0000-0002-9355-8227
John H. Postlethwait: 0000-0002-5476-2137
Running title: microRNA evolution after the teleost whole genome duplication Competing interest statement: The author(s) declare no competing interests. Data availability statement: All data generated or analyzed during this study are
included in the published article (and its Additional Information files) and/or deposited in NCBI.
© The Author(s) 2021. Published by Oxford University Press on behalf of the Society for Molecular Biology and Evolution. This is an Open Access article distributed under the terms of the Creative Commons Attribution Non-Commercial License (http://creativecommons.org/licenses/by-nc/4.0/), which permits non-commercial re-use, distribution, and reproduction in any medium, provided the original work is properly cited. For commercial re-use, please contact [email protected]
Abstract
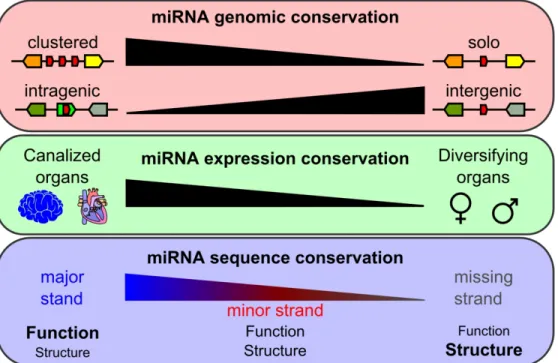
microRNAs (miRNAs) are important gene expression regulators implicated in many biological processes, but we lack a global understanding of how miRNA genes evolve and contribute to
developmental canalization and phenotypic diversification. Whole genome duplication events likely provide a substrate for species divergence and phenotypic change by increasing gene numbers and relaxing evolutionary pressures. To understand the consequences of genome duplication on miRNA evolution, we studied miRNA genes following the Teleost Genome Duplication (TGD). Analysis of miRNA genes in four teleosts and in spotted gar, whose lineage diverged before the TGD, revealed that miRNA genes were retained in ohnologous pairs more frequently than protein-coding genes, and that gene losses occurred rapidly after the TGD. Genomic context influenced retention rates, with clustered miRNA genes retained more often than non-clustered miRNA genes and intergenic miRNA genes retained more frequently than intragenic miRNA genes, which often shared the evolutionary fate of their protein-coding host. Expression analyses revealed both conserved and divergent expression patterns across species in line with miRNA functions in phenotypic canalization and diversification, respectively. Finally, major strands of miRNA genes experienced stronger
purifying selection, especially in their seeds and 3’ complementary regions, compared to minor strands, which nonetheless also displayed evolutionary features compatible with constrained function. This study provides the first genome-wide, multi-species analysis of the mechanisms influencing metazoan miRNA evolution after whole genome duplication.
Keywords
Spotted gar Lepisosteus oculatus, zebrafish Danio rerio, Three-spined stickleback Gasterosteus
aculeatus, Blackfin icefish Chaenocephalus aceratus, Japanese medaka Oryzias latipes, arm-switching
Introduction
MicroRNAs (miRNAs) are small non-coding RNAs that regulate protein-coding genes post-transcriptionally by binding to the 3’UTR of messenger RNAs (mRNAs) when incorporated into the RNA-induced silencing complex (RISC) (Jonas and Izaurralde 2015; Bartel 2018). In metazoans, miRNAs are implicated in virtually every biological process, including cell proliferation and
differentiation, development, physiology, and various pathologies (Sun and Lai 2013; Bartel 2018). In addition, miRNAs are hypothesized to provide robustness to embryonic development by buffering genetic noise, especially in stressful conditions (Mendell and Olson 2012; Cassidy et al. 2013; Schmiedel et al. 2015; Kasper et al. 2017; Liufu et al. 2017), which contributes to phenotypic
canalization (Hornstein and Shomron 2006; Wu et al. 2009; Ebert and Sharp 2012; Posadas and Carthew 2014; Alberti and Cochella 2017). Conversely, miRNAs are hypothesized to promote the emergence of new phenotypes by differentially modulating developmental and physiological pathways (Niwa and Slack 2007; Berezikov 2011; Arif et al. 2013), which can influence adaptation, diversification and speciation (Loh et al. 2011; Somel et al. 2011; Li and Zhang 2013; Quah et al. 2015; Franchini et al. 2016; Franchini et al. 2019; Kittelmann and McGregor 2019; Xiong et al. 2019; Kelley et al.). The finding that miRNA genes and their sequences are generally well conserved in evolution, especially in their seed (nucleotides 2 to 8), supports the crucial role of miRNAs in metazoan biology (Bartel 2009; Wheeler et al. 2009; Ameres and Zamore 2013; Fromm et al. 2015). Furthermore, the increase in miRNA gene numbers over time correlates with an increase in
metazoan organismal complexity and bursts of miRNA gene repertoire expansion correlate with specific lineage divergence events (Sempere et al. 2006; Lee et al. 2007; Wheeler et al. 2009; Berezikov 2011; Guerra-Assunção and Enright 2012; Hertel and Stadler 2015), supporting a role of miRNAs in lineage diversification.
Whole genome duplication events (WGD) had profound impacts on metazoan evolution and are thought to have provided a substrate for species and phenotypic diversification by increasing gene numbers and relaxing evolution (Ohno 1970; Force et al. 1999; Van de Peer et al. 2009; Ravi and Venkatesh 2018). The most studied metazoan WGDs include two rounds of vertebrate genome duplications (VGD1 and VGD2) that occurred at the origin of the vertebrate radiation (Dehal and Boore 2005; Smith et al. 2013; Simakov et al. 2020) and the teleost genome duplication (TGD) at the base of the teleost radiation (Amores et al. 1998; Taylor et al. 2003; Jaillon et al. 2004; Braasch et al. 2016). Teleosts form the most species rich vertebrate group, accounting for more than half of living vertebrate species. Teleosts colonized virtually all aquatic habitats from pole to pole, surface to hadal zones, and from hot springs to sub-zero Antarctic seas (Nelson 2006; Eschmeyer 2015). The consequences of WGD on vertebrate genome organization and protein-coding genes have been relatively well characterized (Nakatani et al. 2007; Braasch et al. 2016; Pasquier et al. 2017), but with still many open questions. Notably, genes encoding regulatory and signal transduction system components accumulate proportionally more during genome evolution compared to genes involved in conserved functions such as translation systems and metabolic enzymes (Nimwegen 2003; Koonin 2011; Warnefors and Eyre-Walker 2011). In agreement, after the TGD, protein-coding genes involved in biological functions prone to spurring phenotypic diversification in fish (i.e., pigment and
cognition-related genes) were retained in duplicates more often than protein-coding genes involved in well conserved functions, such as liver genes (Braasch et al. 2009; Schartl et al. 2013). In striking contrast, an understanding of the consequences of WGDs on metazoan miRNA gene evolution and
89 their genomic accumulation is lacking and only a few genome-wide examples have been reported 90 (Berthelot et al. 2014; Braasch et al. 2016).
91 miRNA genes occupy several different types of genomic locations. Some miRNA genes are 92 intergenic and others reside within protein-coding genes, either on the same or the opposite DNA 93 strand as the host gene and generally in introns and rarely in exons (Campo-Paysaa et al. 2011; 94 Fromm et al. 2015; Bartel 2018); intragenic miRNA genes may or may not be functionally associated 95 with the host gene (Rodriguez et al. 2004; Lutter et al. 2010; França et al. 2016). miRNA genes can 96 also be organized in clusters characterized by the presence on the same DNA strand of successive 97 miRNA precursors within a genomic region compatible in size with the expression of a polycistronic 98 transcript (e.g., up to 50 kb apart) (Altuvia et al. 2005; Baskerville and Bartel 2005; Chan et al. 2012; 99 Guerra-Assunção and Enright 2012; Bartel 2018). Initial estimates suggested that miRNA clusters 100 were often retained during evolution (Marco et al. 2010; Sun et al. 2013) but to our knowledge, no 101 genome-wide information exists on the co-conservation of intragenic miRNA genes and their 102 protein-coding host gene after whole genome duplication except for a few anecdotal cases (Bhuiyan 103 et al. 2013; Tani et al. 2013; Desvignes et al. 2014).
104 The evolution of miRNA gene expression across species also remains unresolved. miRNAs are 105 generally considered to be specialized in function and to be developmental stage-specific, organ-106 specific, and even cell type-specific, therefore participating in cellular identity and tissue specificity 107 (Lee et al. 2007; Christodoulou et al. 2010; Ludwig et al. 2016; Juzenas et al. 2017; McCall et al. 2017; 108 de Rie et al. 2017; Avital et al. 2018; Halushka et al. 2018). Most of these data, however, originate 109 from mammals and the extent to which conservation of expression is similar across all vertebrates is 110 unknown.
111 Finally, miRNAs regulate gene expression largely by target recognition through the miRNA 112 seed and 3’ Complementary Region (3’CR) (Bartel 2018; Bofill-De Ros et al. 2019; McGeary et al. 113 2019; Sheu-Gruttadauria et al. 2019). Changes in the sequences of the seed or of the 3’CR might lead 114 to undetectable effects on regulatory efficiency or might cause dramatic alterations in the set of 115 targeted transcripts (Neilsen et al. 2012; Ameres and Zamore 2013; Tan et al. 2014). Across species, 116 the seed and the 3’CR of orthologous miRNAs appear to be under selective pressure for sequence 117 preservation (Wheeler et al. 2009; Fromm et al. 2015), arguing for conserved regulatory functions if 118 miRNA binding sites in the 3’UTRs of targeted transcripts are also preserved. Sequence evolution of 119 duplicated miRNAs, however, has never been studied following WGD. Furthermore, it remains 120 unknown whether miRNA genes that are retained in two copies produce mature miRNAs that tend 121 to have identical sequences or whether, following an initial period of neutral drift or selection,
duplicated copies diverged from one another in sequence or expression. And if they diverged, whether mutations more often affected the seed and/or the 3’CR, therefore potentially driving miRNA function towards novel genetic and developmental pathways.
To address these open questions, we studied the evolution of miRNAs after the TGD by analyzing miRNAs in the non-teleost actinopterygian spotted gar Lepisosteus oculatus, representing the sister lineage to duplicated teleost genomes, and in four teleosts: zebrafish Danio rerio, Japanese medaka Oryzias latipes, three-spined stickleback Gasterosteus aculeatus, and Antarctic blackfin icefish Chaenocephalus aceratus. Species were chosen based on their position in the tree of life and their importance in developmental, genetic, and phenotypic research. We hypothesized that 1) because miRNA genes are important regulators of gene expression similar to protein-coding genes with developmental and regulatory functions, they are more likely to be retained in duplicate after WGD than genes without known functions in gene expression regulation; 2) because miRNA genes are small genetic elements, their rate and pattern of retention after WGD might depend not only on their regulatory functions but also on their genomic context; 3) because miRNAs have the potential to contribute both to phenotypic canalization and conversely to diversification, expression patterns of miRNAs providing robustness to development should be well-conserved in evolution while
expression patterns of miRNAs involved in phenotypic diversification are likely to be rapidly evolving; and 4) similar to functional domains in proteins, the most highly functional parts within a miRNA gene (i.e., the seed and the 3’CR) are more likely to be evolutionarily preserved than parts with little or no apparent function.
These hypotheses make the testable predictions that after the TGD: 1) miRNA genes should be more likely to be retained in duplicates than protein genes in general, most of which do not directly regulate the activity of other genes; 2) different genomic contexts, such as gene clusters or genomic overlaps with protein-coding genes, will display different rates and patterns of miRNA gene retention; 3) miRNAs involved in organs performing highly conserved tasks through evolutionary time (e.g., brain and heart ventricle) will show greater conservation in expression patterns among fish species compared to miRNAs involved in organs participating in species diversification (e.g., gonads); and 4) under the assumption that the strand that is more highly expressed in a miRNA duplex (i.e., the major strand) is the most functional strand, its sequence conservation will be greater than the sequence of the more lowly expressed strand, and a corollary, the sequences of the most functional parts of the mature miRNAs will have greater sequence conservation than parts of the miRNA that play minor functional roles.
Results and discussion
The miRNAome of the Teleost-Holostei last common ancestor
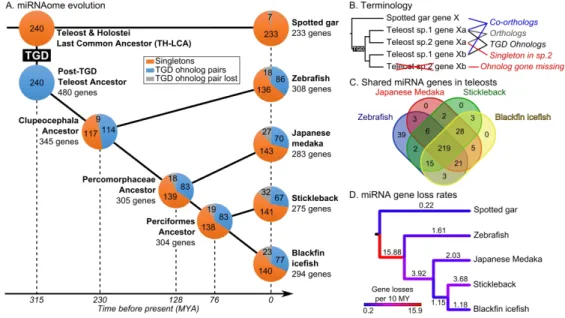
To study the retention patterns of miRNA gene ohnologs (i.e., gene duplicates originating from a whole genome duplication event (Ohno 1970; Wolfe 2000), Fig. 1B), we inferred a
hypothetical pre-TGD miRNAome to compare to the miRNAomes of extant teleost species. We used the gar as a representative of the Holostei, the unduplicated sister group to the teleosts. And for extant teleosts, we used the developmental genetic models zebrafish and medaka, the evolutionary model stickleback, and the ecologically specialized Antarctic blackfin icefish.
Lacking a comprehensive miRNA annotation for the Japanese Medaka (Kozomara and Griffiths-Jones 2013; Fromm et al. 2020), we annotated miRNA genes and mature miRNAs in the medaka using publicly available smallRNA sequencing data (Gay et al. 2018) that we aligned to the HdrR strain medaka genome using Prost! (Desvignes et al. 2019). Analysis recovered a total of 289 miRNA genes and 427 individual mature miRNAs in medaka (Additional Files 1-3). The published miRNA annotations for gar, zebrafish, stickleback, and blackfin icefish used in this study contained a comparable number of genes and mature miRNAs with 233, 332, 286, and 294 miRNA genes,
respectively, and 362, 495, 396, and 408 individual mature miRNAs, respectively (Braasch et al. 2016; Desvignes et al. 2019; Kim et al. 2019).
To focus the study on the effects of the TGD on miRNA gene retention and evolution, we excluded from analysis teleost-specific miRNA genes (e.g., mir10544, mir10551, mir2191 to mir2198, and mir7553) (Kozomara and Griffiths-Jones 2013; Fromm et al. 2020) because genes unknown in any non-teleost species are unlikely to have been present in the pre-TGD common ancestor of teleosts and gar, which we refer to as the Teleost-Holostei last common ancestor or TH-LCA. Orthology relationships among miRNAomes were carefully assigned for each species by both
sequence similarity and synteny conservation. These comparisons identified in medaka six additional orthologous miRNA gene loci that were not detected in expression datasets. The absence of
expression data for these miRNA genes could be related to insufficient sequencing depth, the limited number of tissues and developmental stages studied, or to expression loss. Unfortunately, we cannot distinguish among these possibilities. To identify putative gene losses, we carefully checked for potential gaps in genome assemblies at genomic regions where the genes would have been expected from conserved synteny data, for absence of smallRNA reads originating from genes that would be missing in the genome assembly but potentially present in the biological genome, and the shared absence of genes in genome assemblies of related species, together suggesting true losses. The mir430 gene family was also excluded from our analysis. Although mir430 genes have been well
studied and are crucial for early embryonic development in zebrafish (Giraldez et al. 2006), the evolution of this family remains uncertain. miR-430-3p mature products show great sequence conservation across species, especially in their seed (Additional File 4A), their synteny is in contrast not conserved. We identified two clustered intragenic mir430 genes in the spotted gar genome assembly (Additional File 4B) and many intergenic mir430 genes and clusters in each of the genome assemblies of the four studied teleost species – at least 55 genes in zebrafish, 58 in medaka, 139 in stickleback and 157 in icefish – but none of these genomic regions displayed any conserved synteny with any other species in our dataset (Additional File 4B). We therefore excluded mir430 genes from our analysis because it was impossible to establish reliable orthology relationships between its members across species, to infer the organization of mir430 genes in the TH-LCA, and thus to decipher the evolutionary history of this outlier, highly duplicated and apparently mobile miRNA gene family. Together, our analysis led to sets of 233, 308, 283, 275, and 290 miRNA genes in gar, zebrafish, medaka, stickleback, and blackfin icefish, respectively, whose orthologs can also be found in non-teleost vertebrate species even if no expression could be measured in the studied expression datasets (Fig. 1A, Additional Table 1).
Finally, to search for miRNA genes that might have been present in the TH-LCA but lost in the gar lineage, we searched for genes that are present in non-teleost vertebrates (e.g., chicken,
Xenopus, mouse, human) and in at least one teleost. We identified seven pre-TGD miRNA genes that
were secondarily lost in gar but conserved in teleosts and non-teleost vertebrates. The miRNAome of the TH-LCA for this study was therefore defined as a set of 240 evolutionarily-conserved miRNA genes (Fig. 1A, Additional Table 1, Additional File 5).
The frequency of miRNA gene TGD ohnolog retention in duplicates suggests
a role in phenotypic canalization and diversification
Having established the miRNAome of several teleosts and the hypothetical pre-TGD TH-LCA miRNAome, we could address the question of gene retention rates and patterns following the TGD. Teleost miRNAomes tended to be larger than that of the inferred TH-LCA. Teleost genomes appeared to have on average 50 ± 14 more miRNA genes than the TH-LCA (Additional Table 1), representing a 21% increase in gene number. Orthology relationships (Fig. 1B, Additional File 5) revealed that most (76%) miRNA genes were present in all four studied teleost species (Fig. 1C). In addition, 31.3 ± 3.0% of the TH-LCA miRNA genes were present in two ohnologous copies in the genome assemblies and/or smallRNA sequencing data of the studied teleost species, ranging from 35.8% in zebrafish to 27.9% in stickleback (Fig. 1A, Additional Table 1). This retention rate of miRNA
genes in duplicated copies is significantly higher than the estimated 12-24% retention rate for protein coding genes (Braasch and Postlethwait 2012; Pasquier et al. 2017) (p < 2.22e-16 and p = 4.5e-6 for protein-coding gene retention rates of 12% and 24%, respectively, Repeated G–tests of goodness-of-fit (RGT)). These results are in agreement with the previous report of a 39% retention rate of miRNA gene TGD ohnolog pairs in zebrafish that was performed on a smaller set of 208 TH-LCA genes (Braasch et al. 2016) compared to the 240 genes studied here. The high duplicate retention rate of miRNA genes after the TGD is also consistent with observations made in rainbow trout, where miRNA genes located in double-conserved synteny (DCS) regions after the salmonid genome duplication (SaGD, a more recent event, about 80 million years ago, than the TGD, about 315 million years ago (Allendorf and Thorgaard 1984; Macqueen and Johnston 2014; Kumar et al. 2017)) were retained in duplicate at a rate of 2.02 fold higher than that for protein coding genes (Berthelot et al. 2014). These results are also consistent with observations of higher retention rates of miRNA genes than protein coding genes following WGDs in plants (e.g., Zhao et al. 2015; Sun et al. 2015; Shi et al. 2017).
Besides the 31.3% of ancestral miRNA genes retained in duplicates in teleosts, 58.3 ± 1.1% were retained as singletons and 10.4 ± 2.1% were lost in the studied teleost species (Fig. 1A, Additional Table 1). The precise fractions of TH-LCA protein-coding genes that were retained as singletons or lost after the TGD is unknown, and therefore cannot be directly compared to the situation analyzed here for miRNA genes. Similarly, no other study has estimated the retention and loss rates of miRNA genes following other metazoan WGD events.
Together, these results quantitatively demonstrate that the TGD significantly contributed to the expansion of teleost miRNA gene repertoires. This observation confirms previous qualitative conclusions that WGDs likely played significant roles in the amplification of miRNA gene repertoires (Hertel et al. 2006; Campo-Paysaa et al. 2011; Hertel and Stadler 2015).
These results also demonstrate that miRNA genes were retained significantly more frequently in duplicated copies compared to protein coding genes after the TGD. This difference could be related to the small size of miRNA genes providing a reduced target for deleterious nucleotide substitution mutations that might lead to a pseudogene compared to protein-coding genes. Studies of the molecular evolution of protein-coding genes, however, demonstrated that longer genes evolved at slower rates than shorter genes (Wolf et al. 2009; Lopes et al. 2020), throwing into question whether mutation target size is a major factor in miRNA duplicate gene retention. Nevertheless, discrepancies in gene lengths between miRNA and protein-coding genes might still contribute to the higher
function in regulatory and signal transduction, however, accumulate proportionally more during genome evolution compared to protein-coding genes involved in conserved functions such as the translation system and enzymes of metabolic pathways (Nimwegen 2003; Koonin 2011; Warnefors and Eyre-Walker 2011). In agreement, specific groups of protein-coding genes suggested to be involved in biological functions prone to spurring phenotypic diversification in fish (i.e., pigment and cognition-related genes) were, however, retained in duplicate at a higher rate than protein-coding genes involved in well conserved functions, such as those mediated by liver genes (Brunet et al. 2006; Braasch et al. 2009; Schartl et al. 2013). The higher retention rate of miRNA gene duplicates compared to the overall retention of protein-coding genes might therefore be linked to the continuous accumulation during evolution of regulatory genes, both protein-coding and miRNA genes. In addition, miRNA regulation of gene expression operates in a dosage-sensitive manner because a cell has more potential binding sites for each miRNA than it has molecules of that miRNA (Denzler et al. 2014; Denzler et al. 2016). Thus, duplicated miRNA genes with identical or overlapping functions could provide twice as many miRNA molecules, therefore increasing robustness of their regulatory function, or maintaining proper network balance and relative dosage if their targets were also duplicated. This enhanced robustness in genetic regulation could in turn improve phenotypic canalization and be selected upon for genomic conservation under the gene balance hypothesis (Birchler and Veitia 2010; Abrouk et al. 2012; Birchler and Veitia 2012). Alternatively, duplicated miRNA genes that diverged and evolved different functions would increase the extent of protein-coding gene expression regulation by developing new sets of targeted genes and regulatory pathways, potentially contributing to phenotypic diversification and, if these were evolutionarily advantageous, they could be selected upon and preserved. Together, an increase in miRNA gene numbers can strengthen pre-existing regulatory functions or promote the development of new regulatory links, contributing to phenotypic canalization or diversification, respectively. We do not know, however, to what extent the evolutionary conservation or evolution of new targets influenced the retention of pre-existing miRNA genes or the origin of new ones. Analyses aimed at revealing the post-TGD fate of targeted protein-coding genes, the conservation of target sites, and the
co-evolution of target site and miRNA sequences are needed to address this standing question.
miRNA gene losses occurred rapidly after the TGD
By reconstructing a series of ancestors across the phylogeny of investigated species (Fig. 1A, Additional File 5), we could enumerate gene losses on each branch on a time-calibrated species tree (Kumar et al. 2017) and calculate gene loss rates (Fig. 1D). Analysis revealed first that gar
(seven genes; 0.22 gene losses per 10 MY; Fig. 1D). This result is in line with previous observations that genomes in the gar lineage evolved slowly (Braasch et al. 2016).
Second, evidence from the tree showed that during the approximately 85 MY between the TGD and the stem Clupeocephalan teleost (including all four of our teleosts, i.e., between 315 and 230 MYA), miRNA genes were lost at a higher rate (15.88 genes per 10 MY, Fig. 1D) than in any other period in the 315 MY encompassed by the phylogeny. This quantitative measure of gene loss agrees with previous qualitative statements (Hertel and Stadler 2015), suggesting that most WGD-related miRNA gene ohnologs became singletons or were both lost shortly after the duplication event. This finding for miRNA genes also mimics models and observations for protein-coding genes following the TGD (Braasch et al. 2009; Inoue et al. 2015).
Third, in contrast to the period immediately following the TGD, branches leading to extant species experienced limited gene losses, ranging from the low rate of 1.18 gene losses per 10 MY in the cold-adapted Antarctic blackfin icefish over the 76 MY of divergence from the Perciformes hypothetical ancestor to the moderate rate of 3.68 gene losses per 10 MY over the same 76 MY of divergence for stickleback (Fig. 1D). Notably, the blackfin icefish lineage did not experience
accelerated losses of miRNA genes that one might have hypothesized given that the frigid Antarctic environment could have impaired miRNA biogenesis and function due to increased nucleotide base pairing strength that accompanies cold temperatures. In addition, while icefishes have
pseudogenized hemoglobin genes and lack mature red blood cells (Near et al. 2006), miRNA genes known to be involved in erythropoiesis in at least some teleosts and other vertebrates are present in both the icefish genome assembly and smallRNA sequencing data (Desvignes et al. 2016; Kim et al. 2019), suggesting that these miRNA genes may have additional functions independent of
erythropoiesis or have been genomically retained even in the absence of their original erythropoietic function.
Finally, these data revealed that the branch leading from the hypothesized Clupeocephala ancestor to the hypothesized Percomorphaceae ancestor experienced moderate gene loss with an average loss of 3.92 genes per 10 MY over a period of 102 MY (Fig. 1C). This rate could be related to genome evolution concomitant with the diversification of the enormous Acanthomorpha group, which counts about 16,000 marine species and represents about 85% of marine ray-finned fish species and about a third of all vertebrate species (Wainwright and Longo 2017).
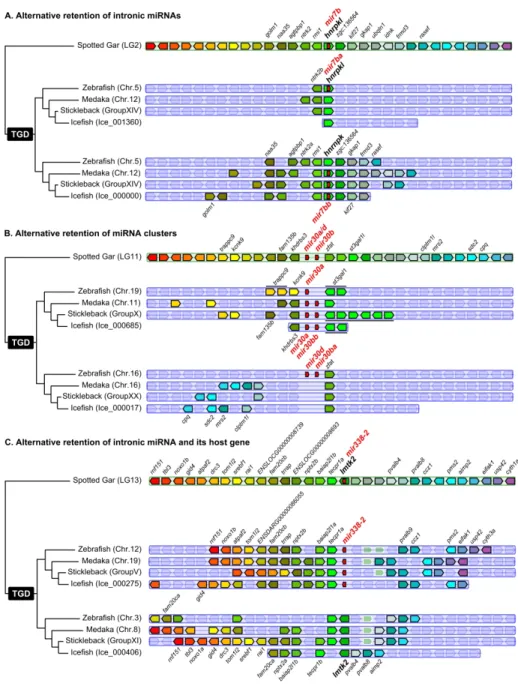
The reconstruction of hypothetical ancestor miRNAomes does not account for possible convergent losses across lineages. Our dataset, however, revealed four examples of asymmetrical ohnolog retentions (e.g., retention of the ‘a’ copy in one lineage and of the ‘b’ copy in another),
representing 1.67% of the 240 TH-LCA genes. In one case, the TH-LCA intronic miRNA gene mir7b was retained as mir7ba within the ohnolog hnrnpkl in zebrafish but was lost at that locus in studied acanthomorphs (Fig. 2A). Conversely, in acanthomorphs, the ancestral mir7b was conserved as
mir7bb within hnrnpk but was lost at that locus in zebrafish (Fig. 2A).
The second case is the asymmetric retention of the ancestral cluster mir30a/d-mir30b comparing zebrafish and acanthomorphs. At one ohnologous locus, zebrafish retained only mir30a while acanthomorphs retained the entire two-gene cluster mir30a-mir30bb, and at the other ohnologous locus, acanthomorphs lost the entire cluster while zebrafish retained the entire cluster (Fig. 2B). The third and fourth identified cases of asymmetrical ohnolog resolution are the alternative retention of the mir124-5/mir124-6 and mir153aa/mir153bb ohnologous pairs present in medaka and in the hypothetical Percomorphaceae ancestor. In stickleback mir124-6 and mir153aa were retained and mir124-5 and mir153ab were lost, while in the blackfin icefish, mir124-6 and mir153aa were lost and mir124-5 and mir153ab were retained (Additional File 5).
Together, these results demonstrate that the gar miRNAome remained highly similar to the TH-LCA miRNAome and that the highest rate of miRNA gene loss occured during the 85 MY following the TGD. The study of additional Holostei species, especially the bowfin Amia calva, would be necessary to better understand whether the high conservation of miRNA genes in gar is specific to this species, to Lepisosteiformes, or to the whole Holostei group. Similarly, the study of additional teleosts, especially the early diverging lineages of Elopomorpha and Osteoglossiforms, would help us understand the dynamics of gene resolution following the TGD.
Clustered miRNA genes and miRNA clusters were retained more often than
solo miRNAs
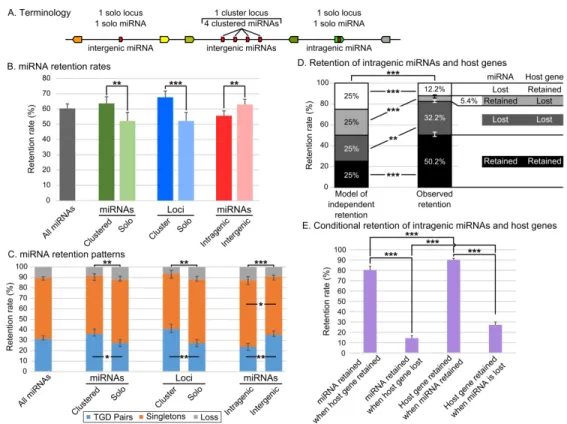
Metazoan miRNA genes are often organized in clusters that can be transcribed in a single transcript (Altuvia et al. 2005; Baskerville and Bartel 2005; Chan et al. 2012; Bartel 2018) and are often evolutionarily conserved (Chan et al. 2012; Marco et al. 2013; Sun et al. 2013; Wang et al. 2016). We know little, however, about the evolution of miRNA clusters and their clustered miRNA genes after any WGD event. To address this issue, we studied miRNA clusters themselves, which we refer to as “cluster loci” opposed to “solo loci” (Fig. 3A), and the several miRNA hairpin genes within the clusters, which we refer to as “clustered miRNAs” opposed to “solo miRNAs” (Fig. 3A).
Analysis revealed first that about half of the total number of miRNA genes were found in clusters both in the TH-LCA and in teleosts (47.1% and 49.6 ± 0.9%, respectively, Additional Table 2), similar to other metazoans (Griffiths-Jones et al. 2008; Marco et al. 2010; Kabekkodu et al. 2018). In
addition, we found a significantly higher overall retention rate (+11.5%) for clustered miRNA genes (63.7 ± 4.3%) compared to solo miRNA genes (52.2 ± 5.6%; p = 0.006079, Cochran-Mantel-Haenszel Test (CMHT)) (Fig. 3B, Additional Table 2). Clustered miRNA genes were also retained in two copies significantly more frequently (+8.9%) than solo miRNA genes (36.1 ± 4.5% and 27.2 ± 3.3%,
respectively; p-adj = 0.0113, CMHT) (Fig. 3C, Additional Table 3). Clustered miRNA genes and solo miRNA genes, however, were retained as singletons at approximately similar rates (55.3 ± 2.1% and 60.6 ± 3.3%, respectively; p-adj = 0.1098, CMHT) (Fig. 3C, Additional Table 3). Clustered miRNA genes and solo miRNA genes were fully lost (i.e., both copies were lost) at similar rates (8.6 ± 4.2% and 12.2 ± 1.4%, respectively; p-adj = 0.1097, CMHT) (Fig. 3C, Additional Table 3). Mirroring the overall miRNA gene loss dynamic (Fig. 1D), the highest rate of solo and clustered miRNA gene loss occurred within the 85 MY following the TGD (Additional File 6).
We then asked whether the retention rate of miRNA cluster loci was greater than that of solo miRNA loci. The TH-LCA and gar both possess the same 46 miRNA clusters, while our four teleost species possess on average 62 ± 4 clusters derived from the TH-LCA, ranging from 58 clusters in stickleback to 67 clusters in zebrafish (Additional Table 4). In all four species, miRNA clusters are usually small and composed of two to six hairpins (Additional Table 4 and Additional File 5). Cluster loci represent 27.2% of miRNA loci in the TH-LCA and 29.9 ± 0.9% of miRNA loci in teleosts
(Additional Table 4). The overall retention rate of cluster loci was significantly higher (+15.5%) than that of solo miRNA loci (67.7 ± 4.1% and 52.2 ± 5.6%, respectively; p = 0.000794, CMHT) (Fig. 3B, Additional Table 4) and cluster loci were retained in two copies significantly more frequently (+13.6%) than solo miRNA loci (40.8 ± 4.5% and 27.2 ± 3.3%, respectively; p-adj = 0.0026, CMHT) (Fig. 3C, Additional Table 5). In contrast, miRNA cluster loci and solo loci were retained in singletons at similar rates (52.7 ± 3.3% and 60.6 ± 3.3%; p-adj = 0.0758, CMHT). miRNA cluster loci and solo loci were also lost at similar rates (6.5 ± 4.3% and 12.2 ± 1.4%; p-adj = 0.0691, CMHT) (Fig. 3C, Additional Table 5). Similar to the loss dynamic of clustered miRNA genes and of miRNA genes overall, the highest rate of solo and cluster miRNA loci loss occurred within the 85 MY following the TGD (Fig. 1D, Additional File 6).
These results represent the first genome-wide quantitative demonstration that clustered miRNA genes are more likely to be retained after whole genome duplication, and confirm previous observations made on subsets of teleost clusters (Chan et al. 2012; Marco et al. 2013; Sun et al. 2013; Wang et al. 2016). Several possible hypotheses might help explain this finding. First, clustered miRNA genes are generally co-expressed in a polycistronic transcript (Altuvia et al. 2005; Baskerville and Bartel 2005; Chan et al. 2012; Bartel 2018); therefore mutations that alter the regulation of cluster expression might simultaneously non-functionalize the entire cluster. Second, clustering of
miRNA genes improves the processing of non-optimal hairpins within the cluster (Fang and Bartel 2020; Shang et al. 2020); therefore, mutations that alter a hairpin within a cluster might alter processing of other members of the cluster and modify the entire cluster function. These two types of alterations (i.e., locus control mutations and hairpin processing mutations) would likely be selected against to preserve existing regulation, favoring the maintenance of the entire cluster by tight genomic linkage (Marco et al. 2013). Third, if clustered miRNA genes encode several miRNAs that cooperatively regulate genetic pathways, which is still debated (Wang et al. 2016; Kabekkodu et al. 2018; Marco 2019), then a mutation that eliminates part of a cluster might lead to imbalanced regulation of genetic processes modulated by the functionally co-adapted members of the cluster, which in turn could lead to the elimination of the entire cluster and prevent aberrant regulation. This type of alteration would also likely be selected against, favoring the retention of all the functional elements of the cluster and its established regulatory network. Together, these results demonstrate that miRNA genes assembled in clusters benefit from their association which increases their
retention rates in evolution after genome duplication, suggesting that genetic linkage reduces the likelihood of cluster losses and that clustering is a way to maintain together a group of miRNAs that had already been individually selected for their regulatory functions and as a whole coordinately regulate a cohort of biologically-related targeted genes as previously hypothesized (Mohammed et al. 2014).
Intergenic miRNA genes were retained more often than intragenic miRNA
genes
This analysis of clustered vs. solo miRNA genes revealed that genomic context influenced the retention of miRNA genes and miRNA clusters. We then questioned how the intragenic or intergenic genomic context of a miRNA gene influences its retention after a WGD event. Many metazoan miRNA genes lie within protein-coding genes and are usually intronic and on the same strand as their host gene, but they can be on the opposite strand from their host gene and rarely be exonic (Campo-Paysaa et al. 2011; Meunier et al. 2013; Hinske et al. 2014; Boivin et al. 2018). Despite a few individual case studies (e.g., Bhuiyan et al. 2013; Desvignes et al. 2014b; Siddique et al. 2016), no genome-wide information has been available on the effect of WGD events on the retention of intragenic and intergenic metazoan miRNA genes.
More miRNA genes were intergenic than intragenic in the five studied fish genomes.
Intragenic miRNA genes represented 34.6% of TH-LCA miRNA genes, 35.2% of gar miRNA genes, and 28.3 ± 0.9% on average of miRNA genes in the four studied teleosts (Additional Table 6). In the
TH-LCA, gar, and teleosts, most intragenic miRNAs (88.0%, 87.8%, and 86.3 ± 1.0%, respectively) have the same orientation as their host gene (Additional Table 6). In addition, independent of orientation, nearly all intragenic miRNA genes were within introns of the host gene in the TH-LCA, gar, and on average in teleosts (94%, 96.3% and 96.0 ± 1.2%, respectively) (Additional Table 6). These
proportions are in agreement with the abundance and orientation of intragenic miRNA genes in other metazoans (Griffiths-Jones et al. 2008; Chiang et al. 2010; Marco et al. 2010; Meunier et al. 2013; Hinske et al. 2014) and with the fact that intragenic miRNA genes are usually transcribed with their host gene (e.g., Baskerville and Bartel 2005; França et al. 2016).
We then studied the retention rates of post-TGD intragenic vs. intergenic miRNA genes, independent of their strand and location in their host gene. The overall retention rate of intragenic miRNA genes was significantly lower (-7.4%) than of intergenic miRNA genes in teleosts (55.6 ± 3.2% and 63.0 ± 3.4%, respectively; p = 0.0019, CMHT) (Fig. 3B, Additional Table 6). Intragenic miRNA genes were also retained in two copies significantly less frequently (-11.4%) than intergenic miRNA genes (23.8 ± 3.3% and 35.2 ± 3.7%, respectively; p-adj = 0.0012, CMHT) (Fig. 3C, Additional Table 7). Conversely, intragenic miRNA genes were retained as singletons significantly more frequently (+8%) than intergenic miRNA genes (63.6 ± 3.6% and 55.6 ± 1.5%, respectively; p-adj = 0.0270, CMHT) (Fig. 3C, Additional Table 7). Intragenic and intergenic miRNA genes were, however, lost at similar rates (12.7 ± 4.0% and 9.2 ± 3.2%, respectively; p-adj = 0.1243, CMHT) (Fig. 3C, Additional Table 7). Similar to the overall miRNA gene loss dynamic and that of clustered miRNA genes and cluster loci, most intragenic and intergenic miRNA gene losses occurred within the 85 MY following the TGD (Fig. 1D, Additional File 66). We conclude that the retention of miRNA genes after the TGD was significantly influenced by their genomic context and that inclusion within a protein-coding gene negatively influenced the retention in duplicate of a miRNA gene.
We then queried the effect of clustering on retention rates and patterns of intragenic vs. intergenic miRNA genes. Results did not reveal any significant differences in retention rates between combinations of clustered vs. solo and intragenic vs. intergenic miRNA genes (Additional File 7A). Intergenic clustered miRNA genes were, however, retained in duplicate significantly more often than intragenic clustered miRNA genes (p-adj = 0.0382, CMHT), and were retained as singletons
significantly less frequently than intragenic clustered miRNA genes (p-adj = 0.0382, CMHT)
(Additional File 7B). At the miRNA locus level, intergenic cluster loci were retained more frequently than intergenic solo loci (p = 0.0282, CMHT), but this effect of clustering was not significant between intragenic cluster and intragenic solo loci (p = 0.0869, CMHT) (Additional File 7C). In contrast to clustered miRNA genes, intragenic and intergenic cluster loci were retained in statistically similar proportions (p = 0.0869, CMHT) (Additional File 7D), however, the low number of intragenic cluster
loci (11) and intergenic cluster loci (35) could explain this lack of statistical difference. Intergenic cluster loci were retained in duplicate significantly more frequently than intergenic solo loci (p-adj = 0.0204, CMHT) and were retained significantly less frequently as singletons than intergenic solo loci (p-adj = 0.0440, CMHT). These results support the observation that clustering and association with a host gene both influence the retention of miRNA genes, with clustered intergenic miRNA genes and loci being the most frequently retained and intragenic solo miRNA genes and loci being the least frequently retained.
Evolutionary association between intragenic miRNA genes and host-genes
To address the mechanisms for the somewhat surprising finding that intragenic miRNA genes are less likely to be preserved than intergenic miRNA genes, we tested the hypothesis that the retention or loss of intragenic miRNA genes and their host gene are not independent. In a simplified model where intragenic miRNA genes and host gene fates were completely independent (i.e., no effect of genetic linkage and no transcriptional or functional associations), the probability that both are retained is 25%, the probability neither is retained is 25%, the probability only the miRNA gene is retained is 25%, and the probability only the host gene is retained is 25% (Fig. 3D). Results showed, however, significant deviations from this independent retention model (p = 1.77e-67, RGT) (Fig. 3D). Retention of both genes occurred significantly more often than expected by independent retention (50.2 ± 2.8% vs. 25%; p-adj = 1.99e-40, RGT) (Fig. 3D, Additional Table 8). The converse situation, the loss of both genes, also significantly differed from expected (32.2 ± 1.4% vs. 25%; p-adj = 0.0013, RGT) (Fig. 3D, Additional Table 8). Together, intragenic miRNA genes and their host genes shared the same fate in 82.4 ± 2.0% of the cases, significantly more often than by chance (vs. 50%; p = 1.88e-64, RGT) (Additional Table 8), with the co-retention situation occurring significantly more often than the co-loss situation (50.2 ± 2.8% vs. 32.2 ± 1.4%; p = 2.03e-5, RGT).Conversely, the alternative retention of intragenic miRNA genes and host genes was significantly lower than expected in a scenario of independent evolution: the miRNA gene was retained and the host gene was lost in only 5.4 ± 0.9% of the cases rather than the expected 25% (p-adj = 5.54e-38, RGT) (Fig. 3D, Additional Table 8), and the miRNA gene was lost while the host gene was retained in only 12.2 ± 2.1% instead of 25% of the situations (p-adj = 4.02e-14, RGT) (Fig. 3D, Additional Table 8). Together, intragenic miRNA genes and their host genes have different fates significantly less often than by chance (17.6 ± 2.0% rather than 50%, p = 1.88e-64, RGT) (Additional Table 8). Notably, the situation of a lost miRNA gene and a retained host gene occurred significantly more often than the opposite (12.2 ± 2.1% vs. 5.4 ± 0.9%; p = 0.0008, RGT) (Additional Table 8). This lack of independence is expected under the hypothesis that the fates of intragenic miRNA genes and
their host genes are related, likely through genetic linkage and potentially through biological function or biogenesis association.
Among the few cases of alternative retentions of intragenic miRNA genes and host genes,
mir338-2 provides an example shared by all studied teleosts (Fig. 2C). In gar, and presumably in the
TH-LCA, mir338-2 was on the same DNA strand and in an intron of the protein-coding gene lmtk2. In our four teleosts, however, the miRNA gene and the host gene were alternatively retained between the two ohnologous regions. In one ohnologous region, mir338-2 was retained along with many surrounding genes while the host gene was lost; in the second ohnologous region, the miRNA gene was lost while the host gene was retained also with multiple surrounding genes (Fig. 2C). In another case, both teleost copies of the gar host gene dnah3 appears to have been lost while the intragenic
mir135a was retained in duplicate in all three Acanthomorphs and as a singleton in zebrafish
(Supplemental File 4). Finally, mir103b, which is intronic in pank3 in gar and human, was found between different genes in teleosts (i.e., slc30a9 and grxcr1a in teleosts, and ctnna1 and sncb in gar) while pank3 was lost in teleosts (Supplemental File 4), suggesting that a translocation of a
pank3-mir103b genomic region between slc30a9 and grxcr1a in early teleosts preserved the miRNA gene
but not the host gene. All other cases of decoupled miRNA gene and host gene fate were species-specific, with for example, the alternative retention of the myomiR mir499 and its host gene myh14 that occurred independently in medaka and stickleback (Bhuiyan et al. 2013).
Having shown that the retention of miRNA genes and host genes was not independent, we questioned the fate of miRNA genes when their host gene was retained or lost, and the reciprocal. When the host gene was retained, the intragenic miRNA gene was also retained 80.4 ± 3.5% of the time, while when the host gene was lost, the intragenic miRNA gene was retained significantly less frequently, in only 14.4 ± 2.4% of the cases (p < 2.2e-16, CMHT) (Fig. 3E, Additional Table 9).
Reciprocally, when the miRNA gene was retained, the host gene was also retained 90.3 ± 2.4% of the time, while when the miRNA gene was lost, the host gene was retained significantly less frequently, in only 27.3 ± 2.7% of the cases (p < 2.2e-16, CMHT) (Fig. 3E, Additional Table 9). These results confirm that the fates of intragenic miRNA genes and of the host genes are evolutionarily associated. Furthermore, we found that the retention of the miRNA gene when the host gene was kept was significantly less frequent than the retention of the host gene when the miRNA gene was kept (80.4% vs. 90.3%; p = 0.0002, CMHT) (Fig. 3E, Additional Table 9). Similarly, the retention of the miRNA gene when the host was lost was significantly less frequent than the retention of the host gene when the miRNA gene was lost (14.4% vs. 27.3%; p = 0.0003, CMHT) (Fig. 3E, Additional Table 9). This result could be explained by the genetic linkage mechanism that intragenic miRNA genes probably depend on the host protein-coding gene’s regulatory network more than the host gene
depends on the miRNA gene regulatory network. In addition, due to the physical overlap of the two genes, the loss of a host gene by deletion might alter the regulatory elements of the miRNA gene and/or simultaneously delete the part of the protein-coding gene in which the miRNA gene resides. In contrast, the loss of an intronic miRNA gene by the remodeling of the intron might have only limited or no impact on the regulation or the preservation of the host gene, enabling the host gene to persist in the absence of the miRNA gene. In addition to genetic linkage between intragenic miRNA genes and hosts genes, an exciting but still speculative mechanism behind that observation could be that intragenic miRNA genes and host genes function cooperatively as suggested by other analyses (Lutter et al. 2010; Mandemakers et al. 2013; França et al. 2016; Boivin et al. 2018), including pathological situations (Hinske et al. 2010; França et al. 2017; Liu et al. 2019). This evolutionary association calls for additional large-scale co-expression studies of intragenic miRNA genes and their host genes to uncover whether cooperative modes of action of the miRNA gene and host gene pair in developmental, physiological, or pathological contexts, or if the related fates of intragenic miRNA genes and host genes only rely on genetic linkage devoid of functional association.
Evolution of miRNA expression patterns across species and organs
Conservation of organ-enriched miRNAs in brain and heart
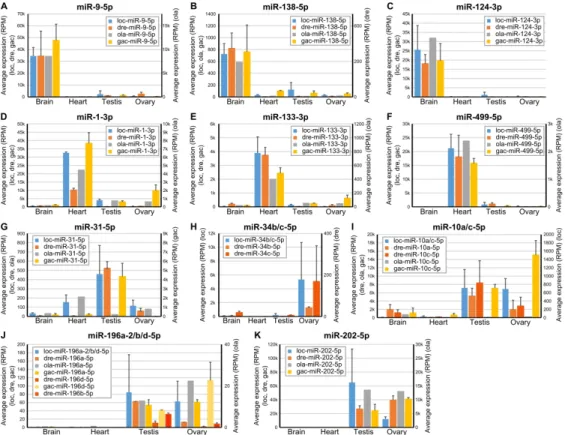
The hypothesis that miRNAs perform evolutionarily conserved functions in development predicts not only that miRNA genes would be well preserved after the TGD as shown above, but also that miRNA expression patterns, which reflect their functions, would also be well conserved after the TGD. To test this prediction, we reanalyzed smallRNA sequencing data from gar, zebrafish, and stickleback from adult brains, heart ventricles, ovaries, and testes, all using the same number of biological replicates, library preparation protocol, and sequencing platform (Braasch et al. 2016; Desvignes et al. 2019) and added smallRNA sequencing data available for the same organs from medaka, although they provide a single sample per organ and were generated using a different library preparation protocol (Gay et al. 2018).
To analyze organ-specific enrichment of miRNAs in spotted gar, we followed the expression of mature miRNAs that displayed an overall expression of at least 5 Reads-per-Million (RPM) averaged over the entire dataset; 284 of the 329 gar miRNAs that Prost! detected (86.3%) met this criterion. Organ pairwise differential expression analysis using DESeq2 (Love et al. 2014)showed that the brain displayed the greatest number of differentially expressed (DE) miRNAs among the four studied organs; the gonads (testis and ovary) displayed the fewest DE miRNAs and showed the largest intra-group variability (Fig. 4A-B), in agreement with previous findings for zebrafish and stickleback
(Desvignes et al. 2019). Across the six pairwise DE analyses of the four organs, 42 miRNAs were consistently over-expressed in the gar brain compared to each of the three other organs, and 30, 12, and 10 miRNAs were consistently over-expressed in the heart, ovary, and testis, respectively (Fig. 4C, Additional File 8 and 9). Because gar testis and ovary each showed few organ-enriched miRNAs, we looked at miRNAs that were over-expressed in both testis and ovary compared to heart and brain; these miRNAs might be implicated in shared gametogenesis processes like meiosis and cell proliferation. This approach revealed 20 additional miRNAs, bringing the total number of miRNAs that were enriched in one or both gonads to 42 (Additional File 9). Together, 114 miRNAs (i.e., 40% of the 284 minimally expressed miRNAs) displayed organ enrichment in either brain, heart, testis, ovary, or both gonads (Fig. 4C). This result shows that miRNAs in gar display many organ-enriched miRNAs as previously shown for zebrafish and stickleback (Desvignes et al. 2019). More organ-enriched miRNAs would likely be identified with the study of more organs and with additional biological replicates to increase statistical power.
The hypothesis that miRNA functions were conserved in evolution predicts that organ-enriched miRNAs in gar would tend to be enriched in the same organs in teleosts. To test this prediction, we compared the organ-enriched miRNAs in gar to the organ-enriched miRNAs in zebrafish and stickleback. Note that, because mature miRNAs from some ohnolog or other paralog miRNA genes have identical sequences, it was not always possible to assign locus origin unambiguously. We thus considered mature miRNAs to be orthologous between gar and teleost species if they could
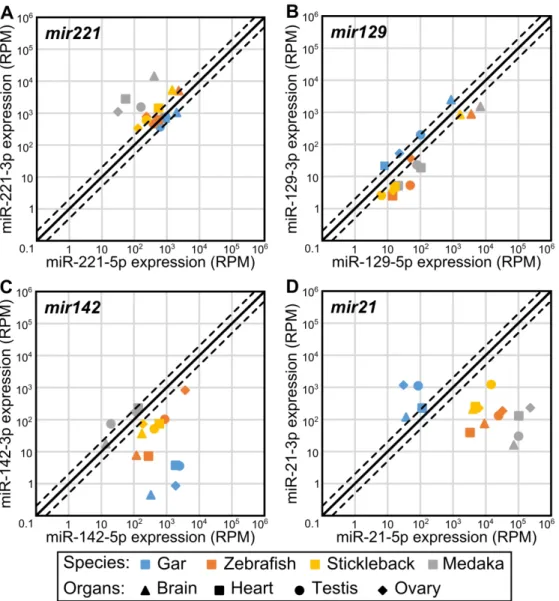
originate from orthologous genes even if their sequence could also originate from other loci that are not orthologous. The comparison of organ-enriched miRNAs between the three species revealed that 50% (21 of 42) of the brain-enriched gar miRNAs had at least one orthologous miRNA that was also brain-enriched in both zebrafish and stickleback (Fig. 4C, Additional File 9), with many, such as miR-9-5p, miR-124-3p, and miR-138-5p (Fig. 5A-C), already known to be brain-associated miRNAs in several fish species (Kitano et al. 2013; Vaz et al. 2015; Andreassen et al. 2016; Desvignes et al. 2019) and to be necessary for nervous system development in metazoans (Miska et al. 2004; Makeyev et al. 2007; Leucht et al. 2008; Cheng et al. 2009; Christodoulou et al. 2010; Yoo et al. 2011; Coolen et al. 2012; Jung et al. 2012; Ludwig et al. 2016). Eight of 42 gar brain-enriched miRNAs (19%) were brain-enriched only in gar (Additional File 9). However, 13 brain-enriched miRNAs in gar (31%) were brain enriched in either zebrafish or stickleback (Additional File 9). Together, 34 of the 42 (81%) gar brain-enriched miRNAs were brain-enriched in either or both zebrafish and stickleback.
While gar miR-2188-5p was not enriched in any organ, we observed frequent A-to-I edition of its seed sequence at nucleotides 2 and 8, with organ-specific editing rates highest in the brain (23.6% in brain compared to 12.9%, 13.3%, and 13.7% edition in heart, ovary, and testis, respectively). The
same pattern of brain-enriched seed sequence editing of miR-2188-5p was previously observed in zebrafish and stickleback and was shown to dramatically alter the sets of predicted targets in each species, revealing the potential importance of specific miRNA post-transcriptional editing in evolution (Desvignes et al. 2019).
The heart ventricle also displayed a substantial number of evolutionarily-conserved, organ-enriched miRNAs, with 27% (8 of 30) of gar heart-organ-enriched miRNAs being also heart-organ-enriched in both zebrafish and stickleback (Fig. 4C, Additional File 9). Heart-enriched miRNAs included well-described myomiRs, such as miR-1-3p, miR-133-3p, and miR-499-5p (Fig. 5D-F), which are crucial regulators of muscle formation and function (Sokol and Ambros 2005; Chen et al. 2006; Zhao et al. 2007; Mishima et al. 2009; Christodoulou et al. 2010; Lin et al. 2014; Horak et al. 2016; Ludwig et al. 2016) and the erythromiR miR-451-5p necessary for maturation of red blood cells (Pase et al. 2009; Cifuentes et al. 2010; Rasmussen et al. 2010; Yang et al. 2010), many of which were likely present in the heart ventricle at the time of RNA extraction. While 13 of 30 gar enriched miRNAs (43%) were enriched only in gar (Additional File 9), nine of 30 gar enriched miRNAs (30%) were enriched in either stickleback or zebrafish (Additional File 9). Together, 17 of the 30 (57%) gar heart-enriched miRNAs were heart-heart-enriched in either or both zebrafish and stickleback.
Poor evolutionary conservation of organ-enriched miRNAs in gonads
The hypothesis that microRNAs also perform functions in phenotypic evolution predicts that the expression patterns of miRNAs enriched in organs showing great interspecies variability would change after the TGD or in a lineage-specific manner. Gonads are an interesting model to study the role of miRNAs in diversification because fishes display a wide variety of reproductive features, including different sex determination mechanisms and modes of reproduction (Devlin and Nagahama 2002; Wootton and Smith 2014; Ortega-Recalde et al. 2020).
Supporting the hypothesis that gonad miRNAs evolve with reproductive features in lineage-specific ways – and in striking contrast to brain and heart-enriched miRNAs – conservation of organ-enrichment for miRNAs in gonads was poor. Our expression analysis identified ten testis-enriched miRNAs in gar, but none were testis-enriched in either zebrafish or stickleback (Additional File 9). We had previously identified a single miRNA, miR-31a-5p, that was testis-enriched in both zebrafish and stickleback (Desvignes et al. 2019). In gar, although miR-31-5p was not statistically testis-enriched, it was predominantly expressed in testis compared to the other tissues (Fig. 5G), while in medaka, miR-31-5p expression in testis was low compared to other organs (Fig. 5G). These observations suggest a conserved function of miR-31-5p in fish testis physiology that was lost in medaka.
For ovary-enriched miRNAs, 12 were significantly enriched compared to the other three organs in gar. Among these 12, eight were ovary-enriched only in gar, four were also ovary-enriched in zebrafish (miR-34b-3p, miR-34b/c-5p, miR-34c-3p, and miR-429-3p), and none were enriched in the stickleback ovary (Additional File 9). Interestingly, gar mir34b and mir34c compose a cluster that was retained in a single copy in zebrafish and lost in the acanthomorphs stickleback and medaka.
Zebrafish miR-34b-5p and miR-34c-5p, which are co-orthologs of gar miR-34b/c-5p, both displayed an ovary-enriched expression pattern, but with expression levels 128 and 32 times less in zebrafish than in gar, respectively (Fig. 5H). Apparently, zebrafish retained the miRNA genes but with greatly diminished relative expression, while acanthomorphs lost these genes entirely. Dysregulation of human MIR34 genes is associated with various cancers including ovarian cancer (Corney et al. 2010; Jia et al. 2019), for which a treatment using miR34 mimics was the first miRNA-based therapy to enter Phase 1 clinical trials (Agostini and Knight 2014; Zhang et al. 2019), suggesting a deep ancestral function of mir34 genes in ovarian function that was reduced or entirely lost in teleosts.
Twenty gar miRNAs were enriched in both testis and ovary compared to gar heart and brain. Among these 20 miRNAs, six were also enriched in either testis, ovary, or both gonads in both zebrafish and stickleback (Fig. 4C, Additional File 9). Among the six miRNAs displaying gonad enrichment in all three species, two of the gar miRNAs, miR-10a/c-5p and miR-196a-2/b/d-5p, originate from miRNA genes located in Hox clusters. miR-10a/c-5p was equally enriched in both gar gonads while zebrafish co-orthologs miR-10a-5p and miR-10c-5p (Woltering and Durston 2006) showed strongest expression in gonads with a testis-enrichment statistically significant for miR-10c-5p (Fig. 5I). In medaka and stickleback, mir10a was lost, but miR-10c-miR-10c-5p showed enrichment in the ovary with moderate expression in testis in stickleback, while miR-10c-5p expression was almost null in all tested organs in medaka (Fig. 5I). This observation suggests an evolutionarily conserved
function of miR-10-5p miRNAs in gonads that was secondarily lost in medaka.
The Hox cluster miRNA gene family mir196 also showed gonad-enriched expression. In gar, the same mature miRNA sequence can be produced by two paralogous genes (miR-196a-2/b/d-5p from
mir196a-2/d and mir196b) and orthologous mature miRNAs can originate from the three
ohnologous genes in zebrafish (mir196a-2, mir196b, and mir196d) and two in stickleback (mir196a-2 and mir196d), as well as an additional paralogous gene (mir196a-1) that is not orthologous to either of the two gar genes. We can nonetheless cautiously observe that gar miR-196a-2/b/d-5p appeared to be equally enriched in testis and ovary, which was similar to the expression pattern of miR-196a-5p in stickleback and in medaka (Fig. 5J). In zebrafish, all three miR-196-miR-196a-5p sequences (miR-196a-miR-196a-5p, miR-196b-5p, and miR-196d-5p) were enriched primarily in testis. In contrast, miR-196d-5p in
stickleback was enriched in ovary with substantial expression in testis (Fig. 5J). Together, these expression patterns point at an underlying role of the mir196 gene family in reproductive function that evolved in a lineage-specific manner towards one or the other gonad type.
The well-known gonad-enriched miR-202-5p was predominantly expressed in both gonads in all studied species (Fig. 4C, 5K), confirming a broadly conserved role in gonadal biology (Wainwright et al. 2013; Zhang et al. 2017; Gay et al. 2018).
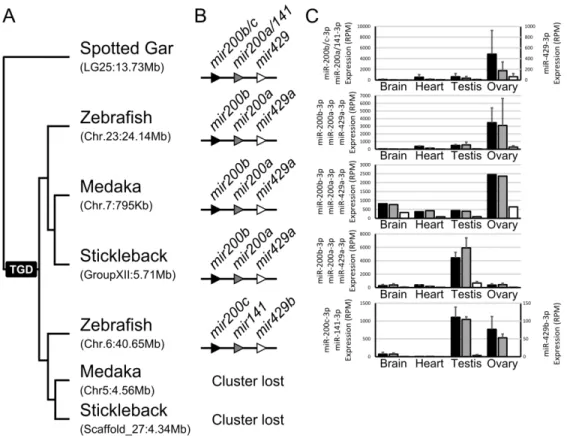
The last two cases of conserved gonad expression enrichment correspond to members of the
mir8 gene family (Fig. 5C, Fig. 6, Additional File 9). The gar mir8 gene family is composed of three
genes, mir200b/c, mir200a/141, and mir429 (Kozomara and Griffiths-Jones 2013) organized in a single cluster. In gar, major products of all three genes displayed similar expression patterns, with strongest expression in the ovary (Fig. 6). In zebrafish, the cluster was retained in duplicate but in acanthomorphs, the cluster was retained as a singleton. Zebrafish and medaka preserved an expression pattern with enrichment in the ovary; in contrast, the clustered miRNAs in stickleback displayed significant enrichment in testis, with only weak expression in ovary (Fig. 6). In zebrafish, miRNAs from the ohnologous cluster that was subsequently lost in acanthomorphs displayed comparable expression in both gonads, however, at lower expression levels than the ohnolog that was retained in all teleosts (Fig. 6). Together these results suggest that all the miRNA genes in the cluster are transcribed together in a single transcript and that the mir8 family as a whole is
important for fish reproduction. This conclusion is in agreement with the fact that members of the
mir8 family were found to be essential for reproduction and reproductive success in both mouse and
mosquito (Hasuwa et al. 2013; Lucas et al. 2015) and to be implicated in human ovarian cancer (Koutsaki et al. 2017), suggesting a pre-vertebrate origin of a function of the mir8 gene family in reproduction.
These results confirmed previous observations that, although many miRNAs have crucial roles at all stages of gonadal physiology (e.g., Bizuayehu and Babiak 2014; Reza et al. 2019; Bhat et al. for reviews), miRNAs enriched in gonads seem to have relatively unstable expression patterns among fish species (Desvignes et al. 2019). Factors that contribute to this lack of conservation could include diversity of genetic sex determination systems, reproductive behaviors, or reproductive modes among teleost lineages (Devlin and Nagahama 2002; Wootton and Smith 2014; Ortega-Recalde et al. 2020). For example, the diversity in ovarian development types ranging from asynchronous in medaka and zebrafish to group-synchronous in gar and stickleback as well as the time of sampling during the day in zebrafish and medaka and season of the year in gar could dramatically impact the
organ’s smallRNA transcriptome by having oocytes at different stages and in different proportions in our samples.
Together, these expression data across four tissues revealed that miRNAs displaying a well-defined expression pattern in one species tend to conserve this expression pattern in other species, especially in organs that perform similar tasks through evolutionary time (i.e., the vertebrate brain and heart ventricle among our organs), suggesting functions of miRNAs in phenotypic and
developmental canalization. In contrast, miRNAs strongly expressed in gonads, which have many rapidly evolving functions, tend to show less conservation of expression patterns across species, suggesting involvement of miRNAs in the diversification of these phenotypes. The study of more non-teleost and teleost species with contrasting organismal morphologies and reproductive physiologies as well as the study of the co-evolution of targets and miRNAs should be performed to decipher the role of miRNAs in phenotypes stabilization and diversification throughout evolution.
Major strands displayed greater sequence conservation than minor strands
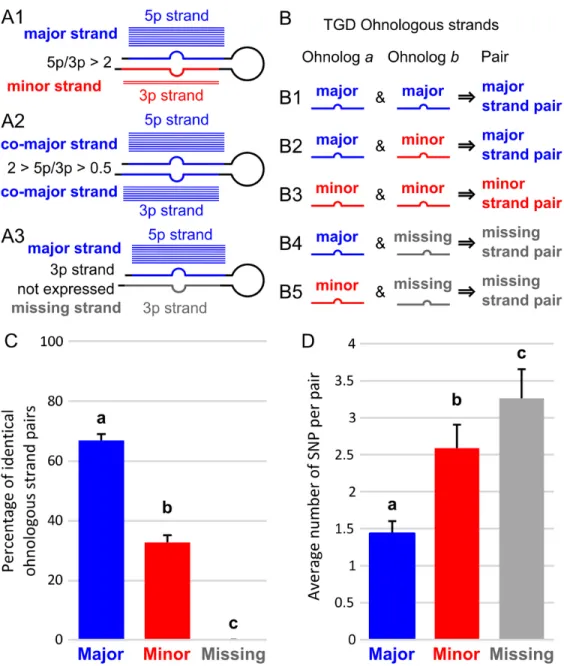
The hypothesis that miRNAs have conserved functions after the TGD predicts that the most functionally important of the two mature miRNAs derived from each miRNA gene would experience the least sequence divergence comparing ohnologs within a species. To test this prediction, we focused in each species on miRNA genes retained in ohnologous pairs after the TGD. In each of the four teleosts, each miRNA gene was analyzed for the relative overall expression levels of 5p and 3p strands and each strand was assigned to one of four categories: 1) Major strands (sometime called “dominant” or “guide” strands), which are strands that are expressed at average levels more than twice as much as their complementary strands (a cut off favored by the field (Fromm et al. 2015)) (Fig. 7A1); 2) Co-major strands (sometime called “co-dominant” strands), which are expressed at average levels less than two fold differently (Fig. 7A2); 3) Minor strands (sometime called“passenger” or “star” strands), which are strands that are expressed at average levels less than half the amount of their complementary strands (Fig. 7A1); and 4) Missing strands, which are strands that were not expressed in our datasets or any public annotation databases that we examined (Fig. 7A3). A few miRNA genes that had no expression for either strand were discarded because they might represent pseudogenized genes that would be under different selective pressure. Each pair of ohnologous strands within each species was then categorized as: 1) major strand pair when at least one of the corresponding strands from the two ohnologs is a major or co-major strand (Fig. 7B1, B2); 2) minor strand pairs when both strands are minor strands for both ohnologs (Fig. 7B3); or 3) missing strand pairs when a corresponding strand is missing in one of the two ohnologs (Fig. 7B4, B5). Note that because the cases of corresponding strands being major or co-major in one hairpin and minor in
its ohnologous hairpin (Fig. 7B2) were rare and were not observed in all species, a specific category was not created for these few cases and these pairs were qualified as major strand pairs. This categorization led to sets of ohnologous miRNA pairs composed on average across all four teleost species of 78 ± 7 major strand pairs, 54 ± 9 minor strand pairs, and 13 ± 4 missing strand pairs (Additional Table 10).
We first asked how often sequences of corresponding strands in ohnologous miRNA genes remained identical to each other or evolved at least one single nucleotide polymorphism (SNP) that differentiates them. Results showed that most (66.9%) of the mature strands of major strand pairs were identical to one another in sequence and fewer were different (33.1%, p = 2.00e-7, RGT) (Fig. 7C, Additional Table 10). In contrast, minor strand pairs were more likely to have evolved sequences different from each other than to have preserved identical sequences (only 32.8% identical
sequences vs. 67.2% different, p = 3.46e-5, RGT) (Fig. 7C, Additional Table 10). For strand pairs that had a strand missing from expression data, we compared sequences of the expressed strand with the sequence of the corresponding strand of the ohnolog assuming that it would have been
processed into a mature product with the same Dicer and Drosha cutting sites. Missing strand pairs displayed sequences different between the two ohnologs in 100% of the cases across all species (Fig. 7C, Additional Table 10). These results are predicted by the hypothesis that major strands are under more evolutionary constraints than minor strands or strands with expression levels undetectable in the organs sampled.
Among ohnologous pairs that have different sequences, we queried the number of SNPs differentiating each pair. Results showed that major strand pairs with different sequences displayed on average 1.4 SNPs, while minor strands pairs with different sequences had on average almost twice as many SNPs per pair (2.6 SNPs on average, Fig. 7D, Additional Table 10), significantly more than major strand pairs (p-adj = 2.50e-6, AOV). Missing strand pairs accumulated even more SNPs, 3.3 SNPs per pair (Fig. 7D, Additional Table 10) (p-adj < 1.00e-7 and p-adj = 0.0407 compared to major and minor strand pairs respectively, AOV). These results demonstrate that the most highly expressed strands of miRNA genes were under purifying selection for sequence conservation and that minor strands were under more relaxed purifying selection. In contrast, strands missing from our expression data experienced even more relaxed selection for sequence conservation, potentially only constrained to preserve folding of the precursor miRNA, which is crucial for biogenesis of the major strand (Fromm et al. 2015).
Sequence conservation between TGD ohnologs identifies functional parts of
mature miRNAs
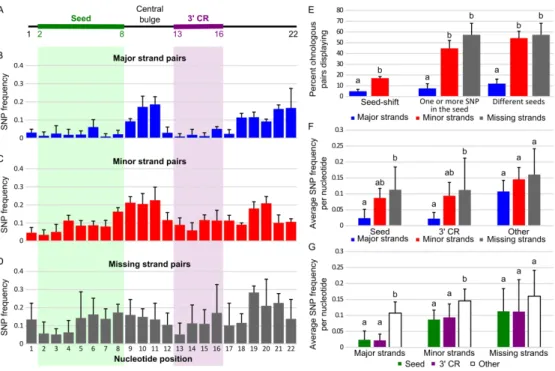
The hypothesis that miRNAs have conserved functions after the TGD predicts that fewer SNPs would affect the functional portions of the mature miRNA molecule, such as the seed (nucleotides 2 to 8 of the mature miRNA, Fig. 8A), compared to less functional portions of the miRNA, so we checked whether the SNP distribution between ohnolog pairs was uniform across the mature miRNA.
First, results showed significantly fewer cases of seed-shift (i.e., alternative cutting of the 5’ end of the miRNA) in major strand pairs compared to minor strand pairs (4.9% vs 17.1%, p = 0.0077, CMHT) (Fig. 8E). Excluding these seed-shifted pairs, major strand pairs displayed significantly less frequently SNPs in seed sequences compared to minor strand pairs (i.e., one or more SNPs in the seed) (7.5% vs 44.8%, p-adj = 1.48e-08, CMHT) (Fig. 8E). Together, major strand pairs displayed significantly fewer changes (12.0%) affecting their seed (i.e., seed-shift or seed SNPs) compared to minor strand pairs (54.2%, p-adj = 1.75e-10, CMHT) and to missing strand pairs (57.4%, p-adj = 1.48e-06, CMHT). Missing strand pairs displayed levels of different seeds comparable to minor strand pairs (p-adj = 0.9036, CMHT) (Fig. 8E).
To examine other parts of the molecule, we analyzed miRNA ohnolog evolution at the nucleotide level across the entire length of the mature miRNA. For each ohnologous miRNA pair in each of the four species, we recorded SNP positions, then averaged frequencies across all four species (Fig. 8B-D). Overall, major strands displayed a pattern of low SNP frequency in the seed but also in the 3’ complementary region (3’CR) compared to the central bulge and the 3’ end (Fig. 8B). Notably, while the 3’CR is proposed to be restricted to nucleotides 13 to 16 (Bartel 2018; Bofill-De Ros et al. 2019; Sheu-Gruttadauria et al. 2019), we observed that nucleotides 12 and 17 also displayed SNP frequencies as low as nucleotides of the 3’CR, suggesting that the full stretch of nucleotides 12 through 17 may be important in the 3’CR function. In contrast, in minor and missing strand pairs, SNPs were distributed throughout the molecule (Fig. 8C-D). Major strand pairs showed lower SNP frequencies per nucleotide in their seeds compared to minor strand pairs, although not significantly lower (Fig. 8F, p-adj = 0.0562, AOV), similar to previous qualitative reports (Wheeler et al. 2009; Fromm et al. 2015). Major strand pairs, however, displayed significantly lower SNP frequencies per nucleotide in their seed compared to missing strand pairs (Fig. 8F; p-adj = 0.0102, AOV). Similarly, major strand pairs showed lower SNP frequencies per nucleotide in their 3’CR compared to minor strand pairs, although not significantly lower (Fig. 8F, p-adj = 0.0549, AOV) but