HAL Id: hal-02428598
https://hal-utt.archives-ouvertes.fr/hal-02428598
Submitted on 17 Nov 2020HAL is a multi-disciplinary open access archive for the deposit and dissemination of sci-entific research documents, whether they are pub-lished or not. The documents may come from teaching and research institutions in France or abroad, or from public or private research centers.
L’archive ouverte pluridisciplinaire HAL, est destinée au dépôt et à la diffusion de documents scientifiques de niveau recherche, publiés ou non, émanant des établissements d’enseignement et de recherche français ou étrangers, des laboratoires publics ou privés.
Local Optical Chirality Induced by Near-Field Mode
Interference in Achiral Plasmonic Metamolecules
Andreas Horrer, Yinping Zhang, Davy Gérard, Jeremie Béal, Mathieu Kociak,
Jerome Plain, Renaud Bachelot
To cite this version:
Andreas Horrer, Yinping Zhang, Davy Gérard, Jeremie Béal, Mathieu Kociak, et al.. Local Optical Chirality Induced by Near-Field Mode Interference in Achiral Plasmonic Metamolecules. Nano Letters, American Chemical Society, 2020, 20 (1), pp.509-516. �10.1021/acs.nanolett.9b04247�. �hal-02428598�
Local optical chirality induced by near-field mode
interference in achiral plasmonic metamolecules
Andreas Horrer †, Yinping Zhang †, Davy Gérard *,†, Jérémie Béal†, Mathieu Kociak ‡, Jérôme
Plain† and Renaud Bachelot †,§
† Light, Nanomaterials, Nanotechnologies (L2n), Institut Charles Delaunay, CNRS, Université de
Technologie de Troyes, France
‡ Laboratoire de Physique des Solides, Bâtiment 510, UMR CNRS 8502, Université Paris Sud,
Orsay 91400, France
§ Sino-European School of Technology, Shanghai University, 20444 Shanghai, China
ABSTRACT. When circularly polarized light interacts with a nanostructure, the optical response
depends on the geometry of the structure. If the nanostructure is chiral (i.e. it cannot be
superimposed on its mirror image) then its optical response, both in near-field and far-field,
depends on the handedness of the incident light. In contrast, achiral structures exhibit identical
far-field responses for left- and right-circular polarization. Here, we show that a perfectly achiral
nanostructure, a plasmonic metamolecule with trigonal D3h symmetry, exhibits a near-field
response that is sensitive to the handedness of light. This effect stems from the near-field
interference between the different plasmonic modes sustained by the plasmonic metamolecule
under circularly polarized light excitation. The local chirality in a plasmonic trimer is then
experimentally evidenced with nanoscale resolution using a molecular probe. Our experiments
demonstrate that the optical near-field chirality can be imprinted into the photosensitive polymer,
turning the optical chirality into a geometrical chirality that can be imaged using atomic force
microscopy. These results are of interest for the field of polarization-sensitive photochemistry.
KEYWORDS. Chirality, plasmonic metamolecules, chiral plasmonics, photopolymers, circular
Chirality, following Lord Kelvin’s definition, refers to the property of an object that cannot be
brought into congruence with its mirror image. The study of the interaction of light with chiral
structures is now a two-century-long story, that can be traced back to seminal experiments in early
19th century by Arago, Biot and Pasteur. The latter evidenced how the two enantiomers of tartaric
acid were acting on polarized light [1]. Actually, circularly polarized light can be thought of as
chiral light, exhibiting two mirrored forms, i.e. the left-circular (LCP) and right-circular (RCP)
polarizations. With the advent of nano-optics, artificial chiral nanostructures and metamaterials,
such as helices [2], spirals [3], ramps [4], assemblies of nanoparticles (either colloidal [5] or
lithographed [6]) and twisted stacks of nanorods arrays [7], have been developed. These structures
exhibit artificial optical activity or circular dichroism that can be orders of magnitude higher than
their natural counterparts and are tunable from the infrared to the visible region (see [8] for a recent
review). Chiral nanostructures can hence be used as circular polarizers [9], phase plates [10] or to
enhance chiroptical effects [11]. Of particular interest are two-dimensional (planar) chiral
nanostructure. Strictly speaking, no 2D structure can be chiral, as it would be chiral only in a 2D
universe. However, 2D-chiral structures do exhibit circular dichroism (i.e. their optical response
depends on the handedness of the light) and they can be used to enhance chiroptic effects thanks
to an effect known as super-chirality, or “chiral hot-spots” [12,13]. Planar chiral nanostructures
can also exhibit chirality in their non-linear response [14]. These effects are prominent in metallic
(plasmonic) nanostructures but can also appear in dielectric resonant nanostructures.
Optical chirality can also be observed in achiral structures [15,16,17]. In such structures,
chirality can appear due to the symmetry breaking brought by oblique illumination, a tilt of the
plane of the structure or off-axis polarization (extrinsic chirality) [18]. More surprisingly, optical
remarkable illustration of this effect has been recently reported by Zu and co-workers first in
V-shaped metal nanostructures and more recently in rectangular rods [19,20]. These resonators
sustain two plasmonic eigenmodes overlapping in energy and whose interference under circularly
polarized excitation induces an electromagnetic field distribution around the structure that depends
on the handedness of the excitation (the near-field intensity distributions under LCP and RCP
being mirror images). This effect has been called “hidden chirality” by Zu et al. to emphasize the
fact that the chirality in their system was not of geometrical origin. A very similar interference
effect was previously described by Abashal and coworkers, who demonstrated that an incoming
linear polarization could be converted into circular polarization using plasmonic antennas
sustaining two spectrally overlapping orthogonal modes [21].
In this Letter, we unveil optical chirality inside a highly symmetric plasmonic metamolecule (or
plasmonic oligomer). The system consists of three gold nanodisks (or “meta-atoms”) arranged as
an equilateral triangle. The near-field coupling between each individual meta-atom leads to
hybridized eigenmodes that can be described using group theory. At a specific wavelength, the
phase difference between the excited modes reaches 90°, which once added to the ±90° phase-shift
between the two linear components of circular polarization leads to handedness-dependent field
distribution around the oligomer. We then provide experimental evidence of this local optical
chirality with nanoscale imaging of the intensity distribution inside a plasmonic trimer. The
imaging method is based on an azobenzene nanomotor molecular probe and yields ~20 nm
resolution. A clear near-field contrast is experimentally evidenced between left- and right-circular
Figure 1. a) Schematic of the investigated plasmonic metamolecule. b) FDTD-simulated
extinction spectrum of the trimer (the spectrum is identical independently of the incoming
polarization). The blue and red vertical lines mark the position of the resonances. The yellow thick
line corresponds to the position where the modes overlap and interfere (λ=770 nm).
We start by presenting simulations of the structure under investigation, which is depicted in Figure
1a. It consists of three identical gold nanodisks forming an equilateral triangle. The diameter of
the disks is D = 140 nm, their height is 50 nm, they are separated by a gap distance g = 30 nm and
they are located on top of a glass substrate (refractive index n1 = 1.5). We assume that the
surrounding medium has an index of n2 = 1.4, in order to take into account the experimental
its far-field response is not sensitive to the handedness of the incident circular polarization. This
is evidenced by the simulated extinction spectrum of Figure 1b, which is independent of the
incident polarization. In contrast, the near-field response (i.e. the local electric field intensity) does
exhibit a sensitivity to the incident polarization. Figure 2 shows the computed near-field intensity
maps for the different polarizations: linear horizontal (Figure 2a), linear vertical (Figure 2b), and
both circular polarizations (Figure 2c-d). Intricate field distributions, associated with the
hybridization of the plasmonic excitations borne by each nanoparticle, are observed. What is more
surprising is the result for circularly polarized light, as the maps for LCP and RCP appear to be
different. Although the field distribution inside the gap is the same for both signs of the circular
polarization, the field in the outside part of the trimer clearly depends on the handedness of the
light, the lobes of higher intensity around each nanoparticle being “twisted” in the direction of the
polarization and following its sense of rotation. In contrast, the far-field spectrum is independent
of the polarization of the excitation. We therefore call this phenomenon local chirality, to stress
the fact that such chirality is confined to the near-field and cannot be observed in the far-field,
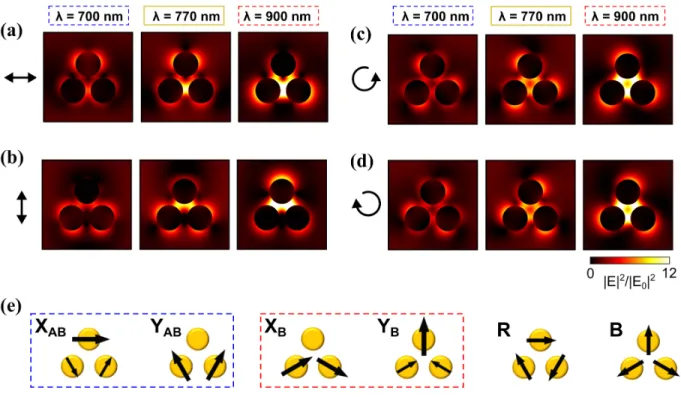
Figure 2. Near-field intensity maps for wavelengths of 700 nm, 770 nm, and 900 nm with an
excitation with a) X-polarization, b) Y-polarization, c) left circular polarization, and d) right
circular polarization. e) Dipole base modes of a D3h symmetric plasmonic trimer. The thickness of
the arrows corresponds to the strength of the electric dipole. XB (resp. XAB) corresponds to the
X-polarized bonding (resp. anti-bonding) mode (similar notations for Y-polarization). R is a rotation
(or azimuthal) mode and B the breathing (or radial) mode.
In order to analyze these results, we need the eigenmodes of the plasmonic oligomer. These
eigenmodes have been derived by Brandl et al. [22] using group theory. Neglecting the presence
of the substrate, the plasmonic trimer pertains to the D3h (ideal) point-group. The irreducible
representations of the D3h point-group can be used to obtain a set of symmetry adapted coordinates
(SACs). This means that these SACs form an orthogonal basis for the electromagnetic excitations
meta-atoms are represented in Figure 2e. The arrows indicate the dipole moment carried by each
nanoparticle. There are two modes with a total dipole moment in X-direction. In the limit of
uncoupled discs, they are energetically degenerate and add up to a dipolar excitation in X-direction
in each disc. For non-zero coupling strength the degeneration is lifted and the excitation at the
lower energy is referred to as a bonding mode (XB), while the mode at the higher energy is called
an antibonding mode (XAB). In the same way there are a bonding (YB) and an antibonding mode
(YAB) with a total dipole moment in Y-direction. The rotation (R) and breathing (B) excitations
exhibit zero total dipole moment and are therefore dark modes. This implies they will be weakly
excited using linear or circular polarizations. Each electromagnetic excitation of the plasmonic
trimer can hence be described using the four remaining SACs as an orthogonal basis. The peaks in
the extinction spectrum can be attributed to the degenerate bonding and antibonding modes in X-
and Y-directions. In the field maps in Figure 2a-b the SACs manifest themselves in the shape of
the near-field, with the lower energy bonding modes being predominantly present at 900 nm and
the antibonding modes at 700 nm.
Following Alegret et al. [23] it is possible to project any excitation of the plasmonic trimer onto
the SAC basis by assuming that each particle bears a single dipole moment. This dipole moment
can be retrieved from the FDTD calculations by using the following procedure: (i) Calculating the
complex surface charge distribution (from the divergence of the electric near-field) in a plane
located at mid-height of the meta-atoms ; and (ii) Vectorially adding all the charges in each disc
to get their respective dipole moment vectors. Animated versions of these dipole moment vectors
at 5 different wavelengths as a function of the phase are shown in the Supporting Information as
Movies 1-5, for LCP and RCP excitation. Their projection on the SAC basis yields their relative
P(λ) with six components, representing the complex dipole moments in x- and y-direction for each
of the three particles. Solving the linear equation ∑ 𝑐%(𝜆)𝑒"*+(,)(𝑺𝑨𝑪
%) = 𝑷(𝜆)
% , where 𝑺𝑨𝑪% is
the 6-dimensional vector associated with the base mode 𝑛, gives the coefficients as a function of the wavelength. Figure 3 shows the case for right circularly polarized excitation. Here all four
dipolar SACs contribute to the total particle polarization. The relative weights (Figure 3a) as well
as the relative phases (Figure 3b) of the SACs can be seen. Please note that we also computed the
weight of the dark modes R and B: their relative weight was found to be much weaker than the
bright modes (see Figure S1). Therefore, in the following we only consider the bright modes. The
two degenerate antibonding modes XAB and YAB have a stronger contribution at shorter
wavelengths, while the two degenerate bonding modes XB and YB are dominant for longer
wavelengths. Under circularly polarized excitation, there is a constant phase difference of ±π/2
between the perpendicular modes in X- and Y-direction (for instance between XB and YB).
Moreover, due to the different resonance wavelengths of the bonding and antibonding modes, there
is a certain wavelength range (corresponding to the dip in the extinction spectrum in Figure 1b)
where they have different relative phases (for instance between XB and XAB). This phase difference
depends on the coupling strength between the individual dipoles in the metamolecule. For the
trimer with the aforementioned dimensions, a maximum phase difference of about π/2 at a
wavelength of about 770 nm is observed. For perpendicular bonding and antibonding modes this
means that the total phase differences add up to about π between XB and YAB and to about 0
between YB and XAB for RCP (Figure 3b). In the other case, for LCP, the phase differences add
up to about 0 between XB and YAB and to about π between YB and XAB. This leads to mirrored
near-field profiles for LCP and RCP. For wavelengths above or below 770 nm the total phase
LCP and RCP excitation. To go further, we show in Figure 3c the near-field profiles and in Figure
3d the complex dipole moment vectors for each particle in the trimer at different wavelengths. The
dipole moments are depicted in a way proposed in [24]. The ellipses are the curves traced by the
tip of the dipole moment vector over one period, the phase being color-coded. An animated version
of the images can be found as Movie 6 in the Supporting Information. The relative contributions
and phase relations of the modes lead to different shapes of the ellipses at different wavelengths.
These polarization ellipses give the polarization state of each meta-atom of the plasmonic
metamolecule. In Figure 3, five different situations are shown. Starting from the lowest
wavelength (wavelength 1, λ= 600 nm), each particle exhibits an almost circularly-polarized
response. In this situation there is no phase difference between the antibonding and bonding modes
and the contributions of each mode are nearly equal. There is however a phase difference of ±π/2
between the perpendicular modes in X- and Y-direction, which comes from the circular polarized
excitation. This leads to dipole moments that rotate in phase along a circle in each disc (see also
Movie 1). As a consequence, the near-field profile is nearly equally distributed around the discs
in the trimer and the field maps look similar for RCP and LCP excitation. When the wavelength
increases, the polarization state becomes more and more elliptical. At a wavelength of λ=700 nm
(marked as (2) in the figure) the contributions of the two antibonding modes in X- and Y-direction
are dominant. Furthermore, there is a phase difference between the bonding and antibonding
modes which is in the range of 0 < Δφ < π/2. Consequently, the tip of each individual dipole moment is following an ellipse over one period in each disc. It should be noted that the phase for
the situation where the dipole moments are aligned with the major axis of the ellipse is shifted by
±2/3π for the three discs. The total dipole moment in the trimer is therefore following the rotation
Figure 3. (a) Relative contributions of the bonding modes XB and YB (black solid line) and the
antibonding modes XAB and YAB (light grey line) for RCP excitation. (b) Relative phases of the
perpendicular bonding and antibonding modes (XB) - (YAB) in black and 𝜑(YB) - 𝜑(XAB) in light
grey for RCP excitation. (c) Maps of the electric near-field intensity, (d) polarization ellipses and
(e) maps of the normalized optical chirality density 𝐶6 for RCP excitation at five different wavelengths. (f) Optical chirality density 𝐶6 computed at the center of the metamolecule under LCP and RCP excitation. (g) Maps of the electric field dissymmetry factor 𝑉 computed at five different wavelengths.
When λ=770 nm (wavelength 3), we can see a linear excitation in each disc (see also Movie 3).
This is the result of all modes contributing equally and a phase difference of π/2 between the
bonding and the antibonding modes. Together with the π/2 phase difference from the circular
polarized excitation this adds up to a total phase difference of π between XB and YAB and 0 between
YB and XAB, as described above. For LCP excitation it is vice versa (0 between XB and YAB and π
between YB and XAB), leading to a linear excitation in each disc, which is perpendicular to the one
with RCP excitation. For longer wavelengths (wavelengths (4) and (5) in the figure), the
contributions of the bonding modes are dominant and the polarization state of each meta-atom
becomes elliptical again. Note that the polarization ellipses under excitation with X, Y and LCP
polarizations for the same wavelengths can be found in Figure S2.
Then, we investigated the strength of the local chirality inside the oligomers. The optical chirality
(or optical chirality density) C is the most common quantity used to quantify near-field chirality
as it is related to the rate of excitation of chiral molecules [12,25]. It is defined as 𝐶 = −9:;
< 𝐼𝑚(𝑬
∗∙ 𝑩). Following Schäferling and coworkers, we subsequently normalized this value
using the corresponding value of a simulation without structure in order to obtain the optical
chirality enhancement 𝐶6± = 𝐶±/E𝐶
F±E, where the + and - signs refer to LCP and RCP, respectively
and 𝐶F is the value of the optical chirality without the metamolecule. Regions where |𝐶|H > 1 correspond to the so-called superchiral fields. Figure 3e shows maps of 𝐶6 for metamolecules with a gap size of 30 nm. The colormap has been chosen so that regions exhibiting superchirality appear
in color. We also plotted the value of 𝐶6 in the center of the structure as a function of the wavelength in Figure 3f. It is clear from these figures that we do not observe superchiral fields at short
wavelengths where each meta-atom bears a circular polarization. Superchirality increases with the
wavelength and reaches a maximum at 770 nm, where we also observe a clear contrast in the sign
of 𝐶6 between the center of the structure and the sides of the metamolecule. At this wavelength, the optical chirality in the gap is opposite to the chirality of the exciting wave (i.e. the chirality is
left-handed in the gap for RCP excitation). It is also interesting to note the change of sign of the
value of 𝐶6 at the center. For wavelengths below ~900 nm 𝐶6 is negative. This means the field is twisted in a direction opposite to the excitation polarization. On contrary for longer wavelengths,
the field is twisted in the same direction as the excitation. It can be related to the change of the
dominant modes inside the structure. When the dipoles in each meta-atom are oriented mostly
azimuthal, the chirality density in the center is positive, while when the dipoles are mostly radial,
it is negative. Interestingly, as the local chirality arises from an interference-based effect, its
strength (i.e. the value of the chirality density) can be tuned by controlling the interparticle distance
(see Figure S3).
The optical chirality 𝐶6 is proportional to both electric and magnetic fields. In order to quantify the chirality of the electric field only, it is possible to introduce a near-field contrast (or visibility) 𝑉 between RCP and LCP excitations. We define it similarly to Ref. [19] as the normalized difference
of the field intensities for LCP and RCP:
𝑉 =|𝐸LMN|
<− |𝐸 OMN|<
|𝐸LMN|<+ |𝐸OMN|<
The 𝑉 factor can be thought of as the local dissymmetry factor (g-factor) of the electric field intensity or, in other words, as the circular dichroism of the near-field intensity. Computed maps
g-factor reaches a maximum value of about 55% at λ = 770 nm (near the meta-atoms) while it is
only ~15% at λ = 600 nm and at λ = 1000 nm. The 𝑉 factor can quantify the chirality of interactions that depend mainly on the electric field intensity.
In order to experimentally demonstrate our numerical findings, we fabricated gold metamolecules
on a glass substrate using electron-beam lithography. We obtained well-defined nanostructures
with reproducible sizes and gap distances (see the SEM image in Figure 4a). Previous reports on
the experimental characterization of the optical near-field chirality relied on near-field optical
microscopy (SNOM) [17,26,27] and cathodoluminescence [20]. Here, we use a photosensitive
azobenzene-containing polymer (PAP) to unveil the spatial distribution of the optical intensity
around the plasmonic oligomer. Azobenzene molecules, such as disperse-red one (DR1), act as
molecular nanomotors under illumination: the absorption of a photon by the molecule yields a
change of conformation that induces a “worm-like” movement along the direction defined by its
transition moment. If the azobenzene is grafted to a polymer backbone (such as PMMA), then this
molecular movement leads to a large-scale displacement of matter, which can be tracked using
atomic force microscopy (AFM). Previous studies have demonstrated that the lateral resolution of
this technique is about 20 nm [28] and can map plasmonic hot spots [29]. Furthermore, PAP like
PMMA-DR1 are sensitive to the polarization state [30] and to the orbital angular momentum
carried by vortex beams [31]. A limitation of this characterization technique lies in the fact that
the PAP film must be excited at a wavelength located inside the absorption band of the DR1
molecule (in the green part of the visible spectrum, see Figure S4, blue curve). A way to
circumvent this issue is to use photon excitation. We recently demonstrated that under
two-photon excitation, PAP systems have the ability to map hot-spots inside plasmonic oligomers
is shown in Figure S4 (red curve). In the following, we apply this nanoscale characterization
technique to image the near-field chirality inside plasmonic metamolecules. Following the method
described in [32], the metamolecules were covered by a 45-nm-thick PMMA-DR1 film. An AFM
image (see Methods) of the PAP-covered nanostructures is shown in Figure 4b, as a reference of
the initial situation. An exemplary far-field reflection spectrum (normalized to the reflection of the
bare sample surface) recorded on an ensemble of PMMA-covered metamolecules is shown in
Figure 4c. The peaks associated with the excitation of the bonding and antibonding modes can be
clearly distinguished. A good agreement is found with the above simulated spectrum (Figure 1b).
Then, we illuminated the metamolecules using a weakly focused laser beam from a Ti:Sa laser at
λ=790 nm. This wavelength lies between the two peaks in the reflection spectrum in Figure 4c,
corresponding to the position where the local chirality is expected to be the highest. Note that this
wavelength does not match the maximum of two-photon absorption in the PAP film [32], but the
relatively low absorption coefficient observed at 790 nm is still sufficient to trigger matter
displacement, as it will be evidenced below. The laser beam is polarized either linearly or circularly
(using a linear polarizer and a quarter wave-plate). The quality of the generated circular
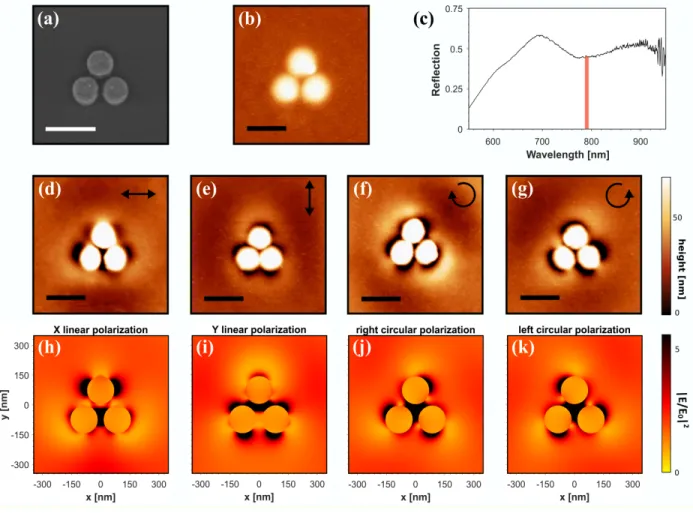
Figure 4. Experimental results: (a) SEM image of a gold metamolecule. (b) AFM image of the
metamolecule after PAP film deposition. (c) Exemplary reflection spectrum recorded on an
assembly of metamolecules. The thick red line marks the wavelength of the laser. (d-g) AFM
images of the plasmonic metamolecules after illumination using (d) X-polarized excitation ; (e)
Y-polarized excitation ; (f) RCP excitation and (g) LCP excitation. The scale bars on all images
are 300 nm. (h-i) simulated results of the modulus of the component of the electric field in the
direction of the corresponding excitation polarization. (h) |𝐸Q|< with X-polarized excitation ; (i)
E𝐸RE< with Y-polarized excitation ; (j) |𝐸S|< with RCP excitation; (k) |𝐸
The results for four different incident polarizations (linear horizontal, linear vertical, LCP and
RCP) are shown in Figure 4d-g, respectively. The images are the AFM topographical images
recorded after illumination with polarized light. Dark areas correspond to regions where matter
has escaped, indicating a higher in-plane local field intensity. Let us first focus on the linear
polarization excitation (Figure 4d-e). It should be noted that we do not observe matter displacement
only in the direction of the incident linear polarization, as one would expect if aligned dipoles were
excited in each nanoparticle inside the oligomer. In contrast, we observe a field map which is
linked to the dipole orientations of the SACs (due to the near-field coupling between the
meta-atoms). It was shown in [32] that the imprinted profile has the shape of the component of the
electric field oriented in the same direction as the excitation polarization. Therefore, below the
experimental results we show the simulated field maps of |𝐸Q| for X-polarization and E𝐸RE for
Y-polarization. A very good agreement is found with the AFM topography, in particular the depleted
regions in the AFM images (black regions) correspond well with the areas of high electric field,
while the elevations of the resist (in yellow) can be identified as the areas with relatively low
electric field. The image for Y-linear polarization (Figure 4e) exhibits a very good agreement with
the FDTD calculation of the electric field. A slightly less nice agreement is found for the
X-polarized case, which could be explained by small asymmetry in the fabricated structure (see
below).
Now we turn our attention towards the case of circularly polarized excitation. The images for RCP
and LCP excitation of the oligomer are presented in Figures 4e and 4f, respectively. They appear
to be different, showing that the PAP-covered metamolecule is sensitive to the handedness of the
incident light. A closer look at the figure shows that the two images are almost mirrored, in
emphasized that a bare PAP film is not sensitive to the light handedness [33]. This sensitivity stems
from the achiral oligomer, and the PAP film turns the near-field chirality into surface topography.
After illumination with chiral light, the achiral structure hence becomes geometrically chiral due
to the matter displacement. Interestingly, illuminating two initially identical oligomers with either
LCP or RCP leads to two structures that are mirror images of each other, i.e. enantiomers.
Following the same method as for linear polarization, we computed the components of the electric
field in the circular polarization basis. We hence calculated the component of the electric field with
LCP and RCP orientation using 𝐸± = 𝐸Q + 𝐸R ∙ 𝑒𝑥𝑝 W±𝑖Y
<Z. Again, a nice agreement with the
experiment is found, with slight discrepancies. The difference between the experimental and
simulated near-fields can be accounted to slight asymmetry of the shape of the discs and their
positions in the trimer. In such a case, the orientation of the dipoles in the base modes would
change [34], due to the lifted degeneracy of the X- and Y-modes and a larger contribution of the
rotation and breathing modes. This would lead to a different field distribution. Another possible
source of asymmetry is the incident excitation, especially an imperfect (slightly elliptical)
polarization state and/or a weak angle of incidence. As the near-field chirality stems for an
interference effect, it is expected to be highly sensitive to any change in the excitation state. Let
us also emphasize that the same behavior was observed over several different fabricated oligomers
and the results are reproducible (see Figure S5). Altogether, our results confirm that the PAP film
is sensitive to the electric field, in agreement with previous reports [28-32]. While the
photochemical imaging system is not able to image the optical chirality C, it is sensitive to the
near-field dissymmetry.
To conclude, we have shown how the near-field interference between the modes supported by a
coupling between the individual meta-atoms. This phenomenon has then been experimentally
measured using a photosensitive polymer as a molecular probe of the optical chirality. The
experiments unveiled a clear dependence of the near-field response of the metamolecule upon the
handedness of the incident light, leading to a clear field dissymmetry. Furthermore, this
near-field dissymmetry is imprinted into the polymer film, efficiently transforming the optical chirality
into geometrical chirality – the initially achiral structure becoming chiral after interaction with
chiral light. Besides their potential to image and analyze the local chirality with a resolution on the
nanometer scale, our results are of interest for the field of chiral photochemistry, including
nanofabrication [36] and hot electron generation [37] driven by circularly polarized light.
METHODS
Numerical simulations. All simulations were performed using a commercial solution based on the
finite difference time-domain method (FDTD Solutions from Lumerical Solutions).
AFM imaging. AFM images were recorded using a Veeco Bioscope II AFM microscope working
in tapping mode and equipped with sharp tips (Nanosensors PPP-NCLR probe, with tip radius <
10 nm). A typical image size was 5 × 5 µm2 and the scan rate was set to 0.5 Hz.
Photosensitive azobenzene-containing polymer film illumination. The PMMA-DR1 film was
excited using a femtosecond Ti:Sa laser emitting at λ=790 nm (pulse duration ~200 fs). The beam
was polarized using a linear polarizer, completed by a quarter-wave plate oriented at ±45° of the
slightly focused using a 10x, NA=0.3 objective lens. The average power density was 700 mW/cm2
and the exposure time was 60 s.
ASSOCIATED CONTENT
The following files are available free of charge.
Supplementary information: Figures S1, S2, S3, S4 and S5 (PDF)
Movies 1-5 : movies showing the individual dipole moments of each meta-atom (thick arrows)
and the total dipole moment of the metamolecule (thin arrow) vs. the phase for five different
wavelengths: λ=600nm (Movie 1) ; λ=700nm (Movie 2) ; λ=770nm (Movie 3) ; λ=900nm
(Movie 4) ; λ=1000nm (Movie 5). (avi)
Movie 6 : movie showing the polarization ellipses inside the meta-atoms vs. the wavelength (avi)
AUTHOR INFORMATION
Corresponding Author
*davy.gerard@utt.fr
Author Contributions
AH performed all numerical simulations. YZ performed all experiments. AH, DG and MK
proposed the near-field mode interference model. DG and AH wrote the manuscript. JB fabricated
the sample. JP and RB defined and supervised the project. All authors discussed the results and
contributed to the manuscript.
Agence Nationale de la Recherche, under grants ANR-17-CE24-0039 (2D-CHIRAL),
ANR-13-BS10-0013-03 (NATO), ANR-15-CE24-0036-01 (ACTIVE-NANOPHOT).
ACKNOWLEDGMENT
We would like to thank the anonymous reviewers of our manuscript for their valuable comments
and suggestions. We also thank Frédéric Laux for his help on FDTD simulations. DG and MK are
most grateful to Prof. Brouilly for his insights about chirality. YZ was supported by a PhD grant
from the Chinese Scholarship Council. The plasmonic metamolecules were fabricated in the
Nano’mat Platform (www.nanomat.eu), which is supported by the Ministère de l’enseignement
supérieur et de la Recherche, the Région Grand Est, the Conseil Général de l’Aube and FEDER
funds from the European Community. This work was also partially supported by the HPC Center
of Champagne-Ardenne ROMEO.
ABBREVIATIONS
DR1, disperse red 1; PMMA, Poly(methyl methacrylate); RCP, right-handed circular polarization;
LCP, left-handed circular polarization.
1. Pasteur, L. (1848). Recherches sur les relations qui peuvent exister entre la forme
cristalline, la composition chimique et le sens de la polarisation rotatoire. Ann. Chim. Phys.,
24:442.
2. Schäferling, M., Yin, X., Engheta, N., Giessen, H. Helical Plasmonic Nanostructures as
Prototypical Chiral Near-Field Sources. ACS Photon. 1, 530–537 (2014).
3. Kang, L., Ren, Q., Werner, D. H. Leveraging Superchiral Light for Manipulation of Optical
Chirality in the Near-Field of Plasmonic Metamaterials. ACS Photon. 4, 1298–1305
(2017).
4. Rajaei, M., Zeng, J., Albooyeh, M., Kamandi, M., Hanifeh, M., Capolino, F.,
Wickramasinghe, H. K. Giant Circular Dichroism at Visible Frequencies Enabled by
Plasmonic Ramp-Shaped Nanostructures. ACS Photon. 6, 924—931 (2019).
5. McPeak, K. M. et al. Ultraviolet Plasmonic Chirality from Colloidal Aluminum
Nanoparticles Exhibiting Charge-Selective Protein Detection. Adv. Mater. 27, 6244–6250
(2015).
6. Zu, S., Bao, Y., Fang, Z. Planar plasmonic chiral nanostructures. Nanoscale 8, 3900–3905
(2016).
7. Fasold, S., Linß, S., Kawde, T., Falkner, M., Decker, M., Pertsch, T., Staude, I.
Disorder-enabled pure chirality in bilayer plasmonic metasurfaces. ACS Photon., 5, 1773-1778
8. Collins, J. T., Kuppe, C ., Hooper, D.C., Sibilia, C., Centini, M., Valev, V.K. Chirality and
Chiroptical Effects in Metal Nanostructures: Fundamentals and Current Trends. Adv. Opt.
Mat. 5, 1700182 (2017).
9. Gansel, J. K., Thiel, M., Rill, M. S., Decker, M., Bade, K., Saile, V., Freymann, G., Linden,
S., Wegener, M. Gold helix photonic metamaterial as broadband circular polarizer. Science
325, 1513-1515 (2009)
10. Gorodetski, Y., Genet, C., Ebbesen, T. W. Ultrathin plasmonic chiral phase plate. Opt. Lett.
41, 4390 (2016).
11. Ben-Moshe, A., Maoz, B. M., Govorov, A. O., Markovich, G. Chirality and chiroptical
effects in inorganic nanocrystal systems with plasmon and exciton resonances. Chem. Soc.
Rev. 42, 7028-7041 (2013).
12. Tang, Y. and Cohen, A. E. Optical Chirality and Its Interaction with Matter. Phys. Rev.
Lett. 104, 163901 (2010).
13. Schäferling, M., Dregely, D., Hentschel, M., Giessen, H. Tailoring enhanced optical
chirality: design principles for chiral plasmonic nanostructures. Phys. Rev. X 2, 031010
(2012).
14. Valev, V. K., et al. Nonlinear superchiral meta-surfaces: tuning chirality and disentangling non-reciprocity at the nanoscale. Adv. Mat. 26, 4074-4081(2014).
15. Schäferling, M., Yin, X., Giessen, H. Formation of chiral fields in a symmetric
16. Davis, T. J. and Hendry, E. Superchiral electromagnetic fields created by surface plasmons
in nonchiral metallic nanostructures. Phys. Rev. B 87, 085405 (2013).
17. Hashiyada, S., Narushima, T., Okamoto, H. Local Optical Activity in Achiral
Two-Dimensional Gold Nanostructures. J. Phys. Chem. C 118, 22229–22233 (2014).
18. Plum, E. , Liu, X.X., Fedotov, V.A., Chen, Y., Tsai, D.P., Zheludev, N.I. Metamaterials:
Optical Activity without Chirality. Phys. Rev. Lett. 102, 107 (2009).
19. Zu, S. Han, T., Jiang, M., Lin, F., Zhu, X., Fang, Z. Deep-Subwavelength Resolving and
Manipulating of Hidden Chirality in Achiral Nanostructures. ACS Nano 12, 3908–3916
(2018).
20. Zu, S. Han, T., Jiang, M., Liu, Z., Jiang, Q., Lin, F., Zhu, X., Fang, Z. Imaging of
Plasmonic Chiral Radiative Local Density of States with Cathodoluminescence
Nanoscopy. Nano Lett. 19, 775–780 (2018).
21. Abasahl, B., Dutta-Gupta, S., Santschi, C., Martin, O. J. Coupling strength can control the
polarization twist of a plasmonic antenna. Nano Lett., 13, 4575-4579 (2013).
22. Brandl, D. W., Mirin, N. A., Nordlander, P. Plasmon Modes of Nanosphere Trimers and
Quadrumers. J. Phys. Chem. B 110, 12302–12310 (2006).
23. Alegret, J., Rindzevicius, T., Pakizeh, T. , Alaverdyan, Y., Gunnarson, L., Kall, M.
Plasmonic Properties of Silver Trimers with Trigonal Symmetry Fabricated by
24. Raziman, T. V., and Martin, O. J. F. Does the real part contain all the physical information?
J. Opt. 18, 095002 (2016).
25. Tang, Y., and Cohen, A. E. Enhanced enantioselectivity in excitation of chiral molecules
by superchiral light. Science 332, 333–336 (2011).
26. Narushima, T., Hashiyada, S., Okamoto, H. Nanoscopic Study on Developing Optical
Activity with Increasing Chirality for Two-Dimensional Metal Nanostructures. ACS
Photon. 1, 732–738 (2014).
27. Narushima, T., and Okamoto, H. Strong Nanoscale Optical Activity Localized in
Two-Dimensional Chiral Metal Nanostructures. J. Phys. Chem. C 117, 23964–23969 (2013).
28. Plain, J., Wiederrecht, G. P., Gray, S. K., Royer, P., Bachelot, R. Multiscale Optical
Imaging of Complex Fields Based on the Use of Azobenzene Nanomotors. J. Phys. Chem.
Lett. 4, 2124–2132 (2013).
29. Juan, M. L., Plain, J., Bachelot, R., Vial, A., Royer, P., Gray, S. K., Montgomery, J. M.,
Wiederrecht, G. P. Plasmonic electromagnetic hot spots temporally addressed by
photoinduced molecular displacement. J. Phys. Chem. A, 113, 4647-4651 (2009).
30. Hubert, C. et al. Near-Field Polarization Effects in Molecular-Motion-Induced
Photochemical Imaging. J. Phys. Chem. C 112, 4111–4116 (2008).
31. Ambrosio, A., Marrucci, L., Borbone, F., Roviello, A., Maddalena, P. Light-induced spiral
mass transport in azo-polymer films under vortex-beam illumination. Nat. Commun. 3,
32. Zhang, Y. et al. Nanoscale Switching of Near-Infrared Hot Spots in Plasmonic Oligomers
Probed by Two-Photon Absorption in Photopolymers. ACS Photon. 5, 918–928 (2018).
33. Bian, S., Li, L., Kumar, J., Kim, D. Y., Williams, J., Tripathy, S. K. Single laser
beam-induced surface deformation on azobenzene polymer films. Appl. Phys. Lett. 73,
1817-1819 (1998).
34. Chuntonov, L., and Haran G. Trimeric plasmonic molecules: the role of symmetry. Nano
Lett. 11, 2440-2445 (2011).
35. Dutta-Gupta, S., & Martin, O. J. Insight into the eigenmodes of plasmonic nanoclusters
based on the Green’s tensor method. J. Opt. Soc. Am. B 32, 194-200 (2015).
36. Saito, K. & Tatsuma, T. Chiral Plasmonic Nanostructures Fabricated by Circularly
Polarized Light. Nano Lett. 18, 3209–3212 (2018).
37. Liu, T. et al. Chiral Plasmonic Nanocrystals for Generation of Hot Electrons: Toward