ecoinvent: Energy Supply
Life Cycle Assessment for Emerging Technologies:
Case Studies for Photovoltaic and Wind Power
Niels Jungbluth1*, Christian Bauer2, Roberto Dones2 and Rolf Frischknecht1
1 ESU-services, environmental consultancy for business and authorities, Kanzleistr. 4, CH-8610 Uster 2 Paul Scherrer Institute (PSI), Systems/Safety Analysis, CH-5232 Villigen PSI
* Corresponding author ([email protected])
scenario for a future technology helps to assess the relative in-fluence of technology improvements for some processes in the near future (2005–2010). The differences for environmental bur-dens of wind power basically depend upon the capacity factor of the plants, the lifetime of the infrastructure, and the rated power. The higher these factors, the more reduced the environmental burdens are. Thus, both systems are quite dependent on meteoro-logical conditions and the materials used for the infrastructure.
Recommendation and Perspective. Many production processes
for photovoltaic power are still under development. Future up-dates of the LCI should verify the energy uses and emissions with available data from industrial processes in operation. For the modelling of a specific power plant or power plant mixes outside of Switzerland, one has to consider the annual yield (kWh/ kWp) and if possible also the size of the plant. Considering the
steady growth of the size of wind turbines in Europe, the devel-opment of new designs, and the exploitation of offshore location with deeper waters than analysed in this study, the inventory for wind power plants may need to be updated in the future.
Keywords: Allocation; capacity factor; ecoinvent; electricity mixes; multi-output process; onshore; offshore; photovoltaic; Switzerland; wind power
DOI: http://dx.doi.org/10.1065/lca2004.11.181.3 Abstract
Goal, Scope and Background. This paper describes the modelling
of two emerging electricity systems based on renewable energy: photovoltaic (PV) and wind power. The paper shows the approach used in the ecoinvent database for multi-output processes.
Methods. Twelve different, grid-connected photovoltaic systems
were studied for the situation in Switzerland. They are manu-factured as panels or laminates, from mono- or polycrystalline silicon, installed on facades, slanted or flat roofs, and have a 3kWp capacity. The process data include quartz reduction, sili-con purification, wafer, panel and laminate production, sup-porting structure and dismantling. The assumed operational life-time is 30 years. Country-specific electricity mixes have been considered in the LCI in order to reflect the present situation for individual production stages.
The assessment of wind power includes four different wind turbines with power rates between 30 kW and 800 kW oper-ating in Switzerland and two wind turbines assumed repre-sentative for European conditions – 800 kW onshore and 2 MW offshore. The inventory takes into account the construction of the plants including the connection to the electric grid and the actual wind conditions at each site in Switzerland. Average Eu-ropean capacity factors have been assumed for the EuEu-ropean plants. Eventually necessary backup electricity systems are not included in the analysis.
Results and Discussion. The life cycle inventory analysis for
pho-tovoltaic power shows that each production stage may be im-portant for specific elementary flows. A life cycle impact assess-ment (LCIA) shows that there are important environassess-mental impacts not directly related to the energy use (e.g. process emis-sions of NOx from wafer etching). The assumption for the used
supply energy mixes is important for the overall LCIA results of different production stages. The allocation of the inventory for silicon purification to different products is discussed here to il-lustrate how allocation has been implemented in ecoinvent. Material consumption for the main parts of the wind turbines gives the dominant contributions to the cumulative results for electricity production. The complex installation of offshore tur-bines, with high requirements of concrete for the foundation and the assumption of a shorter lifetime compared to onshore foundations, compensate the advantage of increased offshore wind speeds.
Conclusion. The life cycle inventories for photovoltaic power
plants are representative for newly constructed plants and for the average photovoltaic mix in Switzerland in the year 2000. A
Introduction
Renewable energy systems form a growing share of the sup-ply of electricity (e.g. Denmark, Germany) or thermal en-ergy in some of the European countries. Within the ecoinvent database, several types of renewable energy systems have been investigated: hydro power (Bolliger & Bauer 2003), wood energy (Bauer 2003), heat pumps (Heck 2004), pho-tovoltaic (Jungbluth 2003a), solar collector systems (Jung-bluth 2003b) and wind power (Burger & Bauer 2004). The data are used within ecoinvent to model the electricity sup-ply for different European countries.
This paper focuses on the modelling and results of the two systems photovoltaic (PV) and wind power for the produc-tion of electricity. These are interesting renewable systems with regard to the development in production technology in the last years as well as development potential for the near future, and thus with important updates for the inventory analysis. Special attention is paid to explain the approach used for multi-output processes in the database with an ex-ample from the photovoltaic production chain.
The modelling of both PV and wind systems is based on the implementation of process chain analysis and is integrated consistently with all datasets for the numerous sectors cov-ered in the ecoinvent database. Each unit process dataset includes inputs from other unit processes available in the database (e.g. the wind tower uses metal manufacturing and transport services). Some other activities, e.g. marketing and business trips, have not been modelled, consistently through-out the database. Therefore, cumulative results represent the interactions of all modelled unit processes, but this does not fully prevent truncation errors, as discussed in (Suh et al. 2004). However, the consistent and transparent setting of system boundaries in ecoinvent allows fair comparison of results for datasets pertaining similar products and compari-son with other studies. Frischknecht et al. (2004a) describe the goal, scope, methodology, treatment of uncertainty and data format of the ecoinvent database. These topics are ad-dressed in different articles of this Special Issue.
1 Photovoltaic Power 1.1 Introduction
LCA studies for photovoltaic power plants have a long tra-dition for longer than 15 years (e.g. Alsema 2000, Alsema et al. 1998, Frankl 1998, Frischknecht et al. 1996, Fthenakis et al. 1999, Hagedorn & Hellriegel 1992, Kato 1999, Knapp & Jester 2000, Palz & Zibetta 1991, Pehnt et al. 2002, Phylipsen & Alsema 1995, Tsuo et al. 1998). The published studies show a high variation in results and conclusions. The main reasons for different LCI results have been evaluated in the late nineties (Jungbluth & Frischknecht 2000). Criti-cal issues during modelling of an LCI for photovoltaic power are: modelling of silicon inputs and use of off-grade or solar grade silicon, allocation between different silicon qualities, power mixes assumed for the production processes, and proc-ess specific emissions. The production technology for pho-tovoltaic power plants has been constantly improved over the last decades, e.g. for the efficiency of cells, the amount of silicon required, and the actual capacity of production processes. The data availability is a major problem for es-tablishing a high quality inventory, because not many pro-ducers do provide reliable and verifiable data.
1.2 Goal, scope and background
Twelve different, grid-connected photovoltaic systems were studied, namely ten different small scale plants of 3kWp (kilo watt peak) capacity and newly installed in Switzerland, and two plants based on a scenario with a future production technology that might be applied between 2005 to 2010 (Table 1). The plants differ according to the cell type (mono-and polycrystalline, mc-Si (mono-and pc-Si), (mono-and the place of in-stallation (slanted roof, flat roof and façade). Slanted roof and façade systems are further distinguished according to the kind of installation (building integrated or mounted). The actual electricity mix from PV plants in Switzerland has also been modelled.
1.3 Life cycle inventory
In principle, all subsystems shown in Fig. 1 are included within the system boundaries. The process data include quartz reduction, silicon purification, wafer, panel and lami-nate production, manufacturing of converter and supporting structure and 30 years of operation. Furthermore, transports of materials, energy carriers, semi-finished products and the complete power plant, and waste treatment processes for pro-duction wastes and end of life wastes are considered. Air- and waterborne process-specific pollutants are included as well. The photovoltaic system in particular is divided into unit proc-esses for each of the process steps shown.
Installation Cell type Panel type 1
Slanted roof mc-Si Panel
pc-Si Panel
mc-Si Laminate
pc-Si Laminate
mc-Si, future Laminate
pc-Si, future Laminate
Flat roof mc-Si Panel
pc-Si Panel
Façade mc-Si Panel
pc-Si Panel
mc-Si Laminate
pc-Si Laminate
1 Panel = mounted; Laminate = integrated in the roof construction
Table 1: Overview of the types of photovoltaic 3 kWp systems investigated
silica sand
EG-silicon off-grade silicon
SiCl4 SoG-silicon pc-silicon CZ-mc-silicon silicon purification MG-silicon wafer sawing cell production operation installation 3kWp plants mounting systems electric
components panel- and laminate production
casting future scenario
electricity
Fig. 1: Different subsystems investigated for photovoltaic power plants
installed in Switzerland. The future scenario is shown with dotted arrows. MG-silicon: metallurgical grade silicon, EG-silicon: electronic grade sili-con, SoG-silicon: solar-grade silicon
The production of metallurgical grade silicon (MG-silicon) is based on a carbothermal reduction using petrol coke, char-coal and wood chips as reduction agents. The process data include also the consumption of electricity and quartz and the emission of air- and waterborne pollutants. The Norwe-gian power mix (with a high share of hydro power) has been considered for the LCI, because the important European producers are located in this country.
MG-silicon is converted to EG silicon (electronic grade) in the Siemens process (via reaction to trichlorosilane). Inven-tory data are based on information available for the most important producer in Europe, located in Germany. Thus, it cannot be regarded as representative for other technologies or production sites. Electricity consumption is assumed with the in-house mix. The purification process provides three different products which are used in three different economic sectors (Fig. 2).
In several photovoltaic LCAs, all inputs and outputs for the purification process of MG-silicon have been allocated to the EG-silicon (required for wafer production) and none to the silicon tetrachloride. However, in an LCA study of vacuum insulation (based on silicic acid), inputs and outputs of the purification process have been allocated on the basis of the revenues of EG silicon and SiCl4 (Wohler & Schonhardt 2001). Hence, more than 100% of total inputs and outputs of the
MG-Si purification process have been allocated to the two co-products, when adding up the LCI results of the photovoltaic and the vacuum insulation study. This is not according to ISO 14041, which states that "the sum of the allocated inputs and outputs of a unit process shall equal the unallocated inputs and outputs of the unit process" (International Organization for Standardization (ISO) 1998).
Large background LCI databases like ecoinvent require a consistent modelling of such processes. Where possible, proc-esses have been split up in order to avoid allocation. System expansion is avoided wherever possible (see also Frischknecht & Jungbluth 2003, Frischknecht et al. 2004b). In most cases, allocation according to 'other relationships' (according to the three-step procedure in ISO 14041) is used.
Multi-output unit processes are entered into the ecoinvent database before allocation. Their reference flow is an input (such as 1 kg of MG-silicon to purification) or one year of production. The allocation factors applied are defined on the multi-output process level. The multi-output process and its co-products are named differently. Allocation factors may also be negative or above 100%. However, the sum of the set of allocation factors of one particular input or output needs to add up to exactly 100%, which is controlled by the software.
Table 2 shows an excerpt of the inputs and outputs of the
MG silicon purification process and the allocation factors. The first three lines show the co-products EG-silicon (0.68 kg), off-grade electronic grade silicon (0.084 kg) and silicon tetrachloride (1.2 kg). The next six lines show exam-ples for the inputs required for the purification of 1 kg of MG-silicon. The three columns to the right show the alloca-tion factors: For instance, 71.1% of the input 'MG-silicon, at plant' are allocated to the 0.68 kg of EG silicon, 8.9% to 0.084 kg of off-grade silicon and 20% to 1.2 kg of SiCl4.
EG-silicon off-grade silicon
SiCl4 photovoltaic cells electronic industry MG-silicon purification silicones (plastics) production
Fig. 2: Purification of MG-silicon delivering three different co-products
Name L o cat io n Un it MG-silicon, to purification silicon, electronic grade, at plant silicon, electronic grade, off-grade, at plant silicon tetrachloride, at plant Allocation criteria DE DE DE DE kg % % % allocated products
silicon, electronic grade, at plant
DE kg 6.76E-1 100 0 0
silicon, electronic grade, off-grade, at plant
DE kg 8.44E-2 0 100 0
silicon tetrachloride, at plant DE kg 1.20E+0 0 0 100
technosphere MG-silicon, at plant NO kg 1.00E+0 71.1 8.9 20.0 Material balance
polyethylene, HDPE,
granulate, at plant
RER kg 6.37E-4 72.0 2.4 25.6 Revenue of all
products
hydrochloric acid,
30% in H2O, at plant
RER kg 2.00E+0 48.4 1.6 50.0 Stoichiometric
calculation
natural gas, burned in boiler
condensing modulating >100kW
RER MJ 1.22E+2 96.8 3.2 – Revenue purified
silicon
electricity, natural gas, at
combined cycle plant, best technology
RER kWh 8.66E+1 96.8 3.2 – Revenue purified
silicon
electricity, hydropower,
at run-of-river power plant
RER kWh 2.74E+1 96.8 3.2 – Revenue purified
silicon
price GLO 70.36 75.00 20.00 15.00
revenue GLO 70.36 50.67 1.69 18.00
Table 2: Excerpt of the multi-output process raw data of the purification of 1 kg of MG silicon and allocation factors used for the three co-products
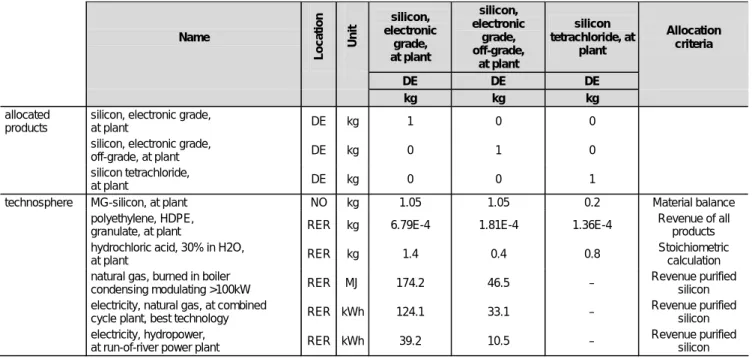
The allocation of inputs and elementary flows is based on different flow-specific principles. For material inputs of MG-silicon and hydrogen chloride, an allocation based on the mass of chemical elements (Si, H, Cl) has been chosen. The energy input is allocated based on economic parameters. When the dataset 'MG silicon, to purification' is imported into the database, three additional datasets are generated, namely the unit process datasets for 'silicon, electronic grade, at plant', 'silicon, electronic grade, off-grade, at plant', and 'silicon tetrachloride, at plant'. Thereby, the amount of the inputs and outputs is multiplied by the respective allocation factor and divided by the respective amount of the co-prod-uct to give the flows per unit mass of prodco-prod-uct. Table 3 shows an excerpt of the derived unit process raw data.
A scenario for the production of solar grade (SoG) silicon has been assumed for future processes based on publica-tions for experimental processes. The EG-silicon is molten and a mono-crystalline crystal is slowly extracted from the melting-pot. Inventory data for Czochralski grade silicon (CZ-silicon) are based on literature information and envi-ronmental reports.
The mc-Si or pc-Si columns are sawn to squared wafers of 300 µm thickness. The LCI includes consumption of elec-tricity, hard coal, water, and working material (stainless steel for saw-blades, argon gas, hydrofluoric and hydrochloric acid), production wastes and process-specific air- and water-borne pollutants based on information from literature and environmental reports. Emissions of NOx and nitrate due to surface etching with HNO3 are important and data were
only available for one production site.
Production of solar cells includes purification and etching of the wafers. Afterwards, wafers are endowed with phos-phorus and, after further etching processes, front and rear contacts are printed. Process data include consumption of working material (acids, oxygen, nitrogen and highly
puri-fied water), electricity, and wastes. Furthermore, process-specific air- and waterborne pollutants are considered. Cell efficiencies are estimated with data provided by several dif-ferent producers for their actual products.
Solar cells are embedded in layers of ethyl-vinylacetate. The rear cover consists of a polyester, aluminium and polyvinyl-fluoride film. A 4 mm low-iron glass is used for the front cover. The sandwich is joined under pressure and heat. A connection box is installed and the panels receive an alu-minium frame. The process data include construction mate-rial and energy consumption as well as the treatment of pro-duction wastes.
Panels are mounted on top of houses and laminates are inte-grated into slanted roofs and façades. The process data in-clude the balance of plant (inverter, electric equipment, con-struction materials) as well as the transports to the installation site. The dismantling of the plants has been considered with the standard scenarios used in the ecoinvent 2000 project. The photovoltaic plants in operation in Switzerland show an average yearly electricity production of 819 kWh per kWp. For the inventory of flat and slanted-roof installations, only the best 75% plants with an average production of 885 kWh/ kWp have been considered to roughly disregard the
minimally-efficient installations. A façade-system with vertically oriented panels is calculated to produce 626 kWh per kWp and year.
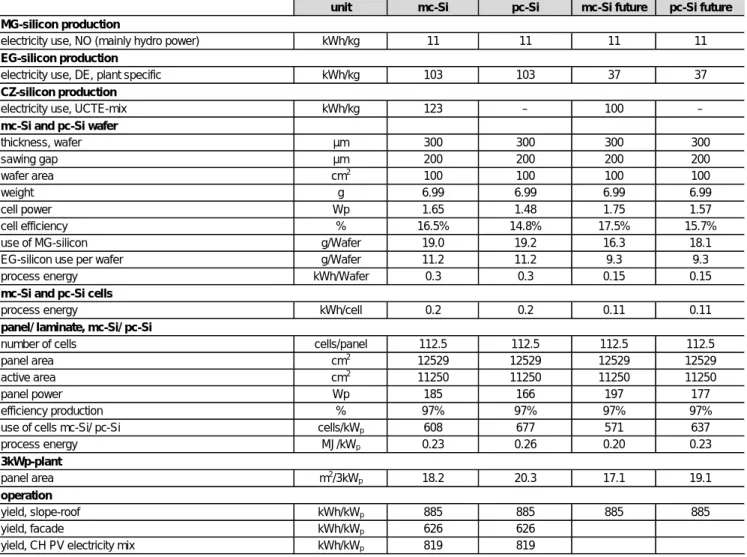
Table 4 shows the key parameters of the life cycle inventory in
ecoinvent Data v1.1 (ecoinvent Centre 2004). Main changes in comparison to older Swiss inventories are the update of the energy use in EG-silicon production, the location-specific con-sideration of power consumption throughout the production chain, and the inclusion of many additional process-specific emissions. The material efficiency for silicon in the life cycle has also been improved in the last years. For future plants, a best case estimation has been made from the ranges provided for different key parameters in the literature.
Name Lo c a tion Un it silicon, electronic grade, at plant silicon, electronic grade, off-grade, at plant silicon tetrachloride, at plant Allocation criteria DE DE DE kg kg kg allocated products
silicon, electronic grade,
at plant DE kg 1 0 0
silicon, electronic grade,
off-grade, at plant DE kg 0 1 0
silicon tetrachloride,
at plant DE kg 0 0 1
technosphere MG-silicon, at plant NO kg 1.05 1.05 0.2 Material balance
polyethylene, HDPE,
granulate, at plant RER kg 6.79E-4 1.81E-4 1.36E-4
Revenue of all products
hydrochloric acid, 30% in H2O,
at plant RER kg 1.4 0.4 0.8
Stoichiometric calculation
natural gas, burned in boiler
condensing modulating >100kW RER MJ 174.2 46.5 –
Revenue purified silicon
electricity, natural gas, at combined
cycle plant, best technology RER kWh 124.1 33.1 –
Revenue purified silicon
electricity, hydropower,
at run-of-river power plant RER kWh 39.2 10.5 –
Revenue purified silicon
0% 20% 40% 60% 80% 100% non-renewable energy resources, fossil
non-renewable energy resources, nuclear renewable energy resources, water renewable energy resources, wind, solar, geothermal renewable energy resources, biomass Land occupation Carbon dioxide, fossil Nitrogen oxides Particulates, < 2.5 um BOD
MG-silicon silicon purification casting wafer sawing
cell production panel production plant installation operation
1.4 Results and discussion
Fig. 3 shows the shares of different production stages for
selected elementary flows and the cumulative energy demand (CED). The CED is calculated for five classes of primary en-ergy carriers (fossil, nuclear, hydro, biomass and others (wind, solar, geothermal)). Differences for different types of
unit mc-Si pc-Si mc-Si future pc-Si future
MG-silicon production
electricity use, NO (mainly hydro power) kWh/kg 11 11 11 11
EG-silicon production
electricity use, DE, plant specific kWh/kg 103 103 37 37
CZ-silicon production
electricity use, UCTE-mix kWh/kg 123 – 100 –
mc-Si and pc-Si wafer
thickness, wafer µm 300 300 300 300 sawing gap µm 200 200 200 200 wafer area cm2 100 100 100 100 weight g 6.99 6.99 6.99 6.99 cell power Wp 1.65 1.48 1.75 1.57 cell efficiency % 16.5% 14.8% 17.5% 15.7%
use of MG-silicon g/Wafer 19.0 19.2 16.3 18.1
EG-silicon use per wafer g/Wafer 11.2 11.2 9.3 9.3
process energy kWh/Wafer 0.3 0.3 0.15 0.15
mc-Si and pc-Si cells
process energy kWh/cell 0.2 0.2 0.11 0.11
panel/ laminate, mc-Si/ pc-Si
number of cells cells/panel 112.5 112.5 112.5 112.5
panel area cm2 12529 12529 12529 12529
active area cm2 11250 11250 11250 11250
panel power Wp 185 166 197 177
efficiency production % 97% 97% 97% 97%
use of cells mc-Si/ pc-Si cells/kWp 608 677 571 637
process energy MJ/kWp 0.23 0.26 0.20 0.23 3kWp-plant panel area m2/3kWp 18.2 20.3 17.1 19.1 operation yield, slope-roof kWh/kWp 885 885 885 885 yield, facade kWh/kWp 626 626
yield, CH PV electricity mix kWh/kWp 819 819
Table 4: Key parameters of the life cycle inventory for photovoltaic power production (Jungbluth 2003a)
tive energy demands are mainly due to the consideration of location-specific electricity mixes. Nitrogen oxides and BOD are emitted in a high share due to the finishing of wafer surfaces. The analysis shows that each production stage is important for certain elementary flows.
0% 20% 40% 60% 80% 100%
global warming potential, 100a
respiratory effects
ecotoxicity
ecological scarcity 1997
eco-indicator 99, (H,A)
eco-indicator 99, (I,I)
MG-silicon silicon purification casting wafer sawing
cell production panel production plant installation operation
Fig. 4 analyses the share of the process stages with different
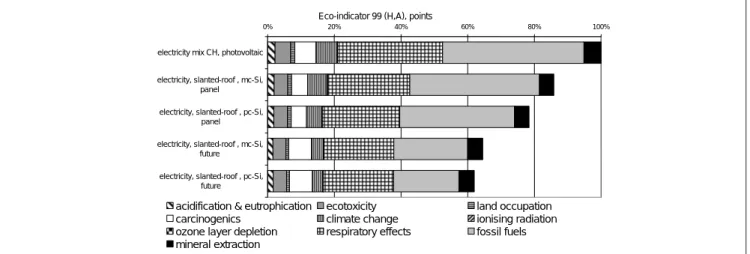
endpoint LCIA methods (Frischknecht et al. 2004c). The evaluation for respiratory effects and ecotoxicity is based on the characterisation in Eco-indicator 99. The shares dif-fer considerably. The installation, for example, is quite im-portant for the Individualist perspective of the Eco-indica-tor 99, that gives a high weighting to the use of metal resources. This shows, depending on the impact assessment method, that different types of resource uses or pollutants might be more or less important for the final result. The environmental impacts for different PV systems are com-pared in Fig. 5 based a valuation with the Eco-indicator 99 (H,A) (Goedkoop & Spriensma 2000). The highest contribu-tion of environmental impacts is due to the use of fossil energy resources and respiratory effects caused by air emissions. The highest score is recorded for the present average of PV plants in Switzerland, because non-optimal installations are also con-sidered for the assumption of yields here. This case is set at 100%. Plants using mono-crystalline cells have higher impacts than those with polycrystalline cells not only for the aggre-gated results, but also for most of the damage categories. The environmental impacts of PV power plants might be further reduced in future if technology improvements in the
produc-tion processes are realized. A higher share for carcinogenic effects results from a different assumption for the electricity supply assumed in this scenario. In general, such a compari-son is always dependent on the choice of LCIA methodology and it cannot be made in such a short article in full detail. An important yardstick for the assessment of renewable en-ergy systems is the estimation of the enen-ergy and/or mental pay-back time. This describes the time until environ-mental impacts from the production of the plant have levelled out due to avoiding resource uses and/or emissions of a con-ventional reference system that produces the same amount of electricity. Here, we consider a modern natural gas-fired, gas combined cycle power plant as the reference system (Dones et al. 2004). It is assumed that the use of photo-voltaic power plants can avoid the installation of such a facility. Fig. 6 shows the pay-back time for the indicators non-renewable and non-renewable plus hydro cumulative energy demand. This time is between 3 and 6 years for the different PV plants. This means that the energy use for pro-ducing the photovoltaic plants is as high as the energy use for the operation of the gas power plant during 3 to 6 years. Thus, it is five to ten times shorter than the expected life time of the photovoltaic power plants.
Fig. 4: Share of process stages for grid-connected pc-Si photovoltaic 3 kWp power plants evaluated with different LCIA methods
Eco-indicator 99 (H,A), points
0% 20% 40% 60% 80% 100%
electricity mix CH, photovoltaic
electricity, slanted-roof , mc-Si, panel electricity, slanted-roof , pc-Si,
panel electricity, slanted-roof , mc-Si,
future electricity, slanted-roof , pc-Si,
future
acidification & eutrophication ecotoxicity land occupation
carcinogenics climate change ionising radiation
ozone layer depletion respiratory effects fossil fuels
mineral extraction
This picture changes if emissions are taken into account. Valuating the impact with the method of ecological scarcity (Umweltbelastungspunkte - UBP) gives an environmental pay-back time of about 25 years (Brand et al. 1998, Frischknecht et al. 2004c), while the pay-back time evaluated with Eco-indicator 99 (H,A) is slightly higher than for the energy de-mand. With human toxicity (Guinée et al. 2001) as an indica-tor, it might be even higher than 50 years and thus longer than the expected life time. The reasons for these large differences between the selected LCIA methodologies are manifold: in EI99 (H,A), the consumption of fossil resources is considered as very important, but not so important in ecological scarcity and not included in the human toxicity category indicator; the PV chain produces higher emissions of human toxic species than the gas chain. The outcome of such a comparison is in-fluenced by the choice of the reference system, on the one hand, and by the indicator, on the other.
1.5 Conclusion and outlook
The life cycle inventories of photovoltaic power plants can be assumed to be representative for newly constructed plants and for the average photovoltaic mix in Switzerland in the year 2000. Differences for the situation in other countries, in comparison to the data modelled for Switzerland, are mainly due to different solar irradiation. It should be con-sidered that the inventory may not be valid for wafers and panels produced outside of Europe, because production tech-nologies and power mixes for production processes might not be the same. For the modelling of a specific power plant or power plant mixes outside of Switzerland, it is advisable to consider at least the annual yield (kWh/kWp) and if pos-sible also the actual size of the plant in square metres. The scenario for a future technology helps to assess the im-provement potential in the near future (2005–2010). But, the realization of this scenario depends on the development of the market situation for electronics and photovoltaic power. The production of SoG-grade (solar grade) silicon is only possible if the supply of silicon for photovoltaic proc-esses cannot be secured in such a way as it is today or if subsidies are granted to increase the total production.
The analysis of the environmental impacts with different LCIA methods shows that it is quite important to include process-specific emissions of the production chain into ac-count. It is necessary to evaluate all types of environmental impacts with different (midpoint and endpoint) LCIA meth-odologies, if photovoltaic power plants are to be compared with other energy systems. The results of such a comparison are quite dependent on the choice of LCIA methodology. The approach in the ecoinvent database for dealing with multi-output processes has several advantages. The tion is done in a fully transparent way, because all alloca-tion factors are reported. The LCIs of all co-products in the database are fully consistent. If necessary, allocation factors may be changed and LCI results can be recalculated.
2 Wind Power 2.1 Introduction
The installed capacity of wind power plants has been rap-idly increasing during recent years, especially in Denmark, Germany and Spain. Up to now, mainly onshore turbines have been installed, but offshore wind parks are expected to have important growth rates because of the higher yields compared to onshore sites. Since wind power is expected to play an increasing role in the European electricity mixes, an assessment of its environmental performance is necessary to serve as a basis for a fair comparison of different options for future electricity supply. This analysis does not include the environmental effects of eventually necessary, backup electricity systems. Not many current life cycle assessment studies exist for wind turbines with high rated power (≥ 600 kW). The available studies (e.g. Andersen 2002, Elsam 2004, Hassing & Varming 2001, Lenzen & Munksgaard 2002, Lenzen & Wachsmann 2004, Schleisner 2000, Tech-wise A/S 2001) are differing in their scope, but show the dominant influence of the material production on the environmental performance of wind power plants. Some of these assessments also indicate large amounts of indirectly produced waste.
Concerning the production chain, wind turbines are not very complicated systems. The important elements are material and energy consumption for the construction, as well as
life -10 20 30 40 50 60 slanted-roof installation, mc-Si, future, on roof
slanted-roof installation, mc-Si, laminated, integrated, on roof slanted-roof installation, mc-Si, panel, mounted, on roof slanted-roof installation, pc-Si, future, on roof
slanted-roof installation, pc-Si, laminated, integrated, on roof slanted-roof installation, pc-Si, panel, mounted, on roof ye ar s
pay back time, fossil + nuclear pay back time, non-renewable and hydro pay back time, global warming pay back time, human toxicity pay back time, EI'99, (H,A) pay back time, UBP
Fig. 6: Energy and environmental pay back time of 3 kWp slanted-roof photovoltaic power plants in relation to a modern natural gas-fired gas combined
time and capacity factor for the operation of the plants. The capacity factor represents the fraction of a year, during which the turbines would continuously produce electricity at rated power to generate the actual average annual amount during their lifetime. Data for offshore wind power are limited at present, as there are only few operating parks today. A very sensitive element is the assumption of a reference capacity factor for a generic plant. Therefore, production data for single plants during several years would be desirable to elimi-nate the variations of the wind conditions, but those data are not always available.
2.2 Goal, scope and background
The electricity production at four Swiss and two European wind plants has been modelled in ecoinvent. The modelled wind power plants are listed in Table 5. The basic informa-tion comes from producers of wind power plants and elec-tricity production data over the last ten years, supplemented with our own assumptions and extrapolations in the case of insufficient data.
The 800 kW wind turbine has been considered for Mont Crosin (Switzerland) specific conditions as well as for aver-age European onshore conditions. The 2 MW offshore unit represents one turbine installed in the wind park Middel-grunden (Denmark, Baltic Sea). Two average wind electric-ity production mixes have been modelled considering the shares of the relative contribution of the different technolo-gies to total electricity from wind power around the year 2000 in Switzerland and Europe.
for example, that the construction of the tower includes not only energy and material requirements as well as emissions of the steel production, but also the relevant extraction of the ore, its processing and transport with the same level of detail. Moreover, process analysis of steel working, i.e. sheet rolling, and welding is taken into account. Details about LCI of metals in ecoinvent can be found in (Althaus et al. 2004, Althaus & Classen 2004).
The capacity factor depends on the site conditions and the characteristics of the wind turbine. For Switzerland, the ca-pacity factors of the single modelled wind power plants are calculated using electricity production statistics of recent years in order to have a sort of average values. The resulting
Location Turbine share% of
annual energy 30 kW, Simplon 0.7% 150 kW, Grenchenberg 2.3% 600 kW, Mont Crosin 57.3% 800 kW, Mont Crosin 39.7% Switzerland Wind mix 100% 800 kW 98%
2 MW, offshore, Baltic Sea 2%
Europe
Wind mix 100%
Table 5: Datasets for wind turbines available in ecoinvent
2.3 Life cycle inventory
Fig. 7 shows a schematic description of the chain for
elec-tricity production at wind power plants. The construction of fixed and moving parts has been modelled separately, as-suming a lifetime of 20 years for moving parts, cables and electronics, 40 years for fixed parts of onshore plants and 20 years for all parts of the offshore turbine.
Table 6 shows the key parameters for the life cycle inventory
in ecoinvent Data v1.1 for the 600 kW, 800 kW and 2 MW plants. Because of their minor importance, the 30 kW and the 150 kW turbines are not addressed here. The full life cycle inventories with the unit process raw data for all pro-duction stages can be found in the ecoinvent database (Burger & Bauer 2004). Consideration of detailed process analysis of all relevant upstream and downstream processes means,
Material manufacturing and processing, Transport, Installation, Land use
Material manufacturing and processing, Transport,
Installation
Fixed Parts:
Tower, Basement (Rotor, Nacelle, Mechanics) Moving Parts
Cabling, Electronics
Operation
Electricity, at wind power plant
Fig. 7: Model of the wind energy chain
Plant 600 kW, Onshore 800 kW, Onshore 2 MW, Offshore Location Switzerland (CH) CH / Europe Baltic Sea Type Nordex N43/600 Nordex N50/800 Bonus 2MW Capacity factor % 14 14 / 20 30
Lifetime tower, basement a 40 40 20
Lifetime nacelle a 20 20 20
Length of cable to grid per turbine (copper, plastics, leada, low-alloyed steela) m 275b 275b 375c Depth at site m – – 3–5 Tower height m 40 50 60 Rotor diameter m 43 50 76 Tower weight (low-alloyed steel) t 33.8 60.3 98.4
Rotor and hub weight (GFPd, chromium steel, cast iron)
t 14 14.7 52
Nacelle weight (low alloyed + chromium steel, cast iron, copper)
t 21.4 20.2 82.5
Basement weight (concrete, reinforcing steel)
t 191 238 2000
a
Only for offshore cabling. b
Total length 550 m (data for Mont Crosin), connecting two turbines to the electric grid.
c
Wind park contains 20 turbines: 200 m between single turbines, plus 175 m (3.5 km total distance) to the shore.
d
Glass fibre reinforced plastics.
Table 6: Key parameters of selected wind turbines including most
capacity factors are 8% for the 30 kW plant, 10% for the 150 kW plant, and 14% for both the 600 kW and 800 kW plant. The capacity factor assumed for the European 800 kW onshore plant is 20%, calculated using the total installed capacity and corresponding electricity production by all European wind power plants in the year 2002. A capacity factor of 30% is assumed for the modelled generic 2 MW offshore turbine. This is slightly above the current average value (27.4%) for the wind park Middelgrunden, calculated using electricity production data from the years 2002 and 2003, but average wind speed would be probably higher with increasing distance to the shore.1
In addition to the material consumption, the inventory in-cludes: material processing; its transport to the manufac-turer of components and to the site; energy requirements; particle emission during preparation of the sea bottom with excavation and concrete pouring; disposal of plastics; and land use. However, manufacturers only provide total masses of the parts of the turbines and the breakdowns for indi-vidual materials have to be assumed, which can be difficult. All metals in the tower and nacelle as well as the rotor blades are assumed to be recycled. Also, the preparation of the sea bottom for the offshore turbines, e.g. digging of navigation channels and trenches for the cables, is taken into account. No replacement of main components during the lifetime is considered. Besides the capacity factors, the inventories of the 800 kW turbine installed in Switzerland and in Europe differs for transport distances and electricity mix for elec-tricity requirements for the installation.
Material consumption for the connection of the turbines to the electricity grid are based on our own estimations, since available information is limited. Only the length of the ca-bles and the conductor cross-section for the Swiss 800 kW and the 2 MW offshore turbine are known. The detailed composition of the cables had to be extrapolated from other sources. The voltages of the cable connections to the grid are 16 kV for the onshore turbine and 30 kV for the off-shore plants.
2.4 Results and discussion
The discussion of results mainly focuses on the two wind turbines analysed for European sites, as wind power is only marginally contributing to the current Swiss electricity pro-duction. This allows a comparison of average onshore and offshore conditions.
Fig. 8 shows a comparison of selected air pollutants. Total
emissions per unit of delivered electricity are separated into contributions from different parts of the energy system. In general, the 2 MW turbine causes higher emissions than the 800 kW turbine. In both cases, the largest contribution origi-nates from material manufacturing. The air emissions from the production of different types of steel for the tower and the nacelle, concrete for the foundation, glass fibre reinforced plastics for the rotor blades, are dominant in the cumulative results. The main reasons for the better environmental
on-shore performance are that the requirements of concrete and reinforcing steel for the foundation per kW capacity installed is much higher for the offshore plant and that the assumed lifetime of the offshore foundation is only half of the on-shore foundation. These factors are not completely com-pensated by the higher wind speed at sea. Additionally, the installation of the offshore turbine is much more complex and requires more energy than for onshore, which in par-ticular becomes evident comparing NOx emissions. Fossil CO2 contributes more than 90% of the emitted greenhouse
gases (in CO2-equivalents for 100 a GWP according to IPCC 2001). The absolute values of these greenhouse gas emis-sions are about 11 g/kWh for the onshore plant and about 13 g/kWh for the offshore turbine.
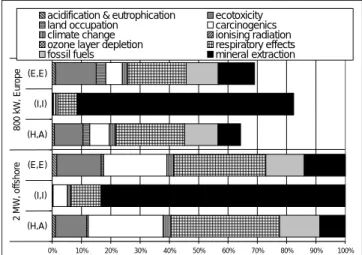
Fig. 9 shows the application of the Eco-indicator 99 method
with the perspectives (H,A), (I,I), and (E,E) to LCI results for the two turbines. This does not intend to hint at any preference among LCIA methods, but this particular method highlights differences in valuation patterns with its three perspectives. A comparison of results using all LCIA meth-ods implemented in ecoinvent is not the goal of this paper. The total scores are normalized to the maximum (= 100%) for each of the perspectives. The assessment shows a better
1 Production data from http://www.middelgrund.com/ (18.6.2004)
0% 20% 40% 60% 80% 100% 800 kW, Onshore 2 MW, Offshore 800 kW, Onshore 2 MW, Offshore 800 kW, Onshore 2 MW, Offshore 800 kW, Onshore 2 MW, Offshore CO 2 , fo ssi l NO x SO x PM 1 0
Operation Material manufacturing Mat. processing Assembling+Installation Transport Waste disposal
Fig. 8: Share of process stages for the European 800 kW onshore and
the 2 MW offshore wind turbines for selected air emissions
0% 10% 20% 30% 40% 50% 60% 70% 80% 90% 100% (H,A) (I,I) (E,E) (H,A) (I,I) (E,E) 2 M W , offs hor e 8 00 kW , Euro p e
acidification & eutrophication ecotoxicity
land occupation carcinogenics
climate change ionising radiation
ozone layer depletion respiratory effects
fossil fuels mineral extraction
Fig. 9: Comparison of electricity production at European 800 kW onshore
environmental performance of the onshore plant for all three perspectives. The contributions to total are similar for the single damage categories within the (H,A) and (E,E) perspec-tives and several categories contribute meaningfully. Mineral resource extraction dominates the (I,I) perspective. Clearly higher scores for carcinogenics and respiratory effects are mostly responsible for the worse scoring of the 2 MW tur-bine. Land occupation is the only category showing a lower score for the offshore turbine, since uses of water surface and sea bottom are not valuated. With respect to these three Eco-indicator 99 perspectives, capacity factors between about 36% and 46% would be necessary at the same offshore site to achieve an environmental performance, which is compa-rable to the onshore plant.
One further result of the analysis, not illustrated in this pa-per, is the improvement of the environmental performance with increasing capacity installed, which is a result of a de-creased material consumption per kWh electricity produced (effect of scaling). Due to the lower wind speed, results are worse for wind plants currently installed in Switzerland. Other differences in the inventories for Switzerland and Europe, due to the different electricity mixes and distances for transport of materials, have negligible effects on the cu-mulative LCI results.
2.5 Conclusion and outlook
The life cycle inventories of the modelled wind power plants show that the differences for environmental burdens depend on the capacity factor of the plants, the lifetime of the infra-structure, and the rated power. The higher these parameters are, the better is the environmental performance. The influ-ence of other possibly important factors like technology, lo-cation of production, and recycling has not been analysed. For an equal capacity factor, the environmental perform-ance of offshore turbines appears to be worse than for on-shore units. However, very high average annual wind speeds occur in large areas offshore, for which the environmental performance of offshore turbines might be superior to on-shore units. A more location-specific modelling of electric-ity production at European wind power plants would re-quire detailed data on local wind conditions. Follow-up studies shall also consider more accurate shares of materials used in the nacelle as well as new technological develop-ments, e.g. use of new materials for different parts of the turbine, which might not have negligible influence on the results of the inventories.
It must be mentioned that some environmental burdens have not been addressed in this LCA study. Depending on the location of the plants, noise and aesthetic effects on the land-scape may require to be taken into account in a holistic evalu-ation. Such factors, which may be difficult to quantify or include subjective elements, were out of scope of the ecoinvent 2000 project.
3 Recommendation and Perspective
For both systems, variations in meteorological conditions (solar irradiation and average annual wind conditions) are important. Also, the projected lifetime is a key parameter
for the assessment, although operational experience with the new technologies is not enough with regard to this aspect. The detailed inventories for different plant sizes show that it might be important to consider the actual size of such plants. The application of LCIA methods shows that it is essential to take process-specific emissions from material manufacturing into account. Nearby, all environmental impacts are caused by the plant infrastructure and not the operation.
Many production processes, especially for photovoltaic power, are still under development. Thus, future updates of the LCI should verify key assumptions on energy and mate-rial uses as well as emissions. The allocation procedure for silicon purification is dependent on the actual market con-ditions. The inclusion of results from laboratory testing might give a too optimistic picture about the environmental im-pacts caused due to the use of photovoltaic power today. With increasing experience on offshore turbines, the assess-ment of these systems may be improved. Attention should be paid to high rated power for onshore and offshore units and to foundation concepts for different water depths for offshore parks. However, major changes in the inventory results of wind power are not expected. Application of ecoinvent results to different capacity factors for offshore should be performed with care – only if the depth of water and distance from coast are comparable to what is assumed in the study.
References
Alsema EA (2000): Energy pay-back time and CO2 emissions of PV systems. Prog Photovolt Res Appl 8, 17–25
Alsema EA, Frankl P, Kato K (6.–10.7.1998): Energy pay-back time of photovoltaic energy systems: Present status and future prospects. In 2nd World Conference on Photovoltaic Solar Energy Conversion <http:/ /www.chem.uu.nl/nws/www/publica/98053.htm>, Vienna, Austria Althaus H-J, Blaser S, Classen M, Jungbluth N (2004): Life Cycle
In-ventories of Metals. CD-ROM, Final report ecoinvent 2000 No. 10, EMPA Dübendorf, Swiss Centre for Life Cycle Inventories <http:// www.ecoinvent.ch>, Dübendorf, CH
Althaus H-J, Classen M (2004): Life Cycle Inventories of Metals and Meth-odological Aspects of Inventorying Material Resources in ecoinvent. Int J LCA 10 (1) 43–49 <http://dx.doi.org/10.1065/lca2004.11.181.5> Andersen PD (7/8.3.2002): Environmentally Sound Design and Recy-cling of Future Wind Power Systems. In: IEA R&D Wind's Topical expert meeting on Material recycling and life cycle analysis (LCA) of wind turbines. Risoe National Laboratory
Bauer C (2003): Holzenergie. In: Dones R: Sachbilanzen von systemen: Grundlagen für den ökologischen Vergleich von Energie-systemen und den Einbezug von EnergieEnergie-systemen in Ökobilanzen für die Schweiz. Paul Scherrer Institut Villigen, Swiss Centre for Life Cycle Inventories, Dübendorf, CH
Bolliger R, Bauer C (2003): Wasserkraft. In: Dones R: Sachbilanzen von Energiesystemen: Grundlagen für den ökologischen Vergleich von Energiesystemen und den Einbezug von Energiesystemen in Öko-bilanzen für die Schweiz. Paul Scherrer Institut Villigen, Swiss Cen-tre for Life Cycle Inventories, Dübendorf, CH
Brand G, Scheidegger A, Schwank O, Braunschweig A (1998): Bewertung in Ökobilanzen mit der Methode der ökologischen Knappheit – Öko-faktoren 1997. Schriftenreihe Umwelt 297, Bundesamt für Umwelt, Wald und Landschaft (BUWAL), Bern
Burger B, Bauer C (2004): Windkraft. In Dones R: Sachbilanzen von Energiesystemen: Grundlagen für den ökologischen Vergleich von Energiesystemen und den Einbezug von Energiesystemen in Ökobi-lanzen für die Schweiz. Paul Scherrer Institut Villigen, Swiss Centre for Life Cycle Inventories, Dübendorf, CH
Dones R, Heck T, Faist Emmenegger M, Jungbluth N (2004): Life Cycle Inventories for the Nuclear and Natural Gas Energy Systems, and Examples of Uncertainty Analysis. Int J LCA 10 (1) 10–23 <http:// www.scientificjournals.com/sj/lca/welcome.htm>
ecoinvent Centre (2004): ecoinvent data v1.1, Final reports ecoinvent 2000 No. 1–15. CD-ROM, ISBN 3-905594-38-2, Swiss Centre for Life Cycle Inventories <http://www.ecoinvent.ch>, Dübendorf, CH Elsam (2004): Livscyklusvurdering af hav- og landplacerede vindmølle-parker, 02-170261, Elsam Engineering A/S, Kraftværksvej 53, Fredericia, DK
Frankl P (1998): Life Cycle Assessment of Photovoltaic (PV) Systems. Ph.D. thesis, University of Rome
Frischknecht R, Bollens U, Bosshart S, Ciot M, Ciseri L, Doka G, Dones R, Gantner U, Hischier R, Martin A (1996): Ökoinventare von giesystemen: Grundlagen für den ökologischen Vergleich von Ener-giesystemen und den Einbezug von EnerEner-giesystemen in Ökobilanzen für die Schweiz. Auflage, 3, Gruppe Energie – Stoffe – Umwelt (ESU), Eidgenössische Technische Hochschule Zürich und Sektion Ganzheit-liche Systemanalysen, Paul Scherrer Institut, Villigen <http://www. energieforschung.ch>, Bundesamt für Energie (Hrsg), Bern, CH Frischknecht R, Jungbluth N (2003): Allocation applied on
Co-Produc-tion Processes in Large LCI Process Network Databases. In Bauer C: International Workshop on Quality of LCI Data. Pages: 5ff <http:// www.lci-network.de/lci-quality>, Forschungszentrum Karlsruhe, DE Frischknecht R, Jungbluth N, Althaus H-J, Doka G, Dones R, Heck T, Hellweg S, Hischier R, Nemecek T, Rebitzer G, Spielmann M (2004a): The ecoinvent Database: Overview and Methodological Framework. Int J LCA 10 (1) 3–9 <http://dx.doi.org/10.1065/ lca2004.10.181.1>
Frischknecht R, Jungbluth N, Althaus H-J, Doka G, Dones R, Heck T, Hellweg S, Hischier R, Nemecek T, Rebitzer G, Spielmann M (2004b): Overview and Methodology. CD-ROM, Final report ecoin-vent 2000 No. 1, Swiss Centre for Life Cycle Inecoin-ventories<http:// www.ecoinvent.ch>, Dübendorf, CH
Frischknecht R, Jungbluth N, Althaus H-J, Doka G, Dones R, Hellweg S, Hischier R, Humbert S, Margni M, Nemecek T, Spielmann M (2004c): Implementation of Life Cycle Impact Assessment Meth-ods. CD-ROM, Final report ecoinvent 2000 No. 3, Swiss Centre for Life Cycle Inventories <http://www.ecoinvent.ch>, Dübendorf, CH Fthenakis V, Moskowitz P, Zweibel K (23.–24.7.19981999): Photo-voltaics and the Environment. Workshop Summary, Brookhaven National Laboratory and the National Renewable Energy Labora-tory <http://www.pv.bnl.gov/keystone.htm>, Keystone
Goedkoop M, Spriensma R (4.2000): The Eco-indicator 99: A dam-age oriented method for life cycle impact assessment. Methodol-ogy Report, 2nd revised ed., PRé Consultants <http://www.pre.nl/ eco-indicator99/>, Amersfoort, The Netherlands
Guinée JB (final editor), Gorrée M, Heijungs R, Huppes G, Kleijn R, de Koning A, van Oers L, Wegener Sleeswijk A, Suh S, Udo de Haes HA, de Bruijn H, van Duin R, Huijbregts MAJ, Lindeijer E, Roorda AAH, Weidema BP (2001): Life cycle assessment; An operational guide to the ISO standards; Parts 1 and 2, Ministry of Housing, Spatial Planning and Environment (VROM) and Centre of Environ-mental Science (CML), Den Haag and Leiden, The Netherlands Hagedorn G, Hellriegel E (1992): Umweltrelevante Masseneinträge bei
der Herstellung von Sonnenzellen, eine vergleichende Analyse konventioneller und ausgewählter neuer Verfahren unter Berücksich-tigung der Einsatzstoffe und Prozessketten sowie der Entsorgungs-und Recyclingmöglichkeiten – Endbericht. Forschungsstelle für Ener-giewirtschaft (FfE), München
Hassing H, Varming S (2–6.7.2001): Life Cycle Assessment for Wind Turbines. In 2001 European Wind Energy Conference and Exhibi-tion. Tech-wise A/S, Kraftværksvej 53, DK-7000 Fredericia, Copen-hagen, DK
Heck T (2004): Wärmepumpen. In: Dones R: Sachbilanzen von Energie-systemen: Grundlagen für den ökologischen Vergleich von Ener-giesystemen und den Einbezug von EnerEner-giesystemen in Ökobilanzen für die Schweiz. Paul Scherrer Institut Villigen, Swiss Centre for Life Cycle Inventories, Dübendorf, CH
International Organization for Standardization (ISO) (1998): Environ-mental management – Life cycle assessment – Goal and scope defi-nition and inventory analysis. European standard EN ISO 14041, Geneva
IPCC (2001): Houghton JT, Ding Y, Griggs DJ, Noguer M, van der Linden PJ, Xiaosu D, Climate Change (2001): The Scientific Basis. Third Assessment Report of the Intergovernmental Panel on Climate Change (IPCC), IPCC, Intergovernmental Panel on Climate Change, Cam-bridge University Press, The Edinburgh Building Shaftesbury Road <http://www.grida.no/climate/ipcc_tar/wg1/>, Cambridge, UK Jungbluth N (2003a): Photovoltaik. In: Dones R: Sachbilanzen von
giesystemen: Grundlagen für den ökologischen Vergleich von Ener-giesystemen und den Einbezug von EnerEner-giesystemen in Ökobilanzen für die Schweiz. Paul Scherrer Institut Villigen, Swiss Centre for Life Cycle Inventories, Dübendorf, CH
Jungbluth N (2003b): Sonnenkollektoranlagen. In: Dones R: Sachbilan-zen von Energiesystemen: Grundlagen für den ökologischen Vergleich von Energiesystemen und den Einbezug von Energiesystemen in Öko-bilanzen für die Schweiz. Paul Scherrer Institut Villigen, Swiss Cen-tre for Life Cycle Inventories, Dübendorf, CH
Jungbluth N, Frischknecht R (2000): Literaturstudie Ökobilanz Photo-voltaikstrom und Update der Ökobilanz für das Jahr 2000. Pro-gramm Aktive Sonnenenergienutzung: Photovoltaik Bericht Nr. 39489, ESU-services for Bundesamt für Energie <http://www.esu-services.ch>, Uster
Kato K (1999): Energy resource saving and reduction in CO2 emissions as values of PV Technology: A review of life cycle analysis on PV technologies in Japan
Knapp KE, Jester TL (2000): Energy balances for photovoltaic mod-ules: status and prospects. In: Rohatgi A & Benner J: IEEE Photovol-taics specialists conference <http://www.ieeepvsc.nrel.gov>, Anchor-age, Alaska
Lenzen M, Munksgaard J (2002): Energy and CO2 life-cycle analyses of wind turbines – Review and applications. Renewable Energy 26, 339–362
Lenzen M, Wachsmann U (2004): Wind turbines in Brazil and Ger-many: an example of geographical variability in life-cycle assess-ment. Applied Energy 77, 119–130
Palz W, Zibetta H (1991): Energy pay back time of photovoltaic mod-ules. Int J Solar Energy 10, 211–216
Pehnt M, Bubenzer A, Räuber A (2002): Life-Cycle Assessment of Pho-tovoltaic Systems – Trying to fight Deep-seated Prejudices. In: Bubenzer A, Luther J: Photovoltaics Guidebook for Decision Mak-ers. Springer-Berlin, Germany
Phylipsen GJM, Alsema EA (9.1995): Environmental life cycle assess-ment of multicrystalline silicon solar cell modules. Report, 95057, Dept. of Science Technology and Society of Utrecht University (STS-UU) <http://www.chem.uu.nl/nws/www/publica/95057.htm>, The Netherlands
Schleisner L (2000): Life cycle assessment of a wind farm and related externalities. Renewable Energy 20, 279–288
Suh S, Lenzen M, Treloar GJ, Hondo H, Horvath A, Huppes G, Jolliet O, Klann U, Krewitt W, Moriguchi Y, Munksgaard J, Norris G (2004): System boundary selection in Life-Cycle Inventories. Envi-ronmental Science & Technology 38, 657–664
wise A/S (2001): Livscyklusvurdering af vindmøller., 01-488, Tech-wise A/S, Kraftværksvej 53, Fredericia, DK
Tsuo YS, Gee JM, Menna P, Strebkov DS, Pinov A, Zadde V (23.– 24.7.1998): Environmentally benign silicon solar cell manufactur-ing. In: Fthenakis V, Moskowitz P, Zweibel K: Photovoltaics and the Environment. Pages: 1.5, Brookhaven National Laboratory and the National Renewable Energy Laboratory <http://www.nrel.gov/ncpv/ pdfs/tsuo.pdf>, Keystone
Wohler M, Schonhardt U (2001): Ökobilanz eines Vakuum-Isolations-Panel: Vergleich von Bewertungsmethoden für Umweltauswirkungen. Diplomarbeit, Nachdiplomstudium Energie, Fachhochschule beider Basel, FHBB, Basel
Received: September 28th, 2004 Accepted: November 12th, 2004