f
Temporal feature estimation during
walking using miniature
accelerometers: an analysis of gait
improvement after hip arthroplasty
K. A m i n i a n 1 K. R e z a k h a n l o u I E. De A n d r e s 2 C. Fritsch 2 P.-F. Leyvraz 2 P. Robert 1
1Swiss Federal Institute of Technology Lausanne (EPFL), Metrology Laboratory, Lausanne, Switzerland
2H6pital Orthop~dique de la Suisse Romande, Lausanne, Switzerland
A b s t r a c t - - A new method for the detection of gait cycle phases using only two miniature accelerometers together with a light, portable digital recorder is proposed. Each subject is asked to walk on a walkway at his/her own preferred speed. Gait analysis was performed using an original method of computing the values of temporal parameters from accelerometer signals. First, to validate the accelerometric method, measurements are taken on a group of healthy subjects. No significant differences are observed between the results thus obtained and those from pressure sensors attached under the foot. Then, measurements using only accelerometers are performed on a group of 12 patients with unilateral hip osteo-arthritis. The gait analysis is carried out just before hip arthroplasty and again, three, six and nine months afterwards. A mean decrease of 88% of asymmetry of stance time and especially a mean decrease of 250% of asymmetry of double support time are observed, nine months after the operation. These results confirm the validity of the proposed method for healthy subjects and its efficiency for functional evaluation of gait improvement after arthroplasty.
Keywords--Accelerometry, Gait analysis, Orthopaedic, Portable device Med. Biol. Eng. Comput., 1999, 37, 686-691
1 I n t r o d u c t i o n
NOWADAYS, APPRECIATION of the incidence of physical handi- caps and post-operative results after arthroplasties is often based on subjective estimation of the clinical evaluation. This does not reflect the real functional capacity of the patient in his/her usual activity. Considering this, several authors have established questionnaires from which functional scores are developed. Although the questions on such a scale are standardised, the answers are often subjective and the discrepancy between the patient's and the physician's evaluations is significant (LIEBERMANetal., 1996; ANDERSON, 1972; LIANGetal., 1990). Because of the lack of objectivity and reproducibility, other scientific studies have developed analysis of the specificity of the different phases of the gait cycle. The time span of each phase of the gait cycle gives the temporal parameters. Evaluation of temporal parameters during walking is a means, not only to assess some aspects of pathological walk among osteo-arthritic patients, but also to quantify their subsequent improvement after hip or knee arthroplasty (WALL et al., 1981; GIANNINI et al.,
1994). Temporal parameters are also used to predict force parameters of gait as an alternative to direct ground reaction
Correspondence should be addressed to Dr K. Aminian; email: [email protected]
First received 26 April 1999 and in final form 16 August 1999 9 IFMBE:1999
force measurements for determining daily histories of habitual lower limb loading quantities (BREIT and WHALEN, 1997). In addition to gait analysis, temporal parameters are useful in several clinical fields, such as electrical stimulation (GRAUPE et al., 1987), prediction of future fall (MAKI, 1997) and estimation of metabolic rate (HOYT et al., 1994).
Complete gait analysis, using a video camera (FERRIGNO et al., 1985), a walkway with implanted sensors or a force-plate
(HIROKAWA and MATSUMARA, 1987; MACELLARJ and
GIACOMOZZI, 1996), allows these measurements but requires a dedicated laboratory. Ambulatory systems using foot switches or pressure sensors attached to the sole are used for the monitoring of temporal parameters (ROSENROT 1982; ZHU et al., 1991; ABU-FARAJ et al., 1997). These techniques present, in general, satisfactory results in normal walking. However, in pathological gait, many problems, such as shuffling, difficulty of appropriate positioning, connecting attachment, mechanical failure and patient acceptance, render their use limited.
To compensate for the lack of information concerning pathological gait, an analysis based on accelerometry has proved to be an excellent alternative to establish the real indi- vidual characteristics of movement in daily life conditions (AMINIAN et al., 1998). In recent years, technical progress has made it possible to realise miniature acceleration sensors with integrated conditioning and a calibrating module. In addition, owing to very low consumption, these accelerometers can be supplied by battery and are a promising tool for long term ambulatory monitoring. The possibility to detect, during
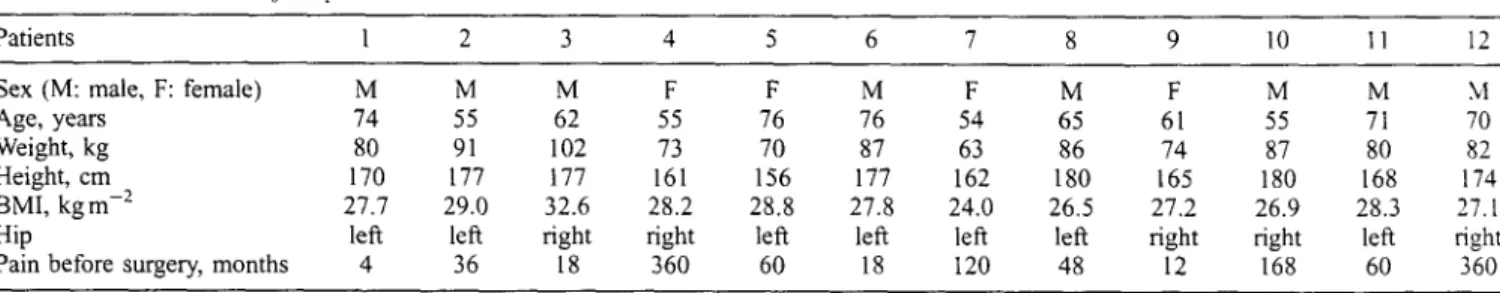
Table 1 Characteristics of 12 patients
Patients l 2 3 4 5 6 7 8 9 10 11 12
Sex (M: male, F: female) M M M F F M F M F M M M
Age, years 74 55 62 55 76 76 54 65 61 55 71 70
Weight, kg 80 91 102 73 70 87 63 86 74 87 80 82
Height, cm 170 177 177 161 156 177 162 180 165 180 168 174
BMI, kgm -z 27.7 29.0 32.6 28.2 28.8 27.8 24.0 26.5 27.2 26.9 28.3 27.1
Hip left left fight fight left left left left right fight left fight
Pain before surgery, months 4 36 18 360 60 18 120 48 12 168 60 360
normal gait, simple parameters such as step and cycle time from trunk or heel acceleration has already been shown (EVANS et al.,
1991; AMINIAN et al., 1995).
In this paper, an original method to compute precisely the value of temporal parameters using accelerometry is proposed. It has been successfully applied to assess some aspects of patho- logical walk among osteo-arthritic patients and to quantify their subsequent improvement after hip arthroplasty.
2 Method 2.1 Measurement
An accurate measurement of lower-limb acceleration signals, namely thigh acceleration, needs to be recorded for successful determination o f temporal parameters. Two piezoresistive accel- erometers and a light, portable measuring device Physilog were used to achieve this task. The two uni-axial accelerometers were attached to each leg, slightly above the knee articulation, and measured the tangential component of each thigh acceleration in the sagittal plane. These accelerometers (IC sensors 3021) are accurate, miniature and inexpensive; they have a relatively wide frequency range (0-350Hz) and measure up to -4-5 g. The signals were digitised (12 bits) by a portable datalogger* and
stored on a 1 Mbyte SRAM memory card
(AMINIAN
e t al.,1995). At the end of each recording session, the data in the memory card were transferred to a computer for analysis and evaluation.
First, to validate the accelerometric method, measurements were taken from a group of five healthy subjects. In addition to accelerometers, two FSR pressure sensors t were placed inside each shoe, under the heel and the first metatarsal (big toe). In this way, the moments o f heelstrikes and toe-offs were directly detected. Each pair o f sensors was connected in series, and the output was simultaneously digitised and recorded by Physilog, with those from accelerometers, at a sampling rate of 60 Hz. An additional, similar test was performed with a patient suffering from hip osteo-arthritis, to compare the accelerometric method with the FSR during a pathological gait.
Next, measurements using only accelerometers were taken from a group of 12 patients with unilateral hip osteo-arthfitis. 30 healthy subjects (45-77 years, 51-91 kg, 1.5-1.86 m) were used as a control group. Each subject walked at his/her own preferred speed. The walkway, 35 m long, was covered twice for each experiment and was marked at 5 m intervals. A switch connected to the Physilog recorded the time needed to walk 5 m a n d estimated the speed o f walking. Hip arthroplasty was carried out on the patients. Table 1 shows the characteristics of each patient. The gait analysis was carried out just before the operation and again, three, six and nine months afterwards.
*Physilog, BioAGM, CH tlnterlink, LU
Medical & Biological Engineering & Computing 1999, Vol. 37
2.2 Algorithm
To compute temporal parameters, such as duration of swing and total or double stances o f a gait cycle, it is necessary and sufficient to determine for each leg the precise moments o f heelstrike (when the foot first touches the floor) and toe-off (when it last takes off) during that cycle. These events give rise to distinctive features on thigh acceleration signals in the form of rather sharp negative peaks. Although the amplitude o f these peaks can, for example, depend on the subject's velocity, weight or painful articulation (in the case of arthritic patients for instance), they are nonetheless always locatable as long as it is known where to look.
Successfully to achieve this task, we should bear in mind the following observations. The swing phase of a gait cycle is characterised by a positive thigh acceleration that reaches its highest values at around mid-swing (see Fig. 1). This derives from the fact that the subject pushes the swinging leg forward, while taking support on the other leg. Prior to the swing phase, in a quick movement backward involving hip and knee articula- tions, the foot is taking off the floor to avoid scuffling or hitting the floor. As a result, a sharp negative acceleration can be observed that is associated with toe-off. At the end of the swing period, the leg is brought to a halt and put on the floor. This is the heelstrike and is also characterised by a sharp negative acceleration.
Taking advantage of these facts, we have developed an algorithm along the same lines that can be seen on the flow chart of Fig. 2. The algorithm is designed to extract from the right and left thigh acceleration a r and at, recorded during walking by Physilog, four series o f points in time. These series contain the precise instances o f heelstrikes and toe-offs of the right and left feet. For clarity, let us consider a r as the input. It is obvious that a I will be treated in the same way. We begin by identifying the time corresponding to the global maximum values Ps o f the smoothed thigh acceleration signal a6l (low- pass filtering at 3 Hz). The Ps samples represent approximately the moment of mid-swing during a gait cycle; however, their exact significance is not of interest to us. They will only be used as a reference to compute the average gait cycle g % and to select the intervals in which negative peaks reminiscent of heelstrikes and toe-offs are to be found. Therefore we next look for local minima ofarf inside intervals [Ps + 0.15 gc,,,, Ps + 0.3 g%] and [ps-0.15 gCm, Ps-0.3 9c,,,]. The result is two different series of samples Phi (heelstrikes) and Ptl (toe-offs), which is almost what we are looking for. However, we ultimately want to locate these moments on the unfiltered signal at, as, in filtering, a slight shift may have occurred. To do so, we proceed in two separate but similar steps. First, we apply a new low-pass filter at 6 Hz to arfl and we detect the minima o f this new function arf 2 in the close vicinity of Phl and Ptl. Two new sample series Ph2 and Pr2 are
re" CO t.L o~ o = Fig. 1
1.51 global maxima (mid-swing)
-1.5
l o c a l minima(toe-off) local minima (heel-strike)
time, s
Raw and filtered thigh acceleration compared with output o f FSR sensors during two gait cycles. ( . . . . ) Raw signal,
( ) filtered signal
thus obtained. Then, we look at a r in the immediate vicinity of Ph2 and Pt2 to find the minimum peaks. The result is the final time samples Phr and Ptr"
This process of gradually focusing on the exact position of heelstrikes and toe-offs on the unfiltered thigh acceleration signal can be carried out, if necessary, in more than one intermediate step. Once we are in possession o f Phi (left heelstrike), Pt/(left toe-off), Phr (right heelstrike) and Ptr (right toe-off), every temporal parameter of a gait cycle can easily be computed as a percentage o f gait cycle cjc averaged over N consecutive gait cycles. These parameters are
(a) duration of each gait cycle
9c(i) = phr(i + 1) -- Phr(i) 1 < i < N (1) (b) left stance (time between left heelstrike and left toe-off)
L S ( i ) = prt(i) - phi(i) (2) Fig. 2 688 ~ a r ~al I calibration LP filtering 1
aft1
Jt alfl
global maximum peak detection
•
Ps
defining intervals of local mirnima detection
Phl
I
i ,o , ,=aoo=oo I
Jr Ptl
I,oc. m,n,madeteetloo
I
I
I
on unfiltered signal on unfiltered signal
Phr ~_k__~Ph,
Ptr ~ _ . Ptl
[ temporal parameters (stance, double support) J
Flowchart of temporal feature detection
(c) right stance (time between right heelstrike and fight toe-off)
RS(i) = ptr(i) - Phr(i) (3)
(d) left double support (time between fight heelstrike and left toe-off), also known as left double thrust support time (WALL et al.)
LDS(i) = ptt(i) - Phr(i) (4)
(e) fight double support (time between left heelstrike and right toe-off), also known as right double thrust support time (WALL et al.)
RDS(i) = ptr(i) - pht(i) (5)
To achieve a good level o f precision for these parameters, 20 or so gait cycles are needed. This means that the subject on whom we carry out our study is asked to walk at his/her preferred speed for at least 30 m in a straight line. An increase in this distance might improve the accuracy o f the measurement, but, from a clinical point o f view, walking 30 m is reasonable for gait analysis in orthopaedic patients.
3 R e s u l t s
3.1 Detection algorithm
Using the algorithm o f Fig. 2, left and right heelstrikes (toe- offs) were detected from thigh accelerations, and the values of LS and R S were computed for 16 consecutive gait cycles (N = 16). Simultaneously, the period o f stance was detected from the FSR signal (Fig. 1), and the corresponding left and right stances over a period o f 16 cycles were computed. Fig. 3 compares values obtained from accelerations (ACC) with those o f FSR. A good agreement (R = 0.97) for both the left and right stance is found. The difference between ACC and FSR for normal subjects is not significant (N = 80, p > 0.8), and the 95% confidence interval on the mean is: - 0 . 0 2 s < mean(ACC)-mean(FSR) < 0.02 s. The averaged values o f LS and RS, in s, and as a percentage of the gait cycle are pres.ented in Table 2.
The efficiency o f the accelerometric method during patholo- gical gait, tested on one patient, was compared with the pressure sensors. Fig. 4 show two examples o f walking, where the FSR signal provides erroneous results, whereas .temporal parameters are correctly assessed from accelerations. In Fig. 4a, the first and third swing obtained from the FSR signal are approximately the
0.8 0 . 7 0
<o
0.6 0.5 R=0.97 ...'" i'1.." I"1.." ~B r'l., 9 brat1r,,%
c 1 , 9 j~B l e d t2BBBm DBBBBB B.B'B O 9 , / ~ 1 7 6 ...'" 0.5 016 0.7 f FSR, s olaFig. 3 Right stance (RS) and left stance (LS) duration, in s, obtained from accelerometry (ACC) compared with that obtained from pressure sensors (FSR). (0) LS; ( D ) RS
same and correspond to those obtained from the acceleration signals. However, the pressure sensors detect that the second swing has dropped to half its value, although there is no significant change in the acceleration patterns. This result could be caused by shuffling at the beginning of the swing inducing some pressure on the FSR that does not interfere with the thigh acceleration. In Fig. 4b, an artefact is present during the first stance in the FSR signal, owing probably to the fact that the foot was not acting properly on the pressure sensors, involving, during a short time, a strain drop on these sensors. The thigh acceleration was not affected by this artefact.
3.2 Hip osteo-arthritis patient analysis
The detection algorithm was then applied to data from 30 normal subjects. The results were averaged over 20 consecutive gait cycles to estimate the normal range o f temporal parameters. These normal ranges (mean :t: s.d.), defined as a percentage of the gait cycle, are as follows:
59% < RS, L S <_ 6 3 % 9 % < RDS, L D S < 13%
These values correspond to the established values for the normal population, which are around 60% for the duration of stance and 10% for the duration o f double support, and remain largely unchanged throughout most adult life (ROSE and GAMBLE,
1994).
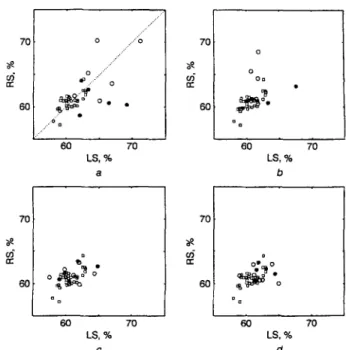
Stance and double support time were also detected from the 12 patients before the operation and at 3, 6 and 9 months following the operation. Figs. 5 and 6 show these values (averaged over 20 consecutive gait cycles) compared with normal data. By plotting RS against LS, normal data are distributed around the diagonal and centred about 60%, whereas most of the pre-operative data are spread far from the normal data (Fig. 5a). After the operation, post-operative data move towards the normal data and, at 6 months, nearly reach the normal values. The post-operative improvements are better shown with the variation in RDS and LDS. The pre-operative data are spread generally, far from the diagonal, depending on the degree of pathology (Fig. 6a). In
addition, data from patients with an arthritic left hip are distributed above the diagonal, whereas data from patients with an arthritic fight hip are mostly below the diagonal. This is owing to the asymmetry of pathology: RDS (LDS) is shorter than LDS (RDS) for patients with an arthritic right (left) hip. This discrepancy decreases strongly 3 months after the operation (Fig. 6b) and becomes almost normal after 9 months (Fig. 6d).
A student's t-test was performed on the data of the normal population (N I = 30) and o f patients (N 2 = 12) before and after the operation. According to this analysis, pre-operative data (RS, LS, RDS, LDS) are significantly different from the normal data (p < 0.005). For all the patients, the speed of walking before and after the operation and the difference between fight and left double support [RDS-LDSI are shown in Fig. 7. The speed changes significantly only 6 months after the operation (p<0.005), whereas [RDS-LDS[ becomes significantly different 3 months after the operation (p < 0.05 at 3 months, and p < 0.005 at 6 months and 9 months). Furthermore, IRS-LSI changes significantly from the pre-operative only after 9 months (p<0.10).
4 Discussion and conclusions
Comparisons between the normal population and patients on the one hand and pre-operative and post-operative patients on the other hand are carried out from temporal parameters obtained at a speed freely selected by the subject. This is because, at a freely selected speed, people walk in a dynamically equivalent manner (CHAN and CHILDleSS, 1991). This is shown in Fig. 8, where the difference between left and right double support is presented as a function o f the freely selected speed for a normal subject. This difference is less than 2%, which is not significant compared with the resolution of the measurement. In addition, as illustrated in Fig. 7, the change in the freely selected speed is not a powerful indicator of gait ability, as the relative increase in speed after nine months and over 12 patients is only 25%, whereas, for the same period, a decrease of 88% in the asymmetry of the stance time IRS-LS[ and, especially, a decrease o f 250% in the asymmetry o f the double support time
=- .o o 0 -1 1 2 3 time, s a ew 1 0 1 2 3 time, s b
Fig. 4 Two examples where FSR signal has not precisely detected swing and stance phase during pathological gait, whereas toe-offs (T) and heelsmkes (H) are correctly recognised from thigh accelerations. (a) FSR signal seems to measure a pressure during beginning of second swing, probably caused by shuffling. (b) FSR signal measures artefact during first stance. ( . . . . ) raw siena# ( )filtered signal
7O # c~ rr" 6 O 7o # c~ r r 6 O Fig, 5 .../~ ../ o ..."o /...' o ...." ~ - " . o / a e'o 10 LS, % 8 7O o~ 6O o o o n
~~176
a= 60 70 LS, % b e a 7O 6 O = o I o = a 60 70 60 70 LS, % LS, % c dRight stance (RS) against left stance (LS) as percentage of gait cycle: (a) before operation; (b) 3 months after operation; (c) 6 months after operation; (d) 9 months after operation. (0) Left, (0) right; ([]) normal
30 o~ 2 0 t-~ tr 10 30 o o o . ' o ~ ~ o " u o , ~ 9 9 9 1 '0 2'0 LDS. % a 30 20 t.r- lO 30 3o o
.~o@.
9
oo o 9 10 20 LDS, % b 20 t r 1 0 Fig. 6 o ~ 9 o 9 o e 9 20 lO o o # a 9 oo o 30 10 20 30 10 20 30 LDS, % LDS, % c dRight double support (RDS) against left double support (LDS) as percentage of gait cycle." (a) before operation; (b) 3 months after operation; (c) 6 months after operation; (d) 9 months after operation. (0) Left," (0) right; (77) normal
[RDS-LDS[ were observed. It can be concluded that the double support time is the temporal parameter that allows control o f gait symmetry recovery during rehabilitation. Any discrepancy between the durations o f left and right double limb support depends on the affected hip. Right osteo-arthritic patients have a left double support longer than the right. The reverse is true for left osteo-arthritic patients. The recovery of symmetry is progressive for every patient. The contrast with the almost equal values for a population o f normal subjects is pronounced. This result underlines that the weight transfer phase is the most demanding task during the gait cycle and certainly a painful one for arthritic patients. Furthermore, a tendency towards normality was also observed after arthroplasty.
If we consider patients 3, 4, 5,7 and 10 (Fig. 7b), IRDS-LDS[ shows no progression after arthroplasty and is already low before arthroplasty (maximum 5%, patient 3). The clinical
4 "7.c:
~3
-o" ~ 2 o Fig. 7 1 2 3 4 5 6 7 8 9 10 11 12 patients 1 2 3 4 5 6 7 8 9 10 11 12 patients b(a) Speed and (b) IRDS-LDSI variation after operation for all patients. ( I ) Before operation; (ml) 3 months, ([]) 6 months, (V] ) 9 months 12
~ 8
~4
o Fig. 8 o 1 9 9 | Oe 9 9 | 9 9 9 o 9 I I I I 4 5 6 -1 speed, km hVariation of IRDS-LDSI as functions of freely selected speed of walkT"ng for normal subject
evidence regarding this result is as follows: first, all patients had a discrete (unnoticeable unless looked for) limp, except patient 3 who had a moderate (anybody could notice it) limp before surgery; secondly, these patients are younger (mean age 60.4 years) than patients 1,2, 6, 8, 11 and 12 (mean age 67.4 years). The first group has a greater functional capacity to compensate for a painful hip joint than the second group.
Patients 1, 2, 6, 8, 11 and 12 have a rapid correction of IRDS- LDSI 3 months after arthroplasty. We explain it by the fact that pain is the responsible factor (before osteo-articular deformation and neuromuscular impairment) for the limp o f osteo-arthritic patients before and after surgery. Three months after surgery, these patients had no more pain (pain is the principal indication for.a hip arthroplasty) and almost no limp. Patient 9 is the only one still having hip pain at 6 months after surgery and has none at 9 months. This explains the slow progression o f
IRDS-LDSI
after surgery.Experiments performed on normal subjects have shown no significant difference between results obtained from accelero- metry and those o f pressure sensors attached under the foot. Additionally, accelerometers are less sensitive to artefacts present in pathological walking (e.g. foot shuffling, as shown in Fig. 4), as accelerations are measured on the leg and involve many advantages, such as high sensitivity, reproducibility, simple attachment, robustness and handling.
The error concerning the single and double support time depends on the mid-swing, heelstrike and toe-off detection time. This error is related to the time resolution of the system and parameters involved in peak detection (cutoff frequency of filters, threshold and intervals for peak searching). Errors reported in Table 2 show that the time resolution, which corresponds to the sampling period (0.017 s), is a major part of this error. By increasing the sampling rate, the resolution can be improved. However, a higher-frequency component o f accel- eration could be measured, and it is therefore necessary to adapt the cutoff frequency o f filtering for mid-swing detection and the threshold to eliminate small peaks and enhance heelstrike and toe-off detection. A cutoff frequency o f 3 Hz represents a good optimum in our tests. The intervals for heelstrikes and toe-off detection ([Ps 4- 0.15 gc m, Ps -4- 0.3 gCm] ) are fixed empirically in terms o f mean gait cycle time; however, for very slow speeds, an increase in these intervals is necessary.
The proposed method for temporal gait parameter estimation using accelerometry reveals a promising monitoring tool for functional evaluation o f gait improvement. The system used only two miniature low-cost accelerometers, with a light, portable (less than 300 g) digital recorder, and involves no discomfort for the patient, who can carry it for a long period of time. Although the results introduced in this paper concern short-time measurement (a few minutes), the system allows long-term recording for up to 12 h during free living conditions.
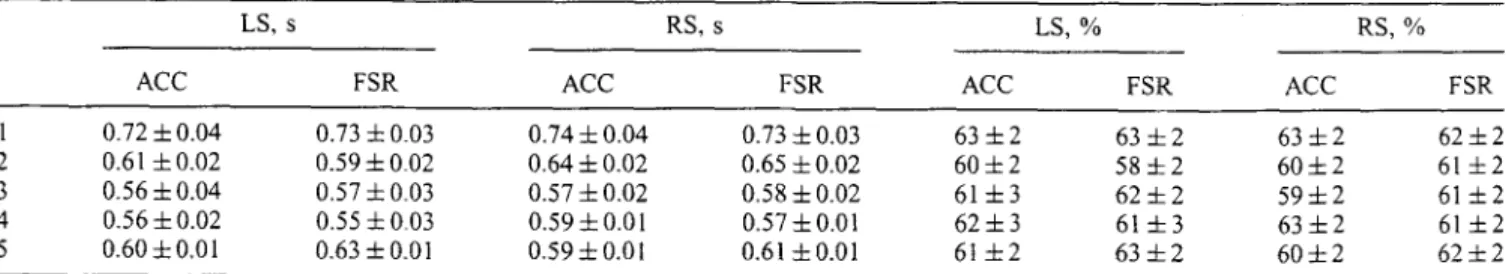
Table 2 Left stance (LS) and right stance (RS) obtained from accelerometers placed on each thigh (ACC) and FSR placed under each foot (FSR) as percentage of gait cycle, for 5 normal subjects
LS, s RS, s LS, % RS, %
ACC FSR ACC FSR ACC FSR ACC FSR
1 0.72 4- 0.04 0.73 4- 0.03 0.74 4- 0.04 0.73 4- 0.03 63 4- 2 63 + 2 63 4- 2 62 4- 2 2 0.61 + 0.02 0.59 4- 0.02 0.64 4- 0.02 0.65 4- 0.02 60 4- 2 58 4- 2 60 4- 2 61 4- 2
3 0.564-0.04 0.574-0.03 0.574-0.02 0.584-0.02 61 4-3 62-t-2 594-2 61 4-2
4 0.564-0.02 0.554-0.03 0.594-0.01 0.574-0.01 624-3 61 4-3 634-2 61 4-2
5 0.604-0.01 0.63 4-0.01 0.59 4- 0.01 0.61 4-0.01 61 4-2 63 4-2 604-2 624-2
By c o m b i n i n g these temporal parameters with other gait features, such as m o v e m e n t co-ordination, distance parameters and pain level, a n e w functional score for gait improvement and treatment evaluation can be defined.
Acknowledgment--This research was supported by the Medical Engineering Research Program University Hospital, Federal Institute of Technology, University of Lausanne. The authors wish to acknowledge the contribution of M. J. Gramiger and M. P. More[ in the design of the portable measuring device.
References
ABU-FARAJ, Z. O., HARRIS, G. F., ABLER, J. H., and WERTSCH, J. J.
(1997): 'A Holter-type, microprocessor-based, rehabilitation instru- ment for acquisition and storage of plantar pressure data', J Rehabil. Res. Dev., 34, pp 187-194
AMINIAN, K., ROBERT, R, JEQUfER, E., and SCHUTZ, Y. (1995): "Incline, speed, and distance assessment during unconstrained walking', Med. Sci. Sports Exerc., 27, pp. 226-234
AMINIAN, K., ROBERT, Ph., JI~QUIER, E., and SCHUTZ, Y. (1995):
'Estimation of speed and incline of walking using neural network', IEEE Trans. Inst. Meas., 44, pp. 743-746
AMINIAN, K., DE ANDRES, E., REZAKHANLOU, K., FRITSCH, C., DEPAIRON, M., SCHUTZ, Y., LEYVRAZ, E E, and ROBERT, Ph.
(1998): 'Motion analysis in clinical practice using ambulatory accelerometry, Captech 98, LNAI 1537, Springer-Verlag, pp. I-11 ANDERSON, G. (1972): 'Hip assessment: a comparison of nine
different methods, J Bone Joint Surg.', 54B, pp. 621-625 BRUIT, G. A., and WHALEN, R. T. (1997): 'Prediction of human gait
parameters from temporal measures of foot-ground contact', Med. Sci. Sports Exerc., 29, pp. 540-547
CHAN, R. B., and CHILDRESS, D. S. (1991): 'Temporal factors of self- selected free-paces walking: relationships to an inverted pendulum method', Adv. Bioeng., 20, BED, ASME, pp. 525-530
EVANS, A. L., DUNCAN, G., and GILCHRIST, W. (1991): 'Recording accelerations in body movements', Med. Biol. Eng. Comput., 29, pp. 102-104
FERRIGNO, G., and PEDOTrI, A. (1985): 'ELITE: A digital dedicated hardware system for movement analysis via real-time TV signal processing', [EEE Trans., BME-32, pp. 943-950
GIANNINI, S., CATANI, E, BENDETTI, M. G., and LEARDINI, A. (1994): 'Gait analysis: methodologies clinical applications', IOS Press, Amsterdam
GRAt/PE, D., GROSSPIETSCtt, J. K., and BASSEAS, S. E (1987): 'A single-microphone-based self-adaptive tilter of noise from speech and its performance evaluation', J. Rehabil. Res. Dev., 24, pp. 119- 126
HIROKAWA, S., and MATSUMARA, K. (1987): 'Gait analysis using a measuring walkway for temporal and distance factors', Med. Biol. Eng. Comput., 25, pp. 577-582
HOYT, R. W, KNAPIK, J. J., LANZA, J. E, JONES, B. H., and
STAAB, J. S. (1994): 'Ambulatory foot contact monitor to
estimate metabolic cost of human locomotion', J Appl. Physiol., 76, pp. 1818-1822
LIANG, M. H., FOSSET, A., and. LARSON , M. (1990): 'Comparisons of five health status instruments for orthopedic evaluation', Med. Care, 28, pp. 632-642
LIEBERMAN, J. R., DOREY, E, SHEKELLE, P., SCHUMAKER, L.,
THOMAS, B. J., KILGUS, D. J., and. FINERMAN, G. A. (1996): 'Differences between patients' and physicians' evaluations of out- come after total hip arthroplasty', J. Bone Joint Surg., 78A, pp. 835-838
MACELLARI, V., and GIACOMOZZI, C, (1996): 'Multistep pressure platform as a stand-alone system for gait assessment', Med. Biol. Eng. Comput., 34, pp. 299-304
MAKI, B. E. (1997): 'Gait changes in older adults: predictors of falls or indicators of fear', J Am. Geriatr. Soc., 453, pp. 313-320
ROSE, J., and GAMBLE, J. (1994): 'Human walking' (Williams & Wi[kins, Baltimore), p. 29, p. 143
ROSENROT E (1982): 'Footswitch stride analyser', Bull. Prosthet. Res., 18, p. 284
WALL, J. C., ASHBURN, A., and KLENERMAN, L. (1981): 'Gait analysis
in the assessment of functional performance before and after total hip replacement', J. Biomed. Eng., 3, pp. 121-127
ZHU, H. S., WERTSiEH, J. J., HARRIS, G. E, LOFTSGAARDEN, J. D., and
PRICE, M. B. ( 1991): 'Foot pressure distribution during walking and shuffling', Arch. Phys. Rehabil., 72, pp. 390-397
Author's biography
KAMIAR AMINIAN was born in Tehran, Ivan, in
1958. He received his Electrical Engineering degree in 1982 and his PhD in the field of Biomedical Engineering in 1989 from the Swiss Federal Institute of Technology, Lausanne, Swit- zerland. Since 1982, he has worked in the Metrol- ogy Laboratory of the Swiss Federal Institute of Technology, Lausanne. From 1994 to 1996 he was Assistant Professor at the Sharif University of Technology, Tehran. In July 1996, he rejoined the Metrology Labora- tory of Swiss Federal Institute of Technology, where he is head of the medical instrumentation group. His research interests include trans- ducers, human body movement analysis, ambulatory systems for the measurement of physiological information and biomedical signal processing.