HAL Id: hal-01149372
https://hal.archives-ouvertes.fr/hal-01149372v2
Submitted on 13 May 2015
HAL is a multi-disciplinary open access archive for the deposit and dissemination of sci-entific research documents, whether they are pub-lished or not. The documents may come from teaching and research institutions in France or abroad, or from public or private research centers.
L’archive ouverte pluridisciplinaire HAL, est destinée au dépôt et à la diffusion de documents scientifiques de niveau recherche, publiés ou non, émanant des établissements d’enseignement et de recherche français ou étrangers, des laboratoires publics ou privés.
To cite this version:
P. Guigon, Valentin Bellassen, P. Ambrosi. Voluntary Carbon Markets: What the Standards Say...: Voluntary Carbon Markets. [Research Report] 2009-4, auto-saisine. 2009, 46 p. �hal-01149372v2�
To cite this version:
P. Guigon, Valentin Bellassen, P. Ambrosi. Voluntary Carbon Markets: What the Standards Say.... [Research Report] auto-saisine. 2009, 46 p. <hal-01149372v2>
HAL Id: hal-01149372
https://hal.archives-ouvertes.fr/hal-01149372v2
Submitted on 13 May 2015HAL is a multi-disciplinary open access archive for the deposit and dissemination of sci-entific research documents, whether they are
pub-lished or not. The documents may come from
teaching and research institutions in France or abroad, or from public or private research centers.
L’archive ouverte pluridisciplinaire HAL, est
destin´ee au d´epˆot et `a la diffusion de documents
scientifiques de niveau recherche, publi´es ou non,
´emanant des ´etablissements d’enseignement et de
recherche fran¸cais ou ´etrangers, des laboratoires
N°
2009
-4
The Mission Climat of the CDC-Climat department at Caisse des Dépôts is a research center on
climate change economics. www.caissedesdepots.fr/missionclimat
Voluntary Carbon Markets: What the Standards Say...
Pierre Guigon
1, Valentin Bellassen
2and Philippe Ambrosi
3April 2009
Abstract
Although still accounting for a small segment of the global carbon market, the voluntary carbon market is a place for innovation where original solutions are proposed to deal with some challenges faced by the regulatory market, including efforts to value the occasional ancillary benefits of climate action, to simplify methodologies, or to guarantee the permanence of forestry assets. These innovations are reflected in the different standards used for voluntary offset projects and may provide some valuable lessons for on-going post-2012 negotiations. This study analyses two aspects of these standards: the type of projects they attract, and the transaction costs entailed by their procedures.
Projects certified by “basic carbon standards” such as the VCS, the VER+ and the CCX are very similar to regular CDM projects, albeit for their size which can be smaller. Projects certified by “multiple benefits carbon standards” such as the GS and the CCB Standards however tend to be more diverse than CDM projects, both in terms of project location and technology.
For large-scale projects, transaction costs can differ by up to 100% between standards, although they remain small compared to credit prices. For small-scale projects however, they can represent a real burden with costs around 2-3 €/tCO2e. The
analysis of the internal rate of return (IRR) of hydro projects leads to a similar conclusion: as overall project costs dwarf certification costs, the choice of the standard has little influence on the IRR. However, for projects that require lower initial investments, such as biogas capture or manure management, the conclusion could be very different.
1 Pierre Guigon delivered this work as a research fellow at Mission Climat of Caisse des Dépôts and
APREC (www.aprec.net) where his research focused on transaction costs in emission reduction projects.
He is currently a Product Manager with the Business Development of BlueNext. p.guigon@bluenext.eu
2 Valentin Bellassen is a researcher at APREC. He is concurrently undertaking a PhD at Laboratoire des
Sciences du Climat et de l’Environnement (LSCE) on forest management and climate modeling.
valentin.bellassen@caissedesdepots.fr
3 Philippe Ambrosi is a researcher in the Climate Change Team of the World Bank.
Note
The euro/dollar conversion rate used in this study is 0.69 dollar per euro.
Acknowledgments
This study has been prepared thanks to the insight of about 30 people from various organizations who accepted to share their experience and some valuable information with us. We wish to thank them especially Katherine Hamilton (Ecosystem Marketplace), Joanna Durbin and Steve Panfil (Climate Community and Biodiversity Alliance), Edwin Aadlers and Josh Harris (Voluntary Carbon Standard Association), Meinrad Bürer and Michael Schlup (Gold Standard Foundation), Thomas Classen (Tüv Süd), Jeff Hayward (Rainforest Alliance), Clément Chenost (Ernst & Young), Helge Zink (Tricorona), Martin Stadelmann (Myclimate), Haike Van de Vegte (Onecarbon), Shelagh Whitley (Camco), Arnaud Viel (Ecosecurities), Sascha Lafeld (Firstclimate), Yunnus Arikran (The Regional Environmental Center Turkey), , Paula DiPerna and Stephen McComb (Chicago Climate Exchange) as well as numerous others that chose to remain anonymous.
We also wish to thank Franck Lecocq (Agro ParisTech) for his in-depth review and valuable comments.
Working papers are research materials circulated by the authors for purpose of information and discussions. They have not necessarily undergone formal peer review.
3
Table of Content
1.
Introduction ... 4
2.
The standards viewed from the projects they certify ... 6
2.1. Material and methods ... 6
2.2. Pre-CDM credits: an ebbing wave?... 7
2.3. Geographical distribution of projects: multiple-benefit carbon standards reach outside of the CDM traditional range ... 10
2.4. Project technology: towards more visible co-benefits and innovation ... 13
2.5. Projects size: related to transaction costs?... 15
2.6. The puzzling market for standards ... 16
3.
Third party standards and transaction costs ... 18
3.1. Material and methods ... 18
3.2. Offset project cycle: the CDM benchmark... 19
3.3. Transaction costs for certification: light on the differences ... 20
3.4. Transaction costs: do they matter? ... 28
3.5. The certification timeline: voluntary standards demonstrate valuable flexibility features in the actual context ... 30
4.
Conclusions ... 32
References ... 34
Annex 1: Matrix of transaction costs for non-forestry offset projects... 37
Annex 2: Matrix of transaction costs for forestry offset projects ... 42
1. Introduction
As consensus is growing on the necessity to mitigate future climate change by reducing current emissions, some companies, institutions, and individuals have taken steps to reduce their carbon footprint, even though they are not required to do so by regulation. This “voluntary” demand for carbon offsets, generated by projects that reduce emissions, is driving the “voluntary carbon market”. In their reference publication on the topic, Hamilton et al. (2008) distinguishes between the Over The Counter (OTC) market, which corresponds to the definition we just mentioned, and the Chicago Climate Exchange (CCX), a voluntary cap-and-trade system (see Box 1). Although the voluntary OTC market remains about 15 times smaller than the compliance offset market (CDM and JI), it has recently grown very rapidly. Hamilton et al. (2008) estimates that volumes transacted have grown almost five-fold since 2005 reaching 41MtCO2e in 2007, while value grew almost seven-fold over the same
period, to US$258million.
This spectacular growth was not taken for granted in 2007: journalistic investigations and reports by NGOs unearthed projects of doubtful environmental integrity. Companies make up about 80% of total voluntary demand for carbon offsets. As one of their leading incentives is to communicate on their environmental responsibility, they are very sensitive to the risk of unfavorable press. The fact that their demand grew so much despite the concerns raised about offset quality hints that some progress has been made on that end to reassure buyers. The emergence of credible standards relying on robust methodologies and monitoring plans to guarantee emissions reductions, and sometimes other social and environmental benefits, has probably been instrumental in building the confidence of prospective buyers.
Ecosystem Marketplace lists 13 offset project standards4 on the voluntary market, and
referred to 2007 as “the year of the standard”. These standards can be classified in two categories, serving two types of needs. “Basic carbon standards”, such as the Voluntary Carbon Standard (VCS) or the Verified Emission Reductions plus (VER+), certify carbon accounting methods and guarantee that each credit they issue corresponds to an emission reduction of one ton of CO2e. “Multiple-benefit carbon
standards”, such as the Gold Standard or the CCB Standards, also include broader environmental and social aspects. A carbon credit that has been awarded this type of standard includes an emission reduction of one ton of CO2e, but also the guarantee
that the project generating this reduction provides additional benefits, to local communities or to ecosystems. “Basic carbon standards” are aimed at buyers focused on carbon accounting while multiple-benefit carbon standards” meet the demand of
4The California Climate Action Registry’s Climate Action Reserve, CarbonFix Standard, Chicago
Climate Exchange, Offsets Program , Climate, Community, and Biodiversity Standards, Greenhouse Friendly, The Gold Standard, ISO 14064 Standards, Plan Vivo, Social Carbon , Voluntary Carbon Offset Standard , VER + Standard , the Voluntary Carbon Standard. The main features of those highlighted in green are detailed in Table 1; for more details on the others refer to Hamilton et al. (2008), p 48-51.
buyers who also need to “tell a beautiful story” (high contribution to sustainable development) about the offsets they use.
Out of the 13 offset project standards existing on the voluntary carbon market, we chose to focus on only five of them, not including the CDM which is also widely used to certify emissions reductions sold on the voluntary market, and which we use here as a benchmark for comparison. The five standards are the Voluntary Carbon Standard (VCS), the Gold Standard (GS VER – GS CDM)5, the VER+, the Climate,
Community and Biodiversity (CCB) Standards and the Chicago Climate Exchange offset program (CCX). They are the most commonly used standards on the voluntary market, totaling 56% of all voluntary certified projects in 2007 (Hamilton et al., 2008) and market participants often cite them as the most promising. Moreover, they provide an exhaustive coverage of standard types: three of them are basic carbon standards (VCS, VER+ and CCX), and the two others are multiple-benefit carbon standards (GS and CCB Standards). Four of them allow the certification of forestry projects6, i.e. the VCS, CCX, VER+ and CCB Standards, while the GS does not. The
CCB Standards can only be applied to land-based carbon projects, including agriculture, forestry and other land-use, while the GS can only be applied to renewable energy and end-use energy efficiency projects. The most important features of these standards are displayed in Table 1.
Table 1: Features of the standards studied
Name Sponsors Launch date Project types Co-benefits OTC m arket share
Voluntary Carbon Standard (VCS)
The VCS Association is supported by various carbon market actors
March 2006: VCS V 1.0 Nov. 2007: VCS 2007
Release of new version i mmi nent
Does not verify quantified carbon credits but validate that the pr ojec t design achi eves climate, community and biodiversity benefits. Must come on top of a carbon accounting standard to generate genuine VERs.
All Basic carbon standard High: 27%
On the rise
Gold standard (GS VER, GS CDM)
The Gold Standard Foundation is supported by 60 NGOs and charitable organizations (including WWF)
2003: GS CDM V 1.0 2006: GS VER V 1.0 Sep.2008: GS V 2.0
Renewable energy, end-use energy efficiency
Multiple-benefits carbon standard Small: 9% On the rise
Verified Emission Reduction + (VER+)
The VER+ is administrated by the german auditing company Tüv Süd
April 2007: VER+ V 1.0 May 2008 VER+ V 2.0
All, except large hydro Basic carbon standard Small: 9%
Stable
Climate, Com munity, and Biodiversity Standards (CCB Standards)
The C limate Community, and Biodiversity Alliance is supported by NGOs (incl. CI, TNC, CARE) and companies (BP, Intel, SC Johnson)
May 2005: CCB Standards V 1.0 Dec. 2008: CCB standards V 2.0
Land Use, Land Use Change and Forestry (LU LUC F)
Multiple-benefits carbon standard. Very small: 2% On the rise
CCX Offsets Program (CCX)
The Chicago Climate Exchange counts more than 350 CCX members (capped emitting industries,market actors)
2003 Agricultural, coal mine
and landfill methane, carbon soil, forestry, renewable energy, ozone depleting
Basic carbon standard Small: 7%
Declining
Source: Mission Climat of Caisse des Dépôts.
5Both the Gold Standard and the CCB Standards can come on top of the CDM label, or certify
purely voluntary projects. As the procedure is slightly different in these two cases, we chose to separate them and treat each case as an independent standard: GS VER, GS CDM, CCB Standards and CCB CDM.
6 As opposed to the CDM compliance market, forestry projects have always been high in demand
in the voluntary markets. They were the source of 37% of the credits sold on the OTC in 2006, and 15% in 2007.
This study aims to analyze whether or not these different standards attract different types of projects and understand what are, from the project sponsor and developer point of view, the relative benefits of developing a project along a specific standard among those in existence in the voluntary market. In particular, we examine the financial implications (transaction costs and operating time) of this choice; this study may therefore also help identify lessons at a time of intense discussions and propositions about re-thinking and reforming the CDM as a helpful tool for the challenges lying ahead.
2. The standards viewed from the projects they certify
This section analyzes, for each of the above-listed standards, several characteristics of candidate or registered projects, including their size, their location, and the technology they use to reduce emissions. As most standards exist only since one or two years, we chose to include their “pipeline” in the analysis in order to increase sample size. The “pipeline” of a standard consists of projects that have applied for certification under a standard, but have not yet been certified. In this analysis we also include the CDM pipeline for comparison (UNEP RISØ as of July 2008); to make the CDM project portfolio comparable to those of young standards and thus capture any changes in CDM application trends, we only kept CDM projects that requested registration after January 1st, 2007.
2.1. Material and methods
All standards must keep track of the projects they certify. Most often, they maintain a project database or a registry which are available online. The pipeline however is seldom listed. Moreover, some interesting characteristics are sometimes lacking. We therefore completed these databases with several other sources:
o Information provided by the standards administrators,
o Project Design Documents (PDDs) available online from the standards’
project databases,
o PDDs displayed online by Designated Operational Entities’ (DOEs), o Project portfolios displayed online by several project developers.
The information gathered from these different sources allowed us to compile a database of 415 offset projects, either certified by or in the pipeline of one of the five standards we selected for this study. Given the difficulty of accessing information and the heterogeneity of certification processes among standards, we do not guarantee that it constitutes an exhaustive list of their respective portfolios and pipelines. Nevertheless, for each standard we presented the projects sample to the standard’s administrator. After a check of the sample and the characteristics we drew from it, all administrators reckoned that it was representative of the projects they certify.
7
In this section, we also look at the demand side of standardisation. We tried to determine whether carbon credits are sold at a premium price if and when they are certified. This market analysis is based on existing data published on the subject by Hamilton 2008, WWF 2008, and New Carbon Finance 2008, completed with direct interviews of market participants (9 offset retailers, and 3 carbon asset managers).
Box 1: What about CCX offsets?
The CCX is a voluntary cap-and-trade system. Its “full members” are U.S-based emitting industries that have committed to reducing their GHG emissions. At the beginning of the year, they are allocated a number of Carbon Financial Instruments (1 CFI=100tCO2e) corresponding to their reductions commitments.
Every year, they must surrender enough allowances to cover their emissions. Offset project developers (so-called “providers” or “aggregators”) can also get enrolled as “participant members” and provide the trading platform with CCX verified offsets. Once on the platform, these CCX project-based credits and the CCX allowances are commoditized into Carbon Financial Instruments (CFIs) that can be purchased by Members or Liquidity Providers for compliance or other purposes.
Such offsets are more akin to CDM credits used for compliance than to voluntary offsets purchased as part of a voluntary decision to offset emissions, for example to offer “carbon neutral” products or services. The CCX global offset portfolio is, therefore, not comparable to the portfolio of other standards. However, some CCX participant members provide an offset retailing service to individuals and companies that are not members to the CCX and yet want to offset some or all of their emissions with CCX project-based credits. In that case, the CCX offset program is used as a standard for the voluntary OTC market. It is this use of CCX offsets that we intend to survey here. We therefore restricted our analysis of CCX projects to those intended to be sold on the OTC market.
Dozens of organizations are registered as “offset providers” or “offset aggregators” in the CCX. We identified those who were selling offsets on the OTC market – that is to non-CCX members – by scanning their website. This was confirmed by interviewing these offset providers. This way, we were able to confirm that offsets directed to the OTC market came only from four offset retailers offering credits from a total of 18 CCX verified projects. In 2007, only 0.5 MtCO2e/year of emissions reductions they generated were sold on the OTC,
which is 13% of the estimate of Hamilton et al. (2008) for CCX credits transacted the same year. As CFIs are standardised contracts that incorporate a variety of products, the remaining 87% may therefore consist in CCX allowances, and not in project-based CFIs.
2.2. Pre-CDM credits: an ebbing wave?
“Retro-active crediting” is no longer allowed for CDM projects registered after March 31st 2007. This means that only reductions occurring after project registration can be credited. While they are awaiting registration by the CDM Executive Board, some offset projects seek certification under a voluntary standard. Because they allow
CDM methodologies, the VCS, VER+, and GS VER are interesting ways for these so-called “pre-CDM” projects to start generating carbon credits before their CDM registration date. In our database, we distinguish between strictly voluntary projects and pre-CDM projects if the latter present an official UNFCCC PDD and appear in the UNEP RISOE CDM pipeline. Figure 1 shows, for each relevant standard, the share of pre-CDM credits within their portfolios of projects generating credits in 2007 and 2008.
Figure 1: Share of pre-CDM credits within VER+, VCS and GS portfolios (% of credits) VER+ Pre-CDM VER 93% VER 7% Credits generated in 2007 13 projects, 419 KtCO2e Pre-CDM VER 2% VER 98% Credits generated in 2008 4 projects, 366 KtCO2e VC S VCUs 29% pre-CDM VCUs 71% Credits generated in 2007 27 projects VCUs 40% pre-CDM VCUs 60% Credits generated in 2008 39 projects GS VE R GS VERs 41% pre CDM/JI VERs 59% Credits generated in 2007 GS VERs 100% Credits generated in 2008 17 projects, 976 KtCO2e 13 projects, 659 KtCO2e
By way of example, our database consists of 13 VER+ projects generating credits in 2007 (11 CDMs and two VERs) while we have only four VER+ projects for 2008 (one pre-CDM and three VERs). Consequently, among the 13 pre-pre-CDMs crediting in 2007, 12 passed UNFCCC registration over 2007 and the one left continued to generate pre-CDM credits in 2008 with the latter two strictly VERs and one new entrant to the pipeline.
9
In 2007, pre-CDM credits produced under the VCS, VER+, and GS VER accounted for respectively 71%, 93% and 59% of their portfolios. In their 2008 pipeline, these shares drop to 60%, 2%, and 0%, as many projects have successfully registered over 2007. Most pre-CDM projects certified under the VCS and VER+ became CDM projects, while those certified under the GS CDM all switched to generating GS CERs after passing UNFCCC registration over 2008. As the first commitment period of the Kyoto protocol begins, 2008 is also the first year when pre-JI projects have an opportunity to be registered, to generate JI credits, and thus be removed from the pre-JI projects category.
These figures show that in 2008 the supply of these standards started to diverge towards “strictly” voluntary projects. As the delays in the CDM registration process tend to grow, this sharp drop is rather counter-intuitive. This may however be explained as follow:
Claiming pre-CDM credits is no longer allowed under the GS. Only projects that have been submitted for CDM validation prior to January 31st, 2008 can indeed apply for the GS VER and only if they can prove they have been facing unexpected delays in the CDM registration process. For projects coming on line later on, pre-CDM VERs cannot be verified along any standard if they wish to apply for the GS CDM.
In the early stages of their existence, the VER+ and VCS may have seen pre-CDMs over-represented within their portfolios as project developers would tend to prioritise them since they used to command a higher price on the voluntary market (see section 1.6) and are developed along the CDM standard and thus offer more information available for over-booked DOEs (see section 2.5).
However, the full pipelines of the VCS and VER+ are not readily available, as projects are directly approved by auditors. For these two standards, projects can also claim credits retro-actively. Given the increasing bottlenecks along the UNFCCC registration process and subsequent delays incurred by many projects applying for CDM registration, this possibility of faster and/or retroactive crediting could be attractive to project developers. Therefore, other pre-CDM waves on the voluntary market cannot be ruled out.
Moreover, with persisting uncertainties on the post-2012 front, some project developers are seeking a double certification CDM-Voluntary Standard as a risk mitigation strategy: should the CDM market loose momentum in the running up to 2012, they could try selling their credits on the voluntary market. This may however oversupply the voluntary market causing significant effects on the price of VER credits.
Due to the preponderance of pre-CDM projects in the full portfolios of the VCS, VER+, and, to a lesser extent, in that of the GS VER, it will thus be important to distinguish them from “strictly” voluntary projects in the rest of this section. This distinction leads to more limited sample sizes, especially for the VER+ whose number of projects in our database drops to 8.
2.3. Geographical distribution of projects: multiple-benefit carbon standards reach outside of the CDM traditional range
Figure 2: Geographical distribution
(percentage of the number of projects in the sample)7
Africa 2% Europe & central asia 2% Asia 75% South America 21% CDM
730 projects, reg. request after Jan 07, UNEP RISO
Turkey 27% Asia 45% U.S. 11% Europe & Russia 3% AmericaSouth 14% VCS 80 projects Turkey 56% Asia 15% U.S. 23% Europe 3% South America 3% VCS without pre-CDM 39 projects US 78% Asia 11% Europe 11% CCX on OTC market 18 projects Australia / NZ 3% Europe & Russia 19% Latin America 10% Asia 42% Africa 7% Turkey 19% VER+ 31 projects Turkey 75% South America 25%
VER+ without pre-CDM
8 projects South America 40% Asia 19% Africa 35% Europe 3% Australia/ NZ 3% CCBS 90 projects Asia 35% Turkey 42% Africa 14% South America 4% Australia/ NZ 2% U.S. 2% Russia 1% GS VER 93 projects Asia 36% Turkey 43% Africa 15% South America 4% U.S. 2%
GS VER without pre-CDMs
90 projects Asia 79% Africa 7% South America 14% GS CDM/JI 103 projects
Source : Mission Climat of Caisse des Dépôts.
7The samples sometimes include projects that are no more generating credits in 2008. This is the
11
The VCS and VER+ have a large share of Asian projects, accounting respectively for 45% and 43% of their full project portfolios. On the contrary, projects in Africa are under-represented; to date, we have been able to track only 2 VER+ projects and no VCS project in Africa (both are pre-CDMs) and 3 in South America. For the VCS, our database only has one project registered in Africa.
These results highlight the similarities that these two “basic carbon standards” have with the CDM in terms of project geographical distribution. This is probably due to their large share of pre-CDM projects. Indeed, when these are removed, mainly Turkish and/or U.S. projects remain in their portfolios. The specific Annex 1 – non-Annex B status of Turkey means that even these projects, while not being officially pre-CDM, may be ultimately directed to the compliance market (see Box 2). Indeed, there are no projects in the Middle East outside of Turkey. This tends to show that the VCS and the VER+ are essentially pre-compliance standards and the relatively high representation of “voluntary” projects based in US, Europe and Turkey in the VCS pipeline suggests that the VCS, in addition to being used to value emissions reductions prior to CDM registration, is also used to anticipate future climate change legislation such as a federal Cap & Trade in the U.S..
Unlike the GS CDM/JI whose 100% CDM portfolio compares to that of the CDM, the GS VER has a significant share of African projects (14%), yet a share of South American projects smaller than the VCS and the VER+. Turkey is here again well represented with 42% of the GS VER projects.
With 35% of CCB Standards projects in Africa and 40% in South America, AFOLU (Agriculture, Forestry, and Other Land-Uses) projects confirm their strong potential for development out of Asia, and especially in Africa. As many projects are currently seeking the double accreditation VCS+CCB Standards, the VCS portfolio may soon become more diversified, with more projects in Africa and South America. The Plan Vivo System8, another standard solely dedicated to forestry and land-use projects,
confirms this trend with three operational projects in Mexico, Uganda and Mozambique and two others under development in Rwanda and Malawi.
The presence of pre-JIs diversifies several portfolios towards Europe and Russia, and the GS VER has 2 of them in New Zealand.
Multiple-benefit carbon standards (GS VER and CCB Standards) thus attract projects outside of the CDM traditional range. In that respect, they can be seen as complementary to the CDM.
Although the CCX allows the enrolment of projects out of the U.S. ground, 78% of the CCX projects whose credits are for sale on the OTC are U.S domestic projects. The remaining 22% are two Asian and two German projects. Since the CCX no longer enrols projects in EU ETS countries because of double-counting issues, this confirms that some old-vintage credits (before 2005) are still for sale on the OTC.
We can finally note that Australia is almost absent in our database, as the CCB Standards is the only standard to have Australian projects (two) in its pipeline. This may be due to the dominating position of the “Greenhouse Friendly” standard managed by the Australian government. This “process standard” certifies both the quality of offset projects and the way companies measure the emissions they want to offset. The use of New South Wales Greenhouse Abatement Certificates9 (NGACs) to voluntarily offset GHG emissions has also lately gained increasing interest from individuals and companies in Australia.
We can finally note that Australia is almost absent in our database, as the CCB Standards is the only standard to have Australian projects (two) in its pipeline. This may be due to the dominating position of the “Greenhouse Friendly” standard managed by the Australian government. This “process standard” certifies both the quality of offset projects and the way companies measure the emissions they want to offset. The use of New South Wales Greenhouse Abatement Certificates9 (NGACs)
to voluntarily offset GHG emissions has also lately gained increasing interest from individuals and companies in Australia.
Box 2: The Turkish niche
Turkey officially became the 189th Party to the UNFCCC in 2004; as an advanced
developing country with lower GHG emissions per capita compared to other OECD and Annex-I countries, it was granted recognition of “its position that is different than other Annex I Parties”. By that time, the Kyoto protocol had been adopted by the other Parties to the UNFCCC (1997), leaving Turkey out of the Annex B. Turkey thus has a unique status of “Annex I non Annex B” country, keeping it from hosting either CDM or JI projects. In such a context, Turkey rapidly became a niche for the voluntary market. We were able to track 64 Turkish projects, all to be operational by 2010. 34 of them are wind projects, 22 hydro, two geothermal and two landfill gas. This highlights Turkey’s strong potential for renewable energy sources. As a matter of fact, the GS VER is
predominantly used in this market with 45 projects. Our database also lists 6 VER+ projects and twelve VCS, the 5 remaining are hydro projects that have not applied any standard. We only have emission reductions information for 54 projects. Should these 54 certified projects deliver as expected, they would generate 5.1 MtCO2e/year by 2010, and
a total of 19.7 MtCO2eby 2012. Taking
account of the 64 projects, we can estimate the latter figure to reach 22.6 MtCO2e.
Source: Mission Climat of Caisse des Dépôts.
Arikran et al. (2008) sees Turkey’s preponderant role in the voluntary market as a strong commitment to accessing post-2012 global carbon markets. The talks between the Turkish Government and Parliament led the country to ratify the Kyoto Protocol in February 2009. It now remains to be seen to what extent these “early” projects may integrate post-2012 flexibility mechanisms.
Hydro 41% Wind 53% Geoth 6% Landfill gas 3% 64 projects
9 NGACs are energy efficiency certificates traded by large electricity suppliers and users under the
New South Wales Greenhouse Gas Abatement Scheme implemented in 2003. Participants must meet mandatory emission reductions target by purchasing and surrendering NGACs created from activities that reduce electricity consumption.
2.4. Project technology: towards more visible co-benefits and innovation
Figure 3: Project technology (percentage of the number of projects in the sample)10 Other 1% Biogas 9% Biomass energy 18% Energy efficiency 18% Fuel switch 4% Hydro 22% Landfill gas 8% Coal mine Methane 1% Wind 14% HFC 1% NO2 4% CDM
730 projects, reg. request after Jan 07, UNEP RISO
Biogas 17% Hydro 42% Wind 20% Coal Mine 3% EE 5% Cement 1% Fugitive 1% Fuel switch 1% Geoth 1% Landfill 6% Biomass 3% VCS 80 projects Biogas 13% Hydro 59% Wind 10% Coal Mine 2% EE 3% Fug 3% Landfill 10% VCS without pre-CDM 39 projects Landfill Gas 6% Biogas 17% Fuel Switch 6% Coal mine methane 6% Forestry 27% Ag soil conservation 38% CCX on OTC market 18 projects Wind 7% Hydro 30% Biomass energy 10% Fossil f uel switch 17% Energy efficiency 14% HFC 3% Fugitive 3% Coal mine methane 13% Landfill gas 3% VER+ 31 projects Biogas 13% Hydro 59% Wind 10% Coal Mine 2% EE 3% Fug 3% Landfill 10% VCS without pre-CDM 39 projects Sust Forestry Mngt 8% Reforestation 24% Afforestation 3% Restoration 21% REDD 32% Agroforestry 12% CCBS 90 projects Wind 55% Hydro 16% Energy efficiency 10% Geothermal 2% Solar PV 3% Transport 1% Biogas 3% Biomass
energy 6% Fugitive 1% Landfill gas 2% Solar thermal 1% GS VER 93 projects Wind 54% Hydro 17% EE 10% Geoth 2% Solar PV 3% Transp 1% Biogas 3% Biomass 6% Fug 1% Landfill 2% Solar therm 1%
GS VER without pre-CDMs
90 projects Wind 33% Hydro 9% Energy efficiency 9% Solar PV 1% Biomass energy 15% Biogas 30% Dams for irriguation 1% Solar steam 1% GS CDM/ JI Landfill gas 1% 103 projects
Source: Mission Climat of Caisse des Dépôts.
10 The samples sometimes include projects that are no longer generating credits in 2008. This is the
case of pre-CDM projects which were registered in 2007.
Besides the preponderance of wind projects (55%), the GS VER also has significant shares of energy efficiency (10%), hydro projects (16%) and a wide variety of other project types. Despite having a scope of project types narrower than the other standards, the GS demonstrates a great capacity to attract innovative technologies such as biodiesel for transport from waste cooking oil recycling11, solar steam,
photovoltaic, efficient cook stoves and geothermal energy.
The CCB Standards distinguishes 6 types of forestry projects, with several projects using a combination of technologies. Reducing Emissions from Deforestation and Degradation (REDD) is the most common component, used in 32% of CCB Standards projects. According to the standard’s administrator, this dominance was triggered by the Bali COP/MOP in December 2007. Mounting interest in the possible role of REDD in a future climate regime seems to have dramatically stimulated the number of REDD applicants. As the feasibility of a direct link between REDD and compliance markets, in the form of tradable REDD credits, is being debated, the experience gathered by these standardised REDD projects developed on the voluntary market will provide highly valuable material to negotiators.
To date, no forestry project has yet been certified under the VCS AFOLU since AFOLU was only integrated into the VCS from the release of the VCS AFOLU Guidelines in late 2008. According to some market participants and standard administrators however, a significant number of projects are currently awaiting the standards to endorse methodologies so to seek the double certification CCB Standards-VCS AFOLU. This double certification is aimed to combine the rigorous carbon accounting and permanence rules of the VCS to the broader social and environmental dimension of the CCB Standards. Should this preliminary finding be confirmed by the upcoming VCS projects, it would be a genuine difference with the CDM which has so far been largely unable to attract forestry projects.
The CCX pattern is interesting: 65% of projects come from either agricultural soil carbon enhancements or from the forestry sector, two technologies largely ignored12
by the CDM and the VER+, and not covered by the Gold Standard. Unlike methane or other gas capture projects where direct measurement is required by the CCX, agricultural soil sequestration projects can generate CCX offset credits for the verified use of technologies or practices that are known to reduce emissions at rates that are scientifically proven and discounted for conservativeness. These projects also account for a large part of the CCX global offsets portfolio, with respectively 35% and 12% of the offsets and early action credits issued as of 09/07/200813. This may
therefore show the positive effect of the use of practice and performance-based methodologies on the development of agricultural soil sequestration projects (see section 2.3).
11 To date, no methodology for biodiesel from dedicated crops has been developed.
12 Debates over the additionality and sustainability of these projects are still on-going. 13 See the CCX Registry Offsets Report: http://www.chicagoclimatex.com/offsets/projectReport.jsf
2.5. Projects size: related to transaction costs?
Figure 4: Project size in ktCO2e/year emission reductions
0 50 100 150 200 250 300 350 CDM (3480) CCBS (32) VCS full (71) VCS strictly (18) VER+ full (31) VER+ strictly (8) GS VER full (91) GS VER strictly (88) GS CDM (102) CCX (10) ER s ( Kt /ye ar ) Median Mean
(number of projects in the sample)
Source: Mission Climat of Caisse des Dépôts.
In terms of project size, the CCB Standards clearly stands out with an average project size of 334 ktCO2e/year. This large average is due to a few projects with a large
REDD component. Some of them are forecasting emission reductions up to 3.4 MtCO2e/year. The median size, around 50 ktCO2e/year is more comparable to
other standards.
The CCX seems to attract more small-scaled projects with a median project size of only 20 kt CO2e/year, less than half the figure for CDM projects. The figure was 30kt
CO2e/year for the VCS. If one focuses on small-scale projects (defined here as
projects that generate less than 60 ktCO2e/yr)14, CCX and VCS “strictly” projects are
still smaller than CDM projects, though the difference is narrower. The median size of the first two gets down to 20 and 15 ktCO2e/year respectively, while the median
size of CDM small-scale projects is 26 ktCO2e/yr. Again, a possible explanation for
the CCX could be the difference in requirements that make some farm-scale projects profitable, a possibility totally unthinkable for CDM projects (see section 2). The VCS allows the development of performance-based methodologies to demonstrate additionality: the projects beating a given performance baseline, are considered to be additional. This could also greatly lower the critical size to ensure project profitability. However, no such methodology has so far been approved by the VCS board. The current figures are thus more likely explained by lower transaction costs.
14 The CDM definition of small scale, though often approximated to the less than 60 ktCO2e/year
definition, is more complicated: renewable energy projects with a maximum output capacity of 15 megawatts, energy efficiency improvement projects reducing energy consumption by up to the
equivalent of 60 gigawatt hours per year, and other project types emitting less than 60 ktCO2e/year
(decision 17/CP.7., paragraph 6(c), amended by 1/CMP.2, paragraph 28.) or less than 16 ktCO2e/year for forestry projects.
They could also simply be an artefact due to small sample sizes. The “strictly” VER+ projects have a higher average size (61 ktCO2e/year), very similar to that of the CDM.
Although the GS CDM and GS VER attract projects of various sizes, the average size of their projects is driven up by the predominance of large wind projects within its portfolio. This pattern in a “multiple-benefit carbon standard” is consistent with the findings of Dechezleprêtre et al. (2007) which show that large projects and those involving wind power are more likely to deliver co-benefits from technology transfer (knowledge and equipment).
2.6. The puzzling market for standards
Two studies15 provide some insights on credit prices for the different standards on the
OTC. As there have only been few tenders for voluntary carbon credits on market exchanges so far, both studies rely on interviews of market participants. As shown in Figure 5, they obtained very different results with wide price ranges. This is in part due to small sample sizes: for the standards we consider here, the estimates of Hamilton et al. (2008) are based on 21 data-points16 and those of Kollmuss et al.
(2008) rely on a single carbon trading and project facilitation business. Nevertheless, both studies show no conclusive price differentiation across standard in 2007. Though an update of the State of the Voluntary Carbon Markets (Hamilton’s study) indicates clearer price separation across standards by mid-2008, many other show the price other project characteristics, such as size, type and location are probably also important in determining the credit price that a given project can command. Moreover, the lack of transparency and access to information on prices as well as market fragmentation contributes to the heterogeneity of credit prices (Bellassen and Leguet, 2007).
Figure 5: Credits prices17 for the different standards on the OTC
0 5 10 15 20 25 30 Pri ce ( € /t C O 2 e) Minimum Maximum Best estimate GS VCS CDM VER+ CCX CCBS Sources: Hamilton 2008 Kollmuss 2008 This study
Sources: Hamilton 2008, Kolmuss 2008, Mission Climat of Caisse des Dépôts.
15 Hamilton et al. (2008) and Kollmuss et al. (2008).
16 Seven for the GS, six VCS, one VER+, seven CCX, and zero CCB Standards. Each data-point
corresponds to a survey response of one retailer indicating that more than 90% of its volume was verified by one particular standard.
17
We tried to refine explanations to the absence of price standardization through direct interviews with a dozen of worldwide voluntary carbon market players (9 offset retailers, 3 carbon asset managers). From these, we gathered two important elements on voluntary carbon credit prices.
The first key element pertains to the “maturity” of the OTC market, which varies considerably among countries. According to most market participants interviewed, the UK demonstrates the furthest “maturity”, meaning that customers have become more familiar with the voluntary carbon market and are now demanding that the credits they buy be certified. It now seems almost impossible to sell offsets that are not certified by one of the existing third party standards. Certification has therefore become indispensable for accessing the market. Offset retailers often participate in the choice of the standard, although the decision is ultimately made by the project developer. In most other European countries, offset buyers are less demanding, although recognition for standards is gaining ground. The Netherlands and the Scandinavian countries are regarded by professionals as places where this phenomenon is quickly occurring. Conversely, some of the market players interviewed reckon that the French, and to a lesser extent the German customers pay little attention to third party certification and concentrate on investing in charismatic projects rather than in dematerialised credits. In the US, the CCX has long been the only standard available for domestic projects which was the most appealing one to American customers (Bellassen and Leguet, 2007). However, this has changed over 2008: market participants increasingly show interest in projects abroad providing visible development benefits, and for domestic projects, other standards, such as the VCS and the CCAR18 (California Climate Action Registry) are gaining ground as
pre-compliance buyers bet on their validity in a future U.S. federal Cap & Trade. One key element to understanding the absence of price standardization in the OTC therefore lies in the different levels of market “maturity” from country-to-country. If most retailers declare that the global context pushes them to seek certification for their projects, the recognition standards get from buyers is nonetheless very variable among countries. This geographical differentiation (level of education) combined to the buyer segmentation (different types of buyers for different types of needs: flight offsetting for individuals, Corporate Social Responsibility or pre-compliance strategies for businesses) therefore affects the price premium that can be commanded by certification.
The second key element that does not appear in recent relevant studies is that despite the price heterogeneity, multiple-benefit standards manage to command price premiums. Co-benefits and the associated “luxury” mark are a likely explanation for this. Another much cited reason is the shortage in credit supply: to date, the CCB Standards has only certified 7 projects, and the Gold provides the market with very small supply (to date, there are 31 registered GS projects delivering
18 US projects meeting CCAR standards have been recognized by the VCS Association, and can
2.5 MtCO2e/year). Most of the professionals we interviewed said that a Gold
Standard credit is commonly worth 50% to 100% more than its CDM or voluntary equivalent (VCS or VER+) because the limited availability of these credits contrasts with a strong corporate demand. However, increasing supply of GS credits is expected and may impact prices significantly. As of April 2009, there were 159 projects publicly posted in the GS Registry as awaiting registration (listed or validated status) with 15 million high-quality CERs/VERs to deliver each year. In this context, the large supply of pre-CDM credits may soon struggle to find buyers.
3. Third party standards and transaction costs
Having a project certified by a third-party standard means respecting a certain number of criteria and proving this compliance through an external audit. Each criterion implies either additional fees or work at several steps of the project cycle. This section aims to provide a quantitative evaluation of these transaction costs, using an assessment tool designed for this purpose (see matrixes in appendix 1 and 2). It concludes by looking at the time necessary to certify a project along the different standards according to their respective requirements.
3.1. Material and methods
This tool draws up the list of the standards’ features along the project cycle, and links them to the subsequent costs incurred by the project developer.
In this section, we distinguish two types of costs:
o Direct fees, whose levels are fixed and established by the standards’ administrations or registries. Such fees can be demanded for project registration, credit issuance, and account opening or transactions.
o Structural costs occurring along the certification process, which are relative to the standards’ respective requirements and special provisions. In order to assess them and obtain reliable figures, we conducted direct interviews with a number of project participants, i.e. Designated Operational Entities (DOEs, independent auditors accredited by the CDM Executive Board), consultants, and offset project developers, with notable experience in project implementation and certification. These quantitative estimates are expressed in “man-day”, i.e. the work one person can produce in a day, which is a unit they commonly use to evaluate and charge services. The price of a man-day was set at 1,000€/man-day in our estimates of these structural costs, as it is representative of the price that can be charged by a consulting or an auditing firm. One must bear in mind however that this price is subject to variations depending on the pricing policy, experience and expertise of the firm. In the current context of DOE shortage, several interviewees reported a recent increase of auditing fees above 1,000 €/man-day. On the other hand, some of the structural costs (such as writing the Project Design Document) need not necessarily be externalised. When the project developer possesses the skills to have this work done by its own employees, the price of a man-day can be much lower than 1000€.
19
This methodology was deemed relevant by most of the professionals interviewed, some of them having developed a similar approach in their own project feasibility studies.
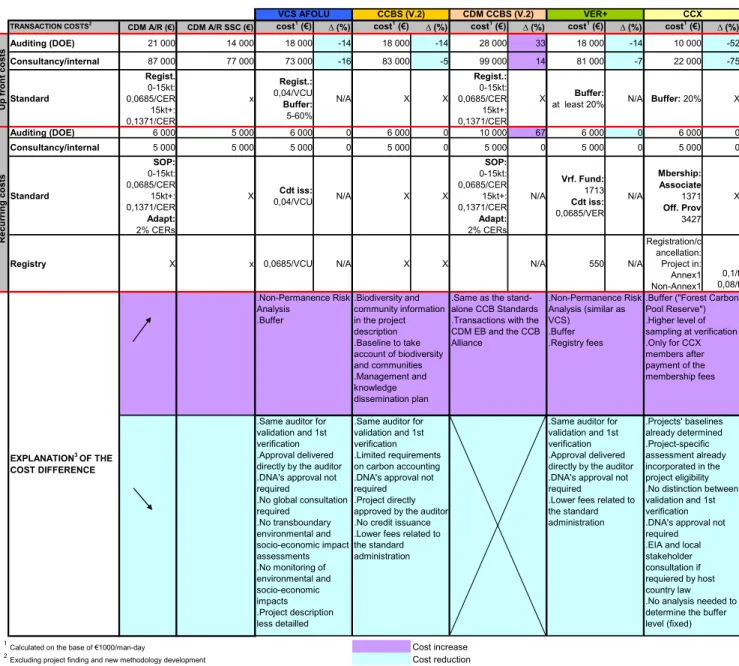
Nevertheless, they highlighted several limitations that must be taken into account: o Forestry and non-forestry projects cannot be compared on a same basis. There is moreover very little experience on forestry projects other than Reforestation and Afforestation. We therefore distinguish non-forestry and forestry offset projects, with a second matrix only focusing on Afforestation and Reforestation projects. However, as project development methodologies and guidelines now tend to be streamlined, our results may also be applicable for other project types within the LULUCF such as REDD.
o Experience shows that transaction costs are technology and scale dependant. While it makes sense to estimate the average difference in transaction costs between standards, the absolute results are not very meaningful. Our matrixes therefore take the CDM project as a benchmark and set values by default for a typical project. Drawing on these fixed figures, the professionals were able to provide relative estimates for the voluntary standards.
o Auditing costs or those charged by the standards and their registries, are different from those relative to project development and general management as they may not be out-sourced and remain internal. Some project developers indeed benefit from in-house expertise, work with NGOs familiar to the project area, or hire graduate students for the data collection which give rise to substantial savings.
3.2. Offset project cycle: the CDM benchmark
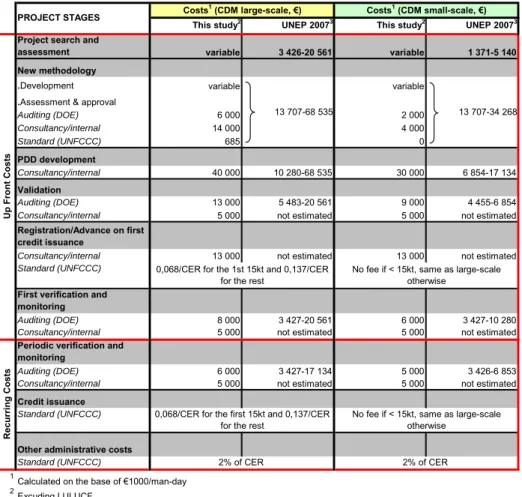
To date, the literature available on offset project transaction costs only looks at the CDM scheme (UNEP 2007, Ellis & Kamel 2007, Michelowa 2003, Ahonen & Hämekoski 2005, Chadwick 2006, Neeff et al. 2007). Table 2 provides a comparison of our results for CDM projects with the empirical estimates of UNEP 2007, the most comprehensive and most widely quoted study on the subject.
Our paper goes further in that it intends to estimate the internal or assistance costs along the project cycle due to the management of the project certification process. However, unlike UNEP 2007, we estimate neither the costs related to the initial project search and assessment, nor those related to the development of a new methodology. Initial project search and assessment was assumed to vary little between standards, and developing a new methodology remains a rare phenomenon in the voluntary market19.
19 Two methodologies have been specifically developed for the GS VER: improved cook‐stoves and small‐scale
biodigesters. No specific VCS methodology has been yet accepted by the VCS Board. As for LULUCF, the first methodologies are currently being developed for REDD projects under the VCS AFOLU guidelines, and the American Carbon Registry (Winrock Int.) released a Forest Carbon Project Standard in March 2009.
Table 2: CDM project transaction costs: our estimates vs. UNEP 2007
This study2 UNEP 20073 This study2 UNEP 20073
Project search and
assessment variable 3 426-20 561 variable 1 371-5 140 New methodology
.Development variable variable
.Assessment & approval
Auditing (DOE) 6 000 2 000 Consultancy/internal 14 000 4 000 Standard (UNFCCC) 685 0 PDD development Consultancy/internal 40 000 10 280-68 535 30 000 6 854-17 134 Validation Auditing (DOE) 13 000 5 483-20 561 9 000 4 455-6 854
Consultancy/internal 5 000 not estimated 5 000 not estimated
Registration/Advance on first credit issuance
Consultancy/internal 13 000 not estimated 13 000 not estimated
Standard (UNFCCC)
First verification and monitoring
Auditing (DOE) 8 000 3 427-20 561 6 000 3 427-10 280
Consultancy/internal 5 000 not estimated 5 000 not estimated
Periodic verification and monitoring
Auditing (DOE) 6 000 3 427-17 134 5 000 3 426-6 853
Consultancy/internal 5 000 not estimated 5 000 not estimated
Credit issuance
Standard (UNFCCC)
Other administrative costs
Standard (UNFCCC)
1
Calculated on the base of €1000/man-day
2
Excuding LULUCF
3UNEP (2007) Guidebook to Financing CDM projects
Costs1 (CDM small-scale, €)
Costs1 (CDM large-scale, €)
2% of CER
No fee if < 15kt, same as large-scale otherwise
No fee if < 15kt, same as large-scale otherwise 13 707-34 268 Up Front C o st s Recurri ng Costs 13 707-68 535
0,068/CER for the 1st 15kt and 0,137/CER for the rest
0,068/CER for the first 15kt and 0,137/CER for the rest
2% of CER
PROJECT STAGES
This table compares the results of the current study to those of UNEP 2007. We separate three types of costs, depending on who the proceeds go to: consultancy/internal costs which can be either internalized or paid to an external consultant, auditing costs which go to the auditor, standard costs (the fees paid to the standard) and registry costs (the fees paid to the standards’ registry holder)
Source: Mission Climat of Caisse des Dépôts.
Globally, our results are consistent with the costs estimated by UNEP 2007. Our estimates for small-scale projects are, however, higher than UNEP 2007, especially at the stages of PDD development and project validation. This could be due to the very recent project development costs increases that mentioned some of the market players we interviewed. This trend is mainly attributed to the DOEs whose work entails higher costs for the project developer. This is caused by the reinforced severity of the CDM EB (more time spent on the project) as well as higher honoraries (DOE shortage).
3.3. Transaction costs for certification: light on the differences
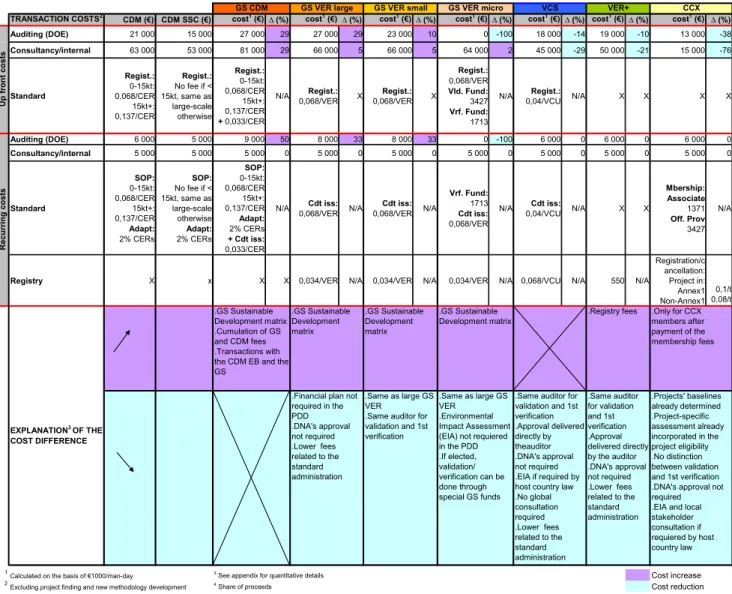
Reducing the transaction costs relative to the CDM has been the objective of several voluntary standards. The two matrixes in appendix 1 and 2 describe the standards’ features for non-forestry and forestry projects respectively, and assess to what extent they may impact costs along the project lifecycle. Tables 3 and 4 aggregate these
quantitative results, and highlight cost differences relative to the CDM (∆). The apparent precision must not be taken for granted and be rather regarded as estimates that roughly quantify these cost differences along the project cycle.
This assessment only looks at the project origination side and does not take account of expected carbon revenue that can vary from standard-to-standard. Premium credit prices can indeed make up for greater up-front costs.
Table 3: Comparison of transaction costs for VER and CDM non-forestry projects
Comparison of VER and CDM projects transaction costs1
TRANSACTION COSTS2 CDM (€) CDM SSC (€) cost1 (€) ∆ (%) cost1(€) ∆ (%) cost1(€) ∆ (%) cost1(€) ∆ (%) cost1 (€) ∆ (%) cost1 (€) ∆ (%) cost1(€) ∆ (%)
Auditing (DOE) 21 000 15 000 27 000 29 27 000 29 23 000 10 0 -100 18 000 -14 19 000 -10 13 000 -38 Consultancy/internal 63 000 53 000 81 000 29 66 000 5 66 000 5 64 000 2 45 000 -29 50 000 -21 15 000 -76 Standard Regist.: 0-15kt: 0,068/CER 15kt+: 0,137/CER Regist.: No fee if < 15kt, same as large-scale otherwise Regist.: 0-15kt: 0,068/CER 15kt+: 0,137/CER + 0,033/CER N/A Regist.: 0,068/VER X Regist.: 0,068/VER X Regist.: 0,068/VER Vld. Fund: 3427 Vrf. Fund: 1713 N/A Regist.: 0,04/VCU N/A X X X X Auditing (DOE) 6 000 5 000 9 000 50 8 000 33 8 000 33 0 -100 6 000 0 6 000 0 6 000 0 Consultancy/internal 5 000 5 000 5 000 0 5 000 0 5 000 0 5 000 0 5 000 0 5 000 0 5 000 0 Standard SOP: 0-15kt: 0,068/CER 15kt+: 0,137/CER Adapt: 2% CERs SOP: No fee if < 15kt, same as large-scale otherwise Adapt: 2% CERs SOP: 0-15kt: 0,068/CER 15kt+: 0,137/CER Adapt: 2% CERs + Cdt iss: 0,033/CER
N/A 0,068/VERCdt iss: N/A 0,068/VERCdt iss: N/A
Vrf. Fund: 1713 Cdt iss: 0,068/VER
N/A 0,04/VCUCdt iss: N/A X X
Mbership: Associate 1371 Off. Prov 3427 N/A
Registry X x X X 0,034/VER N/A 0,034/VER N/A 0,034/VER N/A 0,068/VCU N/A 550 N/A
Registration/c ancellation: Project in: Annex1 Non-Annex1 0,1/t 0,08/t
1Calculated on the basis of €1000/man-day 3 See appendix for quantitative details Cost increase
2Excluding project finding and new methodology development 4 Share of proceeds Cost reduction
VER+ CCX R ecurring cost s .Same as large GS VER .Environmental Impact Assessment (EIA) not requiered in the PDD .If elected, validation/ verification can be done through special GS funds .Registry fees GS CDM GS VER large GS VER small GS VER micro
.Same auditor for validation and 1st verification .Approval delivered directly by theauditor .DNA's approval not required .EIA if required by host country law .No global consultation required .Lower fees related to the standard administration .Same auditor for validation and 1st verification .Approval delivered directly by the auditor .DNA's approval not required .Lower fees related to the standard administration .Only for CCX members after payment of the membership fees .Projects' baselines already determined .Project-specific assessment already incorporated in the project eligibility .No distinction between validation and 1st verification .DNA's approval not required .EIA and local stakeholder consultation if requiered by host country law Up fron t co sts EXPLANATION3 OF THE COST DIFFERENCE VCS .GS Sustainable Development matrix .Cumulation of GS and CDM fees .Transactions with the CDM EB and the GS
.GS Sustainable Development matrix
.Financial plan not required in the PDD .DNA's approval not required .Lower fees related to the standard administration .GS Sustainable Development matrix .GS Sustainable Development matrix .Same as large GS VER
.Same auditor for validation and 1st verification
Source: Mission Climat of Caisse des Dépôts.
3.3.1. No host country’s approval required
Unlike the CDM, voluntary standards do not require the approval of the host’s country’s Designated National Authority (DNA) to implement an offset project20.
20 The DNA approves hosted CDM projects and sets guidelines for project implementation. The
approval of CDM projects is made official in a Letter of Approvals confirming the project’s contribution to sustainable development in the host country.
Project developers interviewed say this process requires 7 to 8 man-days at the stage of PDD development, though according to some others it is sometimes even more as DNAs now get increasingly involved in the process. In some cases, DNA involvement may also decrease transaction costs through helpful guidelines and framework. This seems to be the case for small-scale hydro projects in China and small-scale wind projects in India (Elabed & Leguet 2008).
3.3.2. Same auditor for validation and verification
Another simplification common to the schemes of a number of standards, i.e. CDM SSC, small GS VER, VCS, and VER+, is to allow a project to hire the same auditor for conducting both validation and verification. We estimate this leads to about 25% reduction of the auditing costs (2 man days) for the 1st verification as the auditor is already familiar with the project and does not need as much time to understand its details. Besides lowering transaction costs, some auditors reckon this provision is important in the case of the VCS, and VER+, as these two standards rely solely on auditors to approve projects: a project validated by the auditors is automatically approved, whereas in the case of the CDM, the Executive Board checks the work of auditors (DOEs). In the absence of this check, some auditors are reluctant to verify a project whose validation has been conducted by another auditor, as they have no control on the quality of the work that has been done at the validation stage.
3.3.3. An Environmental Impact Assessment is not required but is almost always undertaken
An environmental impact assessment (EIA) identifies and evaluates the environmental impacts (other than carbon) of a project, and proposes mitigation measures when relevant. We estimate that this entails about 5 man-days in terms of resources. The GS VER Micro, VCS, CCX, and VER+ only require an EIA to be conducted if prescribed by the relevant local or national law. However, given that many countries have now developed EIA regulations and the large number of pre-CDM projects in the voluntary market, EIA are almost systematically undertaken.
3.3.4. Micro GS projects benefit from special validation and verification funds
Some measures specific to certain standards can also yield cost savings. The GS exempts eligible micro-scaled projects (< 5 ktCO2e/year) from validation and
verification. Instead, these projects contribute to two dedicated funds, the validation and verification funds, which are used by the GS Foundation to pay for random validation and verification of the micro-scaled projects it has certified.
3.3.5. Practice-based and performance based methodologies for the CCX and VCS
For project developers using a standardized methodology of the CCX, the CCX does not require a validation stage in advance of verification (called “project verification and enrolment”). This is because the CCX performs the validation in developing the
23
methodology and project developers must then abide by it. We estimate this reduces auditing up-front costs by about 40% compared to the CDM scheme. Furthermore, baseline determination, additionality demonstration, and monitoring are often simplified in CCX methodologies: these methodologies define an uncommon practice (e.g. no-till farming), and determine the average reductions achieved when the practice is implemented. The only monitoring consists in checking that the practice has been indeed put in place. We estimate this kind of benchmarking allows further reduction in up-front costs of about 50% for the PDD developed for the CCX, when compared to those developed for the CDM. The VCS allows performance-based methodologies, that is methodologies which consider all reductions under a sectoral performance benchmark to be additional. These could lead to costs savings similar to CCX methodologies. To date, however, no such methodology has been approved by the VCS board.
3.3.6. Ensuring co-benefits for the GS
As a multiple-benefit carbon standard, the GS has implemented special provisions to go further than the CDM in ensuring the sustainable development component of offset projects. These include the GS Sustainable Development Matrix and monitoring plan, as well as tougher requirements on the organisation and reporting of the local stakeholder consultation. Compared to the CDM, these provisions of the GS VER entail more work along the project lifecycle with associated cost increases of about 20% for PDD development, 30% for auditing at validation and first verification, and 33% for following verifications,.
The new GS version (GSV2)21 includes rule changes but mainly intends to give
project participants further guidance along the certification process. However, some project developers believe that the GSV2 could increase the certification costs up to a 10% as it appears more stringent on reporting.
The fees charged by standards administrators and registries for project registration, credit issuance or account opening also vary from standard to standard22. Tables 4
and 5 summarize this information and compare the transaction costs associated with the different standards. In order to account for the costs that depend on project size and verification schedule, we take two examples. Table 4 presents the transaction costs for a “typical voluntary project”: emissions reductions of 50 ktCO2e/year,
verified every year during the first seven years. Table 5 is based on a smaller project with emissions reductions of 5 ktCO2e/year, verified every two years over seven
years.
21 GSV2, applicable from August 2008
22 The VCS association appointed 4 organizations to run its registries. As they are not yet
operational, their pricing policies are still unavailable. However, the VCS wishes account fees to be affordable for small project developers. Market players therefore anticipate the registries to set their fee proportionally to the number of credits registered rather than to charge a fixed account fee. In our calculations, we assume a charge of €0.10/VCU for project registration into VCS registries.
Table 4: Transaction costs (in €/VER) for a non-forestry large scale project* (50 ktCO2e/year, verified every year during 7 years)
CDM** GS CDM** GS VER VCS VER+ CCX*** Total certification:
validation, verification, registration
and registry fees 0,58 0,68 0,32 0,26 0,17 0,23
Total incl. Consultancy/internal: PDD development and management
of certification 0,85 1,00 0,59 0,48 0,40 0,36
*located in a non-annex I c ountry (CCX offset registration fees differ depending on where the project is loc ated)
**to include the 2% share of CERs iss ued to projects for the UN adaptation fund, we assume that CERs trade at 15€. This adds €15 000/year of forgone carbon revenues to the transaction costs of this project.
*** Given that we listed the "offset providers" as "associate members" among CCX offset retailers, we use the average membership fee. This fixed transaction cost is diluted over the projects of the retailer. To account for this dilution, we divide it by the average number of projects per retailer (4,5).
Source: Mission Climat of Caisse des Dépôts.
For a large scale project, one can see the impact of the different provisions discussed earlier on the global certification costs. Again, it is more meaningful to concentrate on the difference between standards rather than on the absolute value of the estimate. Roughly compared to the other basic carbon standards, the VER+ benefits from the absence of registration fees as well as a fixed registry fee only consisting of an account opening charge of €550. Conversely, the GS CDM appears to be the most costly certification scheme as it accumulates the work and fees imputable to both CDM and GS VER. Eventually, transaction costs are shown to differ significantly between standards: both external and overall costs are more than halved in the cases of the CCX and VER+ when compared to the CDM or GS CDM. This difference mainly comes from the 2% levy that feeds the adaptation fund (0.3 €/VER). Nevertheless, the price premium that the CDM or the GS can command compared to the other standards (see part 2) is a lot higher than these differences. When possible, it is therefore more profitable for large-scale projects to seek CDM or GS certification.
Table 5: Transaction costs (in €/VER) for a non-forestry small scale project* (5 ktCO2e/year, verified at years 1, 3, 5, and 7)
CDM SSC** GS VER Micro VCS VER+ CCX*** Total certification:
validation, verifications, registration
and registry fees 1,16 0,35 0,94 0,94 1,07
Total incl. Consultancy/internal: PDD development and management
of certification 3,10 2,60 2,37 2,51 1,93
*located in a non-annex I country (CCX offset registration fees differ depending on where is localised the project)
**to include the 2% share of CERs issued to projects for the UN adaptation fund, we assume that CERs trade at 15€. This adds €15 000/year of forgone carbon revenues to the transaction costs of this project.
***As we listed as many "offset providers" as "associate members" among CCX offset retailers, we use the average membership fee. This fixed transaction cost is diluted over the projects of the retailer. To account for this dilution, we divide it by the average number of projects per retailer (4,5).