HAL Id: hal-00303950
https://hal.archives-ouvertes.fr/hal-00303950
Submitted on 9 Aug 2006HAL is a multi-disciplinary open access
archive for the deposit and dissemination of sci-entific research documents, whether they are pub-lished or not. The documents may come from teaching and research institutions in France or abroad, or from public or private research centers.
L’archive ouverte pluridisciplinaire HAL, est destinée au dépôt et à la diffusion de documents scientifiques de niveau recherche, publiés ou non, émanant des établissements d’enseignement et de recherche français ou étrangers, des laboratoires publics ou privés.
Mid-winter lower stratosphere temperatures in the
Antarctic vortex: comparison between observations and
ECMWF operational model.
M. C. Parrondo, M. Yela, M. Gil, P. von der Gathen, H. Ochoa
To cite this version:
M. C. Parrondo, M. Yela, M. Gil, P. von der Gathen, H. Ochoa. Mid-winter lower stratosphere temperatures in the Antarctic vortex: comparison between observations and ECMWF operational model.. Atmospheric Chemistry and Physics Discussions, European Geosciences Union, 2006, 6 (4), pp.7697-7714. �hal-00303950�
ACPD
6, 7697–7714, 2006
Stratospheric temperature over the
Antarctic region M. C. Parrondo et al. Title Page Abstract Introduction Conclusions References Tables Figures J I J I Back Close
Full Screen / Esc
Printer-friendly Version Interactive Discussion
EGU Atmos. Chem. Phys. Discuss., 6, 7697–7714, 2006
www.atmos-chem-phys-discuss.net/6/7697/2006/ © Author(s) 2006. This work is licensed
under a Creative Commons License.
Atmospheric Chemistry and Physics Discussions
Mid-winter lower stratosphere
temperatures in the Antarctic vortex:
comparison between observations and
ECMWF operational model.
M. C. Parrondo1, M. Yela1, M. Gil1, P. von der Gathen2, and H. Ochoa3 1
Instituto Nacional de T ´ecnica Aeroespacial, Torrej ´on de Ardoz, Spain
2
Alfred Wegener Institute for Polar and Marine Research, Research Unit Potsdam, Germany
3
Direcci ´on Nacional de Ant ´artico, Buenos Aires, Argentina
Received: 18 April 2006 – Accepted: 19 June 2006 – Published: 9 August 2006 Correspondence to: M. C. Parrondo ([email protected])
ACPD
6, 7697–7714, 2006
Stratospheric temperature over the
Antarctic region M. C. Parrondo et al. Title Page Abstract Introduction Conclusions References Tables Figures J I J I Back Close
Full Screen / Esc
Printer-friendly Version Interactive Discussion
EGU Abstract
Radiosonde temperature profiles from Belgrano (78◦S) and other Antarctic stations have been compared with European Centre for Medium-Range Weather Forecasts (ECMWF) data during the winter of 2003. Results show a bias in the operational model which is height and temperature dependent, being too cold at layers peaking at 80 and 5
25–30 hPa, and hence resulting in an overestimation of the predicted potential PSC areas. Here we show the results of the comparison by considering the possibility of a bias in the sondes at extremely low temperatures and discuss the potential implications that this bias might have on the ozone depletion computed by Climate Transport Model based on ECMWF temperature fields.
10
1 Introduction
The study of processes in the lower stratosphere related to the depletion of ozone in polar regions such as polar stratospheric cloud (PSC) formation, chemical reaction rates or air mass trajectory calculations rely on winds and temperatures obtained from analysis and forecasts of operational meteorological models. Those models are fed in 15
almost real time by atmospheric data of very diverse origin. In particular, temperatures in the lower stratosphere are based mainly on radiosonde and satellite data, the latter being of large importance in Antarctica, where radiosonde stations are scarce.
Trends in stratospheric temperatures have become a subject of increasing interest as they might impact the ozone concentration, although a large degree of uncertainty 20
remains. From climate model runs some authors find a delay in the time of the expected ozone recovery as a consequence of increased radiative cooling by greenhouse gases (Shindell et al., 1998). Others expect a faster recovery as the O3 column increases by reducing the rate of gas-phase loss processes (Chipperfield and Feng, 2003). For this reason, in recent years much effort has been devoted to quantifying the accuracy 25
ACPD
6, 7697–7714, 2006
Stratospheric temperature over the
Antarctic region M. C. Parrondo et al. Title Page Abstract Introduction Conclusions References Tables Figures J I J I Back Close
Full Screen / Esc
Printer-friendly Version Interactive Discussion
EGU substantial differences between them.
Moreover, the biases between analyses vary from year to year. A direct compar-ison between the radiosonde network in the Arctic and the ECMWF for the period 1996–2003 (Knudsen 2003) shows good agreement in some years (i.e. 1996/1997 and 1999/2000) while in others a clear bias is found.
5
Assessment of trends in a consistent manner based on all available datasets of stratospheric temperatures was performed by Ramaswamy et al. (2001) showing a significant negative trend of more than –1◦K/decade over Antarctica from the NOAA Geophysical Fluid Dynamics Laboratory (GFDL) database (Oort and Liu, 1993), the only available temperature information for the region based on “in situ” measurements. 10
In contrast to the Arctic, where a large set of stations perform routine radiosoundings, fewer than 16 radiosonde stations in Antarctica report daily to ECMWF. As a conse-quence forecasts rely basically on satellite radiances from AMSU-A.
During the Quantitative Understanding of Ozone losses by Bipolar Investigations (QUOBI) Antarctic 2003 campaign (http://www.nilu.no/quobi/), ECMWF forward trajec-15
tories were required to estimate the ozone losses based on the well- established La-grangian approach developed for the Arctic, known as the Match technique (von der Gathen et al., 1995; Rex et al., 1997; Streibel et al., 2005). For that purpose 9 Antarc-tic ozone sounding stations coordinated and extended the number of launchings. An additional effort was done to increase the number of radiosondes launched from the 20
stations to one per day during the winter-spring season in order to feed the ECMWF model.
The dataset produced within QUOBI over Belgrano station has been used here to carry out a comparison with data provided by the ECMWF and NCEP models. Di ffer-ences found between them at very low temperatures are analysed by accounting for 25
ACPD
6, 7697–7714, 2006
Stratospheric temperature over the
Antarctic region M. C. Parrondo et al. Title Page Abstract Introduction Conclusions References Tables Figures J I J I Back Close
Full Screen / Esc
Printer-friendly Version Interactive Discussion
EGU
2 Data
Daily Vaisala RS80 radiosondes flown on Totex TX500 balloons were launched dur-ing the winter 2003, extenddur-ing from 14 June to 12 October. Balloons were dip-oil treated to reduce low level burst due to loss of elasticity under very cold conditions. A Vaisala Digicora-MW15 receiver system collected and processed the signal. A total of 5
88 soundings contributed to the comparison up to the 550 K level, decreasing to 50 at 650 K due to premature balloon bursts in dark and cold conditions.
The sensor lag is 20 s at 10 hPa (V ¨ais ¨al ¨a, 1963), less than 100 m in height. RS80 temperature accuracy is 0.2◦C up to 50 hPa and 0.3◦ between 50 and 15 hPa (WMO, 1987; WMO, 1991). Radiosondes were launched at local noon following the rec-10
ommendations of WMO (1996). ECMWF temperature data have been extracted from the output at 12:00 UTC of the 60-level TL511 model at a spatial resolution of 1.125◦×1.125◦ in a Cycle 25r4 run (ECMWF, 2005). Radiosonde data were extracted to the levels of the ECMWF analysis output. Differences between them are never larger than 0.1 hPa. (mean=0.034±0.032 hPa)
15
The NCEP/NCAR temperature data have been extracted from the reanalysis project which uses a global numerical weather analysis/forecast system to perform data as-similation using historical observations (Kistler et al., 2001). The model has 28 verti-cal pressure levels extending from the surface to ∼40 km with a spatial resolution of 2.5◦×2.5◦.
20
Areas of potential PSC-I (NAT) and PSC-II (ICE) presence have been calculated from ECMWF temperature fields based on threshold temperatures computed from com-monly assumed values of 5 ppmv H2O and 9–10 ppbv HNO3 (M ¨uller et al., 2001).
3 Meteorology
Belgrano (78◦S, 34◦W) is representative of an in-vortex station during the winter-spring 25
to-ACPD
6, 7697–7714, 2006
Stratospheric temperature over the
Antarctic region M. C. Parrondo et al. Title Page Abstract Introduction Conclusions References Tables Figures J I J I Back Close
Full Screen / Esc
Printer-friendly Version Interactive Discussion
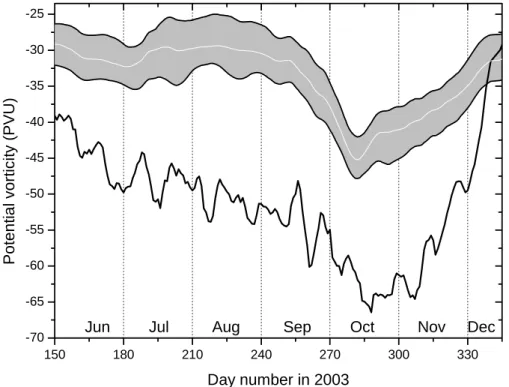
EGU gether with the edge of the Antarctic vortex at the 475 K level, as representative of the
height where the chemical depletion takes place. The edge is defined for each day by the Nash criteria (Nash et al., 1996) as the belt comprised of the singular points of the second derivative of PV in equivalent latitudes (shaded lines) rather than a physically unrealistic PV isopleth. This procedure provides information on the position of the sta-5
tion relative to the edge of the vortex. The Belgrano PV has been smoothed by a 5 day running mean to avoid spatial PV inhomogeneities. In 2003 the station was located well inside the vortex during the whole season until the vortex dilution.
4 Results
Differences in temperature between observations and ECMWF analysis 10
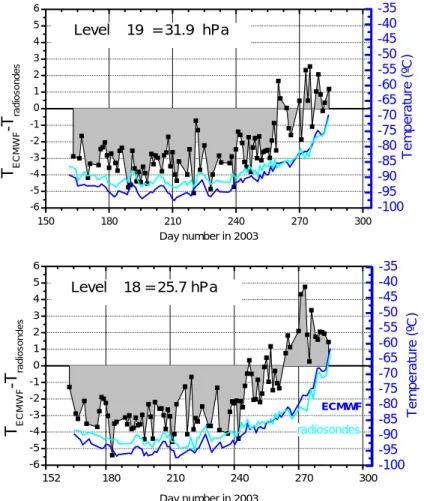
(DT=T(ECMWF)–T(Sonde) in the following text) in the lower stratosphere show a systematic bias, with its magnitude dependent on the level considered. The maximum discrepancy occurs in the layer 30–25 hPa where stratospheric temperature reaches its lowest values, being below −90◦ during July and August (Fig. 2). The difference is reduced as the temperature increases in September, suggesting a 15
correlation between DT and stratospheric temperature for low values below −85◦ but not at higher ones.
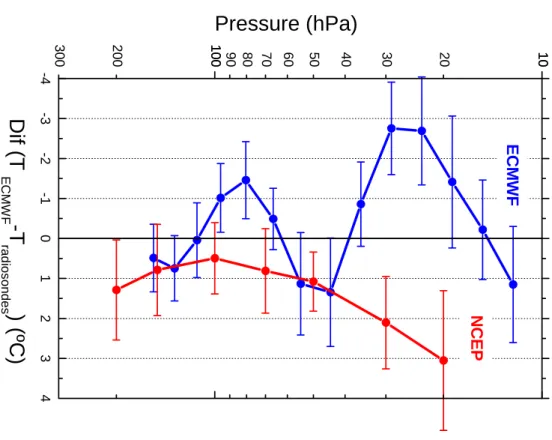
A more detailed analysis, taking into account all ECMWF levels in the radiosonde range, displays a bimodal structure of DT (Fig. 3). In two ranges centred at 375 K (80 hPa) and 510 K (30 hPa) ECMWF underestimates the temperature while a layer in 20
between, around 450 K (50 hPa), there is a slightl overestimate. This behaviour is not visible in the NCEP model. Only at 30 hPa or above does NCEP depart positively by 2◦C or more, while below the differences remain below 1◦C.
To prove that the observed behaviour is a general feature and not locally induced or resulting from instrumental failure, the same exercise was performed for the 180 25
available profiles participating in the Antarctic QUOBI-Match campaign. The results display the same bimodal vertical structure with almost identical magnitude.
ACPD
6, 7697–7714, 2006
Stratospheric temperature over the
Antarctic region M. C. Parrondo et al. Title Page Abstract Introduction Conclusions References Tables Figures J I J I Back Close
Full Screen / Esc
Printer-friendly Version Interactive Discussion
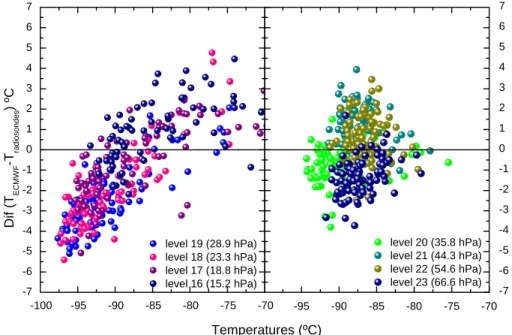
EGU The temperature-dependent bias is not constant with height. It takes place at the
ECMWF levels 16–19 (approx. 15.2–28.9 hPa) but not at the 20–23 levels (35.8– 66.6 hPa) (Fig. 4). The discrepancy appears at the temperature of ice PSC-II formation and below, resulting in a model overestimate of the available surface area for hetero-geneous reactions with potential implications for the amount of the overall depletion 5
computed by the models for Antarctica.
5 Discussion
The fact that the height-structured discrepancy is not observed in NCEP data suggest a problem related to changes in ECMWF Cycle 25r4 run or previous one. Bi-modal structures in delta of O3-profiles are usually associated to a shift in the height register 10
of satellite data but it is difficult to attribute to an effect of this nature in the Antarctic winter temperatures since there is not a change in the sign of the vertical gradient at the altitudes where the discrepancy appears.
As mentioned in a previous section, RS80 radiosondes accuracy lies in the 0.2–0.3◦C range. The sensor is a THERMOCAP capacitive bead encapsulated in glass, with wa-15
ter repellent treatment and metalised to minimise radiation sensitivity. The radiosonde is calibrated prior to the flight and the offset, if any, corrected in the evaluation analysis. The mean value of the offset corrections in the studied dataset is −0.2◦C with a stan-dard deviation of 0.3◦C. Calibration of the radiosondes is based on 4 points, being the lowest one at −80◦C.
20
Although no significant departure from the calibration curve is expected for the ca-pacitive beads at lower temperatures, we have calibrated a standard RS80 down to −105◦C to cover the range of temperatures encountered in the Antarctic stratosphere. For that purpose the SUN System 500 environmental chamber facility at INTA has been used. The sonde was located inside the chamber and operated in nominal mode. 25
Temperature inside the chamber was cooled down in 5oC steps until complete stabi-lization. Five platinum thermo-resistence PT100 (DIN 43760) traceable to the National
ACPD
6, 7697–7714, 2006
Stratospheric temperature over the
Antarctic region M. C. Parrondo et al. Title Page Abstract Introduction Conclusions References Tables Figures J I J I Back Close
Full Screen / Esc
Printer-friendly Version Interactive Discussion
EGU Standards maintained at CEM (Centro Espa ˜nol de Metrolog´ıa) were used for control.
Results show a positive departure from the reference as the chamber was cooled down to temperatures below −90◦C (Fig. 5). However, the bias was of only 0.5◦C at −100◦C unable to explain the larger 3◦C difference between sondes and ECMWF model.
5
As a consequence, the majority of the observed differences must be attributed to a bias in the ECMWF temperature profiles. Based on this, calculations of areas where PSC formation is possible, yield too large areas, displaying a two layer structure par-ticularly well defined in the PSC-II case and persistent with time. In Fig. 6 (top panels) PSC-I and PSC-II probability areas are displayed. After recalculating the areas using 10
the correction of temperatures based on radiosonde data as shown in Fig. 4, the ar-eas of possible PSC are reduced (Fig. 6, lower panels). PSC-I show small but non negligible effects at the 550 K level. The small change after the correction is not sur-prising since even after increasing 3–4◦C the stratospheric temperatures remain below the PSC-I threshold. On the other hand, the PSC-II area probability is significantly 15
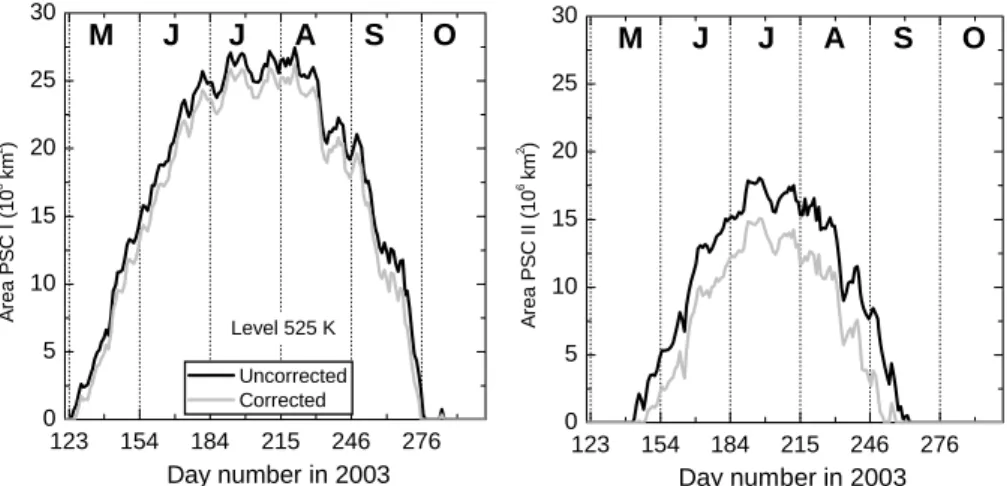
reduced at the 500–550 K level and the two-layer structure almost vanishes. Most sig-nificant effect is a shift in altitude on where the largest area of PSC occurs from the rather unrealistic 500–600 K to the 400–450 K layer, in agreement with the ozone de-pletion observation heights. At the isentropic level of 525 K the difference between uncorrected and corrected areas represents approximately 8% less PSC-I and 29% 20
less PSC-II of the integrated area for the season (Fig. 7).
The ECMWF negative bias for the high latitudes northern hemisphere winter 2002– 2003 has been previously reported by Knudsen (2003) by using the radiosonde net-work from 50◦–90◦N and 140◦W–140◦E based mostly on Vaisala RS80. The same result is found in the more accurate RS90 radiosonde launched occasionally at several 25
European and Greenland stations. Although no definite explanation is offered, Knud-sen (2003) speculates on the possibility that the assimilation of low-vertical-resolution satellite data, in which upper stratosphere bias is present, can cause changes in the lower stratosphere. Dethof (2003), when comparing MIPAS to ECMWF for
November-ACPD
6, 7697–7714, 2006
Stratospheric temperature over the
Antarctic region M. C. Parrondo et al. Title Page Abstract Introduction Conclusions References Tables Figures J I J I Back Close
Full Screen / Esc
Printer-friendly Version Interactive Discussion
EGU December 2002, also finds a negative bias over much of the stratosphere that has
been observed with the radiosonde network as well. More recently, Gobiet et al. (2005) find a vertical wave-like structure bias over the Antarctic latitudes more pronounced in the winter months. These authors suggest a contribution in the bias to the AMSU-A radiances assimilation since the wavy pattern correlates with the maxima of the tem-5
perature weighting functions for channels 10 to 12. The same finding is reported by the ERA-40 reanalysis team for the final years of the data series when the SSU and AMSU-A data were assimilated (Uppala et al., 2005).
The reported results might have implication on the accuracy of calculation of the ozone losses during the ozone hole period in CTM models that make use of ECMWF 10
temperatures. The deviations peaks at the two critical isentropic levels of 375 K and 510 K, just outside of the limits of the complete ozone depletion layer. Rex et al. (2004) have shown a strong correlation between the vertically integrated ozone losses and the volume of air in which temperatures are below the NAT equilibrium point for the Arc-tic. Moreover, Knudsen et al. (2004) found a remarkable correlation between the total 15
ozone mass depleted in the vortex and PSCs area probability in the Arctic (correlation coefficient = 0.96) which can be extended to the Antarctica. As a consequence, small changes of few degrees in the temperature might have non negligible impact on the computation of the depletion in the ozone column, in particular at those levels where the depletion is not complete.
20
6 Summary
Temperatures from radiosondes launched at Belgrano and other Antarctic stations in support of the QUOBI campaign have been compared with the ECMWF and NCEP operational models for the Antarctic winter 2003. Results show a bias in ECMWF fields which is height-dependent. The departures appear at temperatures below −85◦C 25
and display two negative layers peaking at 80 hPa and 30–25 hPa with a positive layer between them centred at 50 hPA. A calibration of the Vaisala THERMOCAP sensor
ACPD
6, 7697–7714, 2006
Stratospheric temperature over the
Antarctic region M. C. Parrondo et al. Title Page Abstract Introduction Conclusions References Tables Figures J I J I Back Close
Full Screen / Esc
Printer-friendly Version Interactive Discussion
EGU to temperatures down to −105◦ C shows that the sensor behaves well up to −100◦C,
below the limits of the recorded observational data. Calculations of areas where PSC formation are possible based on the ECMWF model result in an overestimate of the potential PSC presence and hence the surface available for heterogeneous reactions to proceed. This effect is particularly significant at the critical isentropic levels of 375 5
and 510 K where ozone is not completely depleted. Small changes of few degrees in the temperature might have non-negligible impact on the computation of the depletion in the integrated ozone column. At the level of 525 K the overestimate for the whole season is 8% for PSC-I and 29% for PSC-II.
Acknowledgements. The authors are grateful to the operating staff of the Antarctic stations.
10
This work has been funded by the Spanish National Plan for Research and Development through MARACA Project (CGL2004-05419-C02-01/ANT) and by the EU 5th framework Pro-gramme QUOBI project (EVK2-2001-00129).
References
Chipperfield, M. and Feng, W.: Comment on: Stratospheric Ozone Depletion at northern
mid-15
latitudes in the 21st century: The importance of future concentrations of greenhouse gases nitrous oxide and methane, Geophys. Res. Lett., 30(7), 1389, doi:10.1029/2002GL016353, 2003.
Dethof, A.: Monitoring of near-real-time SCIAMACHY, MIPAS and GOMOS data at ECMWF, ENVISAT Validation Workshop, ESA-SP531, 2003.
20
ECMWF:http://www.ecmwf.int/product/data/operationaSystem/evolution, 2005.
Gobiet, A., Foelsche, U., Steiner, A. K., Borsche, M., Kirchengast G., and Wickert, J.: Climato-logical validation of stratospheric temperatures in ECMWF operational analyses with CHAMP radio occultation data, Geophys. Res. Lett., 32, L12806, doi:10.1029/2005GRL0202617, 2005.
25
Kistler, R., Kalnay, E., Collins, W., Saha, S., White, G., Woollen, J., Chelliah, M., Ebisuzaki, W., Kanamitsu, M., Kousky, V., van den Dool, H., Jenne, R., and Fiorino, M.: The NCEP-NCAR 50-Year Reanalysis: Monthly Means CD-ROM and Documentation, Bull. Am. Meteorol. Soc., 82, 247–268, 2001.
ACPD
6, 7697–7714, 2006
Stratospheric temperature over the
Antarctic region M. C. Parrondo et al. Title Page Abstract Introduction Conclusions References Tables Figures J I J I Back Close
Full Screen / Esc
Printer-friendly Version Interactive Discussion
EGU
Knudsen, B. M.: On the accuracy of analysed low temperatures in the stratosphere, Atmos. Chem. Phys., 3, 1759–1768, 2003.
Knudsen, B. M., Andersen, S. B., Christiansen, B., Larsen, N., Rex, M., Harris, N. R. P., and Naujokat, B.: Extrapoling future Arctic ozone losses, Atmos. Chem. Phys. 4, 1849–1856, 2004.
5
Manney, G., Sabutis, J., Pawson, S., Santee, M., Naujokat, B., Swinbank, R., Gelman, M., and Ebisuzaki, W.: Lower stratospheric temperature differences between meteorological analy-ses in two cold Arctic winters and their impact on polar processing studies, J. Geophys. Res., 108, 8328, doi:10.1029/2001JD001149, 2003.
M ¨uller, M., Neuber, R., Beyerle, G., Kyro, E., Kivi, R., and Woste L.: Non-uniform PSC
occur-10
rence within the Arctic polar vortex, Geophys. Res. Lett., 28, 4175–7178, 2001.
Nash, E., Newman, P., Rosenfield J., and Schoeberl, M.: An objective determination of the polar vortex using Ertel’s potential vorticity, J. Geophys. Res., 101, 9471–9478, 1996. Oort, A. H. and Liu, H.: Upper-air temperature trends over the globe, 1956–1989, J. Climate,
6, 292–307, 1993.
15
Ramaswamy, V., Chanin, M.-L., Angell, J., Barnett, J., Seidel, D., Gelman, M., Keckhut, P., Koshlekov, Y., Labitzke, K., Lin, J-J., O’Neill, A., Nash, J., Randel, W., Rood, R., Shine, K., Shiotani, M., and Swinbank, R.: Stratospheric temperature trends: Observations and model simulations, Rev. Geophys., 39, 71–122, 2001.
Rex, M., Harris, N. R. P., von der Gathen, P., Lehmann, R., Braathen, G. O., Reimer, E.,
20
Beck, Chipperfield, M. P., Alfier, R., Allaart, M., O’Connor, F., Dier, H., Dorokhov, V., Fast, H., Gil, M., Kyro, E., Litynska, Z., Mikkelsen, I. S., Molyneux, M. G., Nakane, H., Notholt, J., Rummukainen, M., Vlatte P., and Wenger J.: Prolonged stratospheric ozone loss in the 1995/96 Arctic winter, Nature, 389, 835–838, 1997.
Rex, M., Salawitch, R. J., von der Gathen, P., Harris, N. R. P., Chipperfield M. P., and
Nau-25
jokat, B.: Arctic ozone loss and climate change, Geophys. Res. Lett., 31, L04116, doi: 10.1029/2003GL018844, 2004.
Shindell, D. T., Rind, D., and Lonergan, P: Increased polar stratospheric ozone losses and delayed eventual recovery owing to increasing greenhouse-gas concentration, Nature, 392, 589–592, 1998.
30
Streibel, M., Rex, M., von der Gathen, P., Lehmann, R., Harris, N. R. P., Braathen, G. O., Reimer, E., Deckelmann, H., Chipperfield, M., Millard, G., Allaart, M., Andersen, S. B., Claude, H., Davies, J., De Backer, H., Dier, H., Dorokov, V., Fast, H., Gerding, M., Kyr ¨o,
ACPD
6, 7697–7714, 2006
Stratospheric temperature over the
Antarctic region M. C. Parrondo et al. Title Page Abstract Introduction Conclusions References Tables Figures J I J I Back Close
Full Screen / Esc
Printer-friendly Version Interactive Discussion
EGU
E., Litynska, Z., Moore, D., Moran, E., Nagai, T., Nakane, H., Parrondo, C., Skrivankova, P., St ¨ubi, R., Vaughan, G., Viatte, P., Yushkov, V.: Chemical ozone loss in the Arctic winter 2002/2003 determined with Match, Atmos. Chem. Phys. Disc., 5, 4311–4333, 2005
Uppala, S. M., K ˚allberg, P. W., Simmons, A. J., Andrae, U., da Costa Bechtold, V., Fiorino, M., Gibson, J. K., Haseler, J., Hernandez, A., Kelly, G.A., Li, X., Onogi, K., Saarinen, S., Sokka,
5
N., Allan, R. P., Andersson, E., Arpe, K., Balmaseda, M. A., Beljaars, A. C. M., van de Berg, L., Bidlot, J., Bormann, N., Caires, S., Chevallier, F., Dethof, A., Dragosavac, M., Fisher, M., Fuentes, M., Hagemann, S., H ´olm, E., Hoskins, B. J., Isaksen, L., Janssen, P. A. E. M., Jenne, R., McNally, A.P., Mahfouf, J.-F., Morcrette, J.-J., Rayner, N.A., Saunders, R. W., Si-mon, P., Sterl, A., Trenberth, K. E., Untch, A., Vasiljevic, D., Viterbo, P., and Woollen, J.: The
10
ERA-40 re-analysis. Quart. J. R. Meteorol. Soc., 131, 2961–3012, doi:10.1256/qj.04.176, 2005.
V ¨ais ¨al ¨a, V.: Thermometer lag coefficient and radiation error, Vaisala News, 19, 1963.
von der Gathen, P., Rex, M., Harris, N. R. P., Lucic, D., Knudsen, B. M., Braathen, G. O., De Backer, H., Fabian, R., Fast, H., Gil, M., Kyr ¨o, E., Mikkelsen, I. S., Rummikainen, M.,
15
St ¨ahelin, J., and Varots C.: Observational evidence for chemical ozone depletion over the Arctic in winter 1991–92, Nature, 375, 131–134, 1995.
WMO.: International Radiosonde Comparison, UK, 1984 and USA, 1985, Instruments and Observing Methods Report, 30, 195, 1987.
WMO.: Guide to meteorological instruments and methods of observation, 8, 1996.
20
WMO.: Scientific Assessment of Ozone Depletion: 1991, Global Ozone Research and Moni-toring Project, 25, 1991.
ACPD
6, 7697–7714, 2006
Stratospheric temperature over the
Antarctic region M. C. Parrondo et al. Title Page Abstract Introduction Conclusions References Tables Figures J I J I Back Close
Full Screen / Esc
Printer-friendly Version Interactive Discussion EGU 150 180 210 240 270 300 330 -70 -65 -60 -55 -50 -45 -40 -35 -30 -25 Pot e nt ia l vort icit y ( PVU) Day number in 2003
Jun Jul Aug Sep Oct Nov Dec
1
Fig. 1. Seasonal evolution of the potential vorticity at the 475 K level for Belgrano station (blackline) as compared with the edge belt of the Antarctic vortex (shadowed areas) computed by the Nash criteria (see text) for the year 2003.
ACPD
6, 7697–7714, 2006
Stratospheric temperature over the
Antarctic region M. C. Parrondo et al. Title Page Abstract Introduction Conclusions References Tables Figures J I J I Back Close
Full Screen / Esc
Printer-friendly Version Interactive Discussion EGU 150 180 210 240 270 300 -6 -5 -4 -3 -2 -1 0 1 2 3 4 5 6 152 180 210 240 270 300 -6 -5 -4 -3 -2 -1 0 1 2 3 4 5 6 Day number in 2003 T ECM W F -T ra di o s on des Level 19 = 31.9 hPa ECMWF Level 18 = 25.7 hPa T ECMW F -T radi osond es Day number in 2003 -100 -95 -90 -85 -80 -75 -70 -65 -60 -55 -50 -45 -40 -35 Te mp era tur e ( ºC) Te mp er atur e ( ºC ) -100 -95 -90 -85 -80 -75 -70 -65 -60 -55 -50 -45 -40 -35 radiosondes
Fig. 2. Evolution of temperatures during the winter 2003 for radiosondes and EMCWF model at
the lower stratosphere representative levels of 31.9 and 25.7 hPa (right axis) and∆T (left axis) above Belgrano.
ACPD
6, 7697–7714, 2006
Stratospheric temperature over the
Antarctic region M. C. Parrondo et al. Title Page Abstract Introduction Conclusions References Tables Figures J I J I Back Close
Full Screen / Esc
Printer-friendly Version Interactive Discussion EGU 1010 20 30 40 50 60 70 80 90 100100 200 300 -4 -3 -2 -1 01 234
Dif (T
ECMW F-T
rad ios ondes) (ºC
)
Pressure (hPa)
ECM W F NC E P1
Fig. 3. Differences between TECMWF–Tradiosondesversus height.
ACPD
6, 7697–7714, 2006
Stratospheric temperature over the
Antarctic region M. C. Parrondo et al. Title Page Abstract Introduction Conclusions References Tables Figures J I J I Back Close
Full Screen / Esc
Printer-friendly Version Interactive Discussion EGU -100 -95 -90 -85 -80 -75 -70 -7 -6 -5 -4 -3 -2 -1 0 1 2 3 4 5 6 7 level 19 (28.9 hPa) level 18 (23.3 hPa) level 17 (18.8 hPa) level 16 (15.2 hPa) Di f (T EC M W F -T ra dio s o ndes ) ºC -95 -90 -85 -80 -75 -70 -7 -6 -5 -4 -3 -2 -1 0 1 2 3 4 5 6 7 level 20 (35.8 hPa) level 21 (44.3 hPa) level 22 (54.6 hPa) level 23 (66.6 hPa) Temperatures (ºC)
Fig. 4. Temperature versus ∆T dependent levels (left panel) and independent levels (right
panels).
ACPD
6, 7697–7714, 2006
Stratospheric temperature over the
Antarctic region M. C. Parrondo et al. Title Page Abstract Introduction Conclusions References Tables Figures J I J I Back Close
Full Screen / Esc
Printer-friendly Version Interactive Discussion EGU -100 -95 -90 -85 -80 -75 -1.0 -0.5 0.0 0.5 1.0 1.5 2.0 2.5 Di f (T radi os onde -T c a librat or ) ºC Chamber temperature (ºC)
1
Fig. 5. Low temperature calibration of the RS80 radiosonde at INTA facilities.ACPD
6, 7697–7714, 2006
Stratospheric temperature over the
Antarctic region M. C. Parrondo et al. Title Page Abstract Introduction Conclusions References Tables Figures J I J I Back Close
Full Screen / Esc
Printer-friendly Version Interactive Discussion
EGU Fig. 6. Panel left: Areas of potential PSC-I formation based on ECMWF during the winter 2003
and the same after temperature correction (bottom). Panel right: Areas of potential PSC-II formation based on ECMWF during the winter 2003 and the same after temperature correction (bottom).
ACPD
6, 7697–7714, 2006
Stratospheric temperature over the
Antarctic region M. C. Parrondo et al. Title Page Abstract Introduction Conclusions References Tables Figures J I J I Back Close
Full Screen / Esc
Printer-friendly Version Interactive Discussion EGU 123 154 184 215 246 276 0 5 10 15 20 25 30 123 154 184 215 246 276 0 5 10 15 20 25 30 M J J A S O Day number in 2003 Ar e a PSC I ( 1 0 6 km 2 ) Uncorrected Corrected Level 525 K M J J A S O Day number in 2003 Ar e a PSC I I (1 0 6 km 2 )
Fig. 7. Areas where PSC-I(left) and PSC-II (right) can be formed at the isentropic level of
525 K according to the ECMWF temperature fields (black) and corrected by radiosonde profiles (gray).