HAL Id: hal-02152882
https://hal.archives-ouvertes.fr/hal-02152882
Submitted on 11 Jun 2019
HAL is a multi-disciplinary open access
archive for the deposit and dissemination of
sci-entific research documents, whether they are
pub-lished or not. The documents may come from
teaching and research institutions in France or
abroad, or from public or private research centers.
L’archive ouverte pluridisciplinaire HAL, est
destinée au dépôt et à la diffusion de documents
scientifiques de niveau recherche, publiés ou non,
émanant des établissements d’enseignement et de
recherche français ou étrangers, des laboratoires
publics ou privés.
Major Element and Sr Isotope Composition of
Interstitial Waters in Sediments from Leg 129: The Role
of Diagenetic Reactions
Christian France-Lanord, Annie Michard, Anne Marie Karpoff
To cite this version:
Christian France-Lanord, Annie Michard, Anne Marie Karpoff. Major Element and Sr Isotope
Com-position of Interstitial Waters in Sediments from Leg 129: The Role of Diagenetic Reactions.
Scien-tific Results, 129, Ocean Drilling Program, 1992, Proceedings of the Ocean Drilling Program.
�hal-02152882�
14. MAJOR ELEMENT AND Sr ISOTOPE COMPOSITION OF INTERSTITIAL WATERS IN
SEDIMENTS FROM LEG 129: THE ROLE OF DIAGENETIC REACTIONS
1Christian France-Lanord,
2Annie Michard,
2,3and Anne Marie Karpoff
4ABSTRACT
Interstitial water samples from Leg 129, Sites 800, 801, and 802 in the Pigafetta and Mariana basins (central western Pacific), have been analyzed for major elements, B, Li, Mn, Sr, and 87Sr/86Sr. At all sites waters show enrichment in Ca and Sr and are
depleted in Mg, K, Na, SO4, B, alkalinity, and 87Sr compared to seawater. These changes are related to alteration of basaltic
material into secondary smectite and zeolite and recrystallization of biogenic carbonate. Water concentration depth profiles are characterized by breaks due to the presence of barriers to diffusion such as chert layers at Sites 800 and 801 and highly cemented volcanic ash at Site 802.
In Site 800, below a chert layer, concentration depth profiles are vertical and reflect slight alteration of volcanic matter, either in situ or in the upper basaltic crust. Release of interlayer water from clay minerals is likely to induce observed Cl depletions.
At Site 801, two units act as diffusion barrier and isolate the volcaniclastic sediments from ocean and basement. Diagenetic alteration of volcanic matter generates a chemical signature similar to that at Site 800. Just above the basaltic crust, interstitial waters are less evolved and reflect low alteration of the crust, probably because of the presence in the sediments of layers with low diffusivities.
At Site 802, in Miocene tuffs, the chemical evolution generated by diagenetic alteration is extreme (Ca = 130 mmol, 87Sr/86Sr
= 0.7042 at 83 meters below seafloor) and is accompanied by an increase of the Cl content (630 mmol) due to water uptake in secondary hydrous phases. Factors that enhance this evolution are a high sediment accumulation rate, high cementation preventing diffusive exchange and the reactive composition of the sediment (basaltic glass). The chemical variation is estimated to result in the alteration of more than 20% of the volcanic matter in a nearly closed system.
INTRODUCTION
The chemical and isotopic variations of interstitial waters ex-tracted from deep-sea sediments from many Deep Sea Drilling Project-Ocean Drilling Program (DSDP-ODP) sites are the result of diffusive exchange between seawater and the basaltic upper crust undergoing alteration (e.g., McDuff and Gieskes, 1976). The classi-cal pattern observed is a mole-to-mole increase of Ca and depletion of Mg. Diagenetic reactions also generate chemical variations in the interstitial waters. Volcanic ash in the sediment is commonly altered and produces a chemical pattern similar to that of alteration of basaltic upper crust (e.g., Kastner and Gieskes, 1976). The chemical depth profiles at a given site represent, therefore, the synthesis of three main processes: diffusion, diagenesis, and alteration of the basaltic crust. All are controlled by a set of more or less independent factors in the sediment: mineralogical composition, diffusive prop-erties, chemical reactivities, sedimentation rate, porosity, permeabil-ity, and temperature.
In this paper we present the chemical and Sr isotope composition of interstitial waters sampled during Leg 129. The chemical transfor-mations of the interstitial waters are interpreted on the basis of mineralogical, chemical, isotopic, and physical data from the sedi-ments. Three sites (800, 801, and 802) were drilled in the Pigafetta and East Mariana basins in order to recover Jurassic sediment and oceanic crust (Fig. 1). Site 801 reached Callovian-Bathonian sedi-ments overlying alkali and tholeiitic basalts, which are a remnant of the Jurassic superocean that once covered two-thirds of the EarüYs surface. At all three sites there are thick Cretaceous volcaniclastic
Larson, R. L., Lancelot, Y., et al., 1992. Proc. ODP, Sci. Results, 129: College Station, TX (Ocean Drilling Program).
2 Centre de Recherches Pétrographiques et Géochimiques—CNRS, BP 20, 54501
Vandoeuvre Cedex, France.
3 Laboratoire Geosciences de l'environnement, Université St. Jéröme, CO. 431,
13397 Marseille Cedex 13, France.
4 Centre de géochimie de la surface—CNRS, 1 rue de Blessig, 67000 Strasbourg, France.
sequences which are overlain at Sites 800 and 801 by siliceous layers. At these sites the influence of diffusion is considerably reduced because of the presence of a high degree of cementation. These diffusion barriers allow us to examine closely the budgets of diage-netic reactions and the chemical behavior of smectite-rich sediments. At Site 802 concentrations of most elements reach extreme values similar to those observed at several recently drilled ODP sites in Miocene-Oligocene volcaniclastic sediments (Egeberg et al., 1990a, 1990b; Collot, Greene, Stokking, et al., 1992; Parson, Hawkins, Allan, et al, 1992; Blank, 1991).
METHODS
Water samples were extracted by squeezing 5- to 10-cm-long whole-round core sections at room temperature in a titanium and stainless steel piston modified after Manheim and Say les (1974). Shipboard analyses include pH, salinity, chlorinity, and alkalinity, and concentrations of calcium, magnesium, sulfate, potassium, strontium, silica, and manganese. Shipboard data and techniques are discussed in the Initial Reports (Lancelot, Larson, et al., 1990). Concentrations of Na, Mg, K, and Li were measured by atomic absorption in absorp-tion mode, and B, complexed with carminic acid, was measured by a colorimetric method.
87Sr/86Sr ratios and Sr content were measured on a six-collector 262
Finnegan-Mat mass spectrometer in static mode. Sr isotope analyses were done on interstitial water samples and rock samples. Rock samples were leached with 0.5N HC1 acid and rinsed with distilled water. After centrifugation, the acid leachate and first rinse were combined and dried. Part of the dried material was weighed and spiked (leachate), as was a part of the residual material (residue). Hence, rock analyses comprise analyses of (1) the leached residue (mostly silicates) and (2) the leachate where Sr is mainly released by carbonates but also by hydroxides and interstitial water salts. Chemical separation fol-lowed the technique described by Alibert et al. (1983).
On the basis of chemical composition of the drilling mud and seawater and of the period of injection of the mud during drilling, no
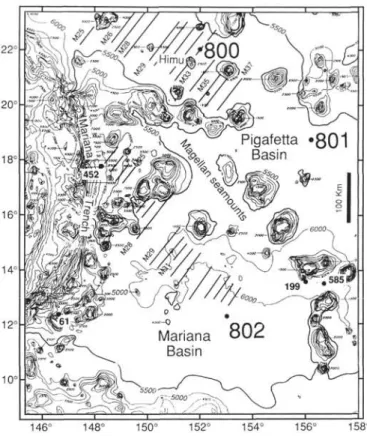
20° 18' 16° 14C 12C 10° 146° 148° 150° 152° 154° 156° 158° Figure 1. Location of Sites 800, 801, and 802 and DSDP sites in the area of the Pigafetta and East Mariana basins (Lancelot, Larson, et al., 1990). Bathymetry in meters. Diagonal lines denote magnetic anomalies.
contamination by seawater and/or drilling fluids is evident (Lancelot, Larson, et al., 1990). None of the observed chemical variations can be explained by the mixing of pore water with seawater or drilling fluids. Moreover, isotopic compositions of Sr and hydrogen (France-Lanord and Sheppard, this volume) show no evidence of seawater addition.
Major and trace elements analyses of solid sediment were done by ICP at CNRS-CRPG, Nancy, France (K. Govindaraju, analyst) after melting with Ce metaborate. Analyses were done on squeezed cake samples which reduce the contribution of interstitial water salts. This is especially important for Na concentrations.
SITE DESCRIPTIONS AND RESULTS
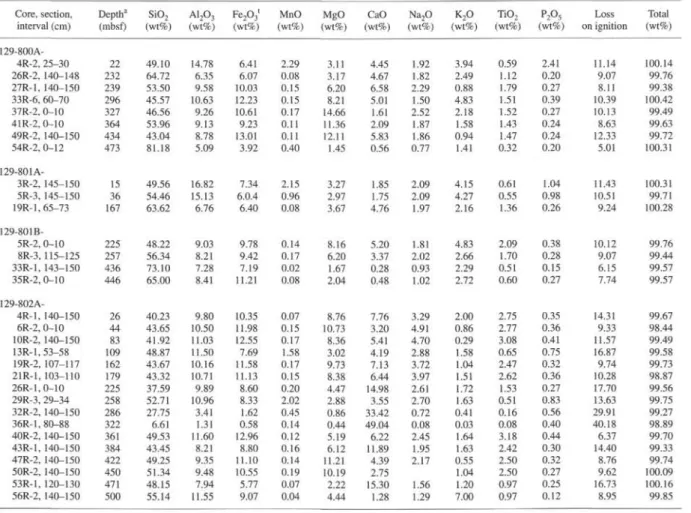
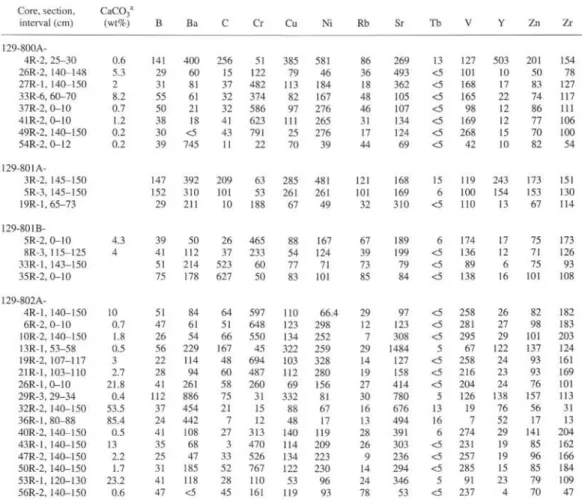
Analyses of interstitial water are given in Table 1 and shown as concentration vs. depth diagrams in Figures 2,3,4, and 5. Correspond-ing sediment lithologic descriptions and whole-rock X-ray diffraction (XRD) determinations are reported in Table 2, and major and trace element analyses of solid sediments in Tables 3 and 4, respectively.
Site 800—Pigafetta Basin
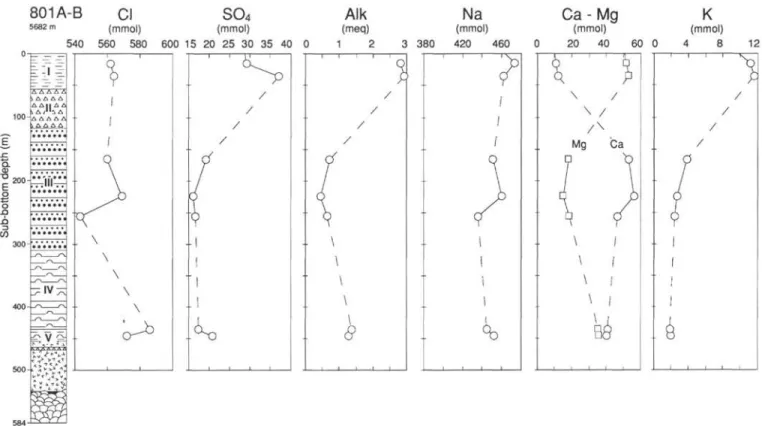
Site 800 is located at a water depth of 5686 m in the northern Pigafetta Basin near the Himu Seamount (Fig. 1). The sediments range in age from Cenozoic to Berriasian. They have been divided into five units (Fig. 2):
Unit I (0-38 m below seafloor [mbsf]): Tertiary to upper Cam-panian zeolitic pelagic brown clay.
Unit II (38-78 mbsf): upper Campanian to Turonian brown chert and porcellanite.
Unit III (78-229 mbsf): Cenomanian to lower Albian gray chert and silicified limestones and nannofossil chalk at the base. Porosities are low (7 to 20 vol%) at the top.
Unit IV (229^50 mbsf): Aptian volcaniclastic turbidites in se-quences of interbedded clay, claystones, silty clay, silty sandstone, and sandstones. They are composed of (1) redeposited volcanic ash, with sporadic biogenic carbonates in the upper part and (2) secon-dary smectites, zeolites, and calcite. Volcanic material is possibly derived from the nearby Himu Seamount (Fig. 1) whose age is 120 Ma (Smith et al., 1989).
Unit V (450-498 mbsf): Hauterivian to Berriasian claystone and radiolarite.
The sediment sequence overlies massive dolerite sills.
Eight samples were squeezed, one from Unit I and seven from Unit IV and below (Table 1). Because of both the lithology and scarce recovery, no samples were taken in Units II and III. The major solute concentrations differ above and below the chert layers (Fig. 2). Concentrations at 22 mbsf are similar to seawater values. Below, in Unit IV, Na, Mg, K, SO4, and alkalinity concentrations are strongly
reduced. Cl is also depleted to about 95% of its value in seawater. The extent of the depletion is lower at 327 and 473 mbsf. The overall trend of Ca concentration is the opposite of the other major constituents.
The Sr concentration is 3.5 times higher than in seawater at 232 mbsf and remains at similar concentrations below. 87Sr/86Sr ratios are
relatively constant in Units IV and V, between 0.70635 and 0.70661. These values are significantly lower than those of 115- to 135-Ma seawater (0.7072-0.7075; Koepnick et al., 1985).
Site 801—Pigafetta Basin
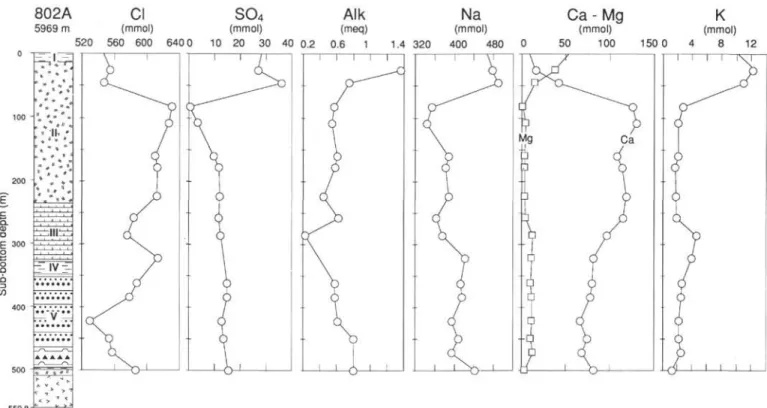
Site 801 is situated within the "Jurassic magnetic quiet zone" in the central part of the Pigafetta Basin to the southeast of Site 800 (Fig. 1), at a water depth of 5674 m. The 462 m of sediments that were cored range in age from Cenozoic to Callovian and were divided into five units (Fig. 3):
Unit I (0-64 mbsf): Tertiary to Campanian pelagic brown clay. Unit II (64-126 mbsf): Campanian to Turonian brown chert and porcellanite.
Unit III (126-318 mbsf): Cenomanian and Albian volcaniclastic turbidites with sporadic interlayers of pelagic clay, radiolarite, chert, and chalk. Turbidites are composed of volcanic ash and fragments (glass, feldspar, pyroxene, etc.) and secondary smectite, zeolite, and calcite.
Unit IV (318-443 mbsf): Valanginian to Oxfordian brown radio-larite with dark brown chert. Chert is abundant at the top and porosity is very low.
Unit V (443^462 mbsf): Callovian-Bathonian umber radiolarite and claystone. Metalliferous sediments consisting of pelagic clay, radiolarite, and hydrothermal hydroxide.
The basement consists of an upper alkali olivine basalt sequence (462-591 mbsf) and a lower tholeiitic pillow basalt sequence (462-591 mbsf). They are separated by a silicified hydrothermal deposit of hematite. Seven interstitial water samples were squeezed, two from above chert Unit II and four below (Table 1). No samples were taken in the chert layer (Unit II). Interstitial water composition (Fig. 3) are chemi-cally similar to modern seawater in the brown clay of Unit I. Only Si and SO4 are significantly higher at 36 mbsf. Below Unit II, interstitial
water extracted from the volcaniclastic turbidites display a general depletion in Mg, K, and Na and an enrichment in Ca. The overall depletion in cations is balanced by alkalinity, and SO4 decreases while
Cl remains constant. In Unit V, these changes are less significant than in the volcaniclastic turbidites.
The B content is high at the top of the sequence (783 µmol at 23 mbsf) compared to seawater. Below the chert the concentrations are variable between 300 and 500 µmol. Si is high (427 µmol) at 175 mbsf, where opal is abundant, and remains constant below at 200 µmol. Sr is almost constant at 260 ± 20 µmol below Unit H The ^Sr/^Sr ratios are signifi-cantly lower than contemporaneous seawater in Unit in. In Unit V, the
87Sr/86Sr ratio of pore water at 454 mbsf is in the range of 160-Ma Jurassic
seawater (0.7068-0.7073; Koepnick et al., 1990).
Table 1. Interstitial water concentration data and Sr isotope compositions. Core, section. interval (cm) 129-800A-4R-2, 25-30 26R-2, 140-148 27R-1, 140-150 33R-6, 60-70 37R-2.0-10 41R-2, 0-10 49R-2, 140-150 54R-2.0-12 129-801A-3R-2, 145-150 5R-2, 145-150 19R-2, 65-73 129-801B-5R-2, 0-10 8R-3, 115-125 33R-1, 143-150 35R-2, 0-10 129-802A-4R-1, 140-150 6R-2, 0-10 10R-2, 140-150 13R-1,53-58 19R-2, 107-117 21R-1, 103-110 26R-1,0-10 29R-3, 29-34 32R-2, 140-150 36R-1,80-88 40R-2, 140-150 43R-1, 140-150 47R-2, 140-150 50R-2, 140-150 53R-1, 120-130 56R-2, 140-150 Depth" (mbsf) 22 232 239 296 327 364 434 473 23 44 175 233 265 444 454 26 44 83 109 162 179 225 258 286 322 361 384 422 450 471 500 pH 7.5 8.2 8.1 7.8 8.1 7.1 7.1 8.2 7.5 7.6 8.0 7.7 8.1 7.5 7.9 7.8 8.3 9.0 7.8 8.5 8.4 8.1 7.2 6.5 8.0 7.9 7.9 7.9 8.2 Cl (mmol) 569 537 527 530 554 531 531 554 562 564 560 569 543 586 572 554 547 631 627 610 613 612 584 576 614 598 579 530 553 557 586
so
4 (mmol) 25.8 17.6 14.5 14.0 16.4 11.1 12.3 13.2 29.3 37.2 19.3 16.1 16.8 17.5 21.0 26.8 36.5 0.4 3.7 9.9 11.9 12.2 12.0 12.5 15.0 15.1 13.2 13.6 15.7 Alkalinity (meq) 2.28 0.53 0.51 0.58 1.19 0.61 0.71 0.64 2.83 2.92 0.72 0.46 0.64 1.37 1.28 1.36 0.75 0.57 0.54 0.60 0.58 0.44 0.62 0.23 0.58 0.58 0.62 0.80 0.80 Nab (mmol) 480 436 416 416 444 414 411 426 483 496 449 453 441 465 458 484 492 377 362 402 398 390 360 375 423 430 425 396 406 388 446 Na (mmol) 477 413 417 442 395 401 404 473 462 452 460 436 445 452 477 489 354 344 388 381 388 363 423 413 415 394 409 395 443 Ca (mmol) 10.5 56.0 58.3 58.2 54.7 57.3 59.2 60.8 10.9 12.0 53.2 56.1 46.6 40.9 40.4 16.2 42.3 125.2 130.2 108.3 114.3 118.4 115.5 96.1 81.8 80.5 77.3 66.8 74.0 68.9 81.5 K (mmol) 11.8 2.8 1.8 1.4 1.9 1.6 1.3 2.0 11.2 11.6 3.8 2.7 2.4 1.9 2.0 12.2 11.0 2.7 2.1 2.1 1.7 1.8 1.9 4.6 3.9 2.6 2.5 2.2 2.2 2.5 1.2 Mg (mmol) 53.1 10.6 8.9 11.0 16.0 10.4 12.2 14.4 52.0 53.2 18.4 15.1 18.6 35.3 36.0 38.6 15.4 0.5 4.3 3.9 3.6 2.9 4.7 12.9 11.8 10.4 12.1 11.6 10.7 12.5 2.9 B (µmol) 759 509 591 481 205 346 783 715 316 508 315 485 324 736 433 43 111 308 315 324 370 386 282 270 668 336 318 Si (µmol) 377 546 206 193 185 158 231 200 323 427 249 233 212 218 162 78 194 197 157 124 151 913 637 499 556 203 179 652 216 Sr (µmol) C89 C32I 299 318 297 317 331 337 C84 C86 253 281 238 276 c280 91 135 352 283 468 "459 487 "473 399 350 294 303 260 284 265 241 nM (µmol) 2 87 58 33 49 38 18 6 0 4 51 97 123 28 25 6 13 19 22 16 11 20 41 46 34 48 53 54 20 22 Li (µmol) 33 29 30 30 27 17 13 13 26 22 6 6 7 6 6 11 22 26 23 11 10 •"Sr/^Sr 0.706351 ± 37 0.706584 ± 24 0.706607 ± 30 0.706618 ± 32 0.706584 ± 24 0.706568 ± 23 0.706455 ± 22 0.706383 ± 24 0.706634 ± 11 0.707013 ± 19 0.708022 ± 39 0.706055 ± 28 0.704271 ± 18 0.704330 ± 30 0.705835 ± 27 0.706172 ± 25 0.706711 ± 28 0.707096 ± 27 0.707002 ± 23 0.707088 ± 20 0.7069161 20 0.706988 ± 23 0.707095 ± 19 0.706920 ± 23Notes: Most pH, Cl, SO4, alkalinity, Ca, Mg, K, Si, and Mn data are shipboard analyses (Lancelot, Larson, et al., 1990). Mean value of 84Sr spiked NBS 987 is 0.710219 ± 18. aDepths rounded to the nearest meter.
Calculated by charge balance.
cAnalyzed by atomic absorption rather than by isotope dilution.
Site 802—East Mariana Basin
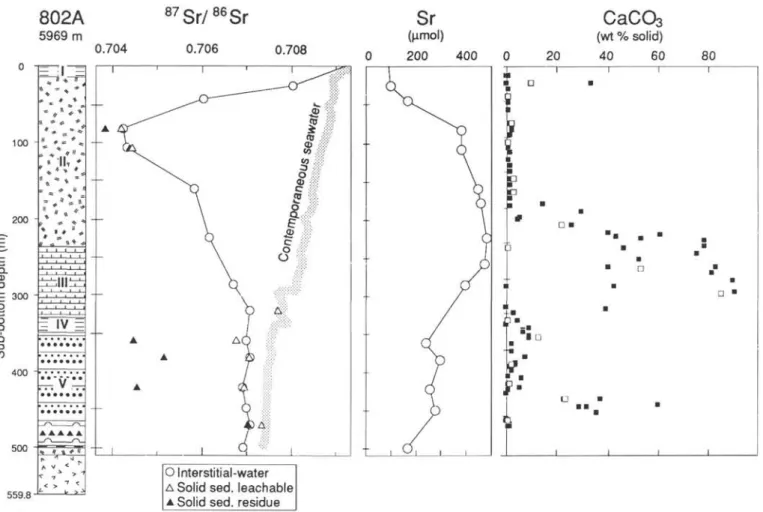
Site 802 is in the center of the East Mariana Basin, more than 300 km from any known seamounts or island arc (Fig. 1). The water depth is 5674 m. The sediment sequence is 500 m thick and consists of redeposited material. It has been divided into nine units (Fig. 4):
Unit I (0-15 mbsf): Neogene brown clay.
Subunits HA and IIB (15-254 mbsf): Miocene to Eocene tuff with indurated, well-preserved hyaloclastites and volcanic ash. Between 15 and 160 mbsf (Subunit IIA) the tuffs are well cemented. They are intercalated with a few layers of pelagic clay, and in the lower half they are mixed with chalk. Secondary minerals include smectites and zeolites and can range from 10% to 90% of the rock. Horizontal fractures of thaumasite (Ca3 Si(OH)6 CO3 SO4, 12H2O), pure or
mixed with zeolite, are common at the top. The mineralogy is fully described in Karpoff et al. (this volume).
Unit III (254-330 mbsf): upper Paleocene nannofossil chalk, probably redeposited as a gravity flow.
Unit IV (330-348 mbsf): Maestrichtian zeolitic pelagic claystone. Unit V (348-460 mbsf): Campanian volcaniclastic turbidites with claystone, porcellanite, and debris flow.
Units VI to IX (460-509 mbsf): Cenomanian to upper Albian brown claystone, radiolarian limestone, and volcaniclastic turbidites.
The basement consists of remarkably fresh extrusive basalt. Interstitial water samples were squeezed from sediment cores at 16 depths between 26 and 500 mbsf (Table 1). The depth profiles
show a clear break between 26 and 83 mbsf, with extremely large increases in Ca, Cl, pH, and Sr, and a strong decrease in 87Sr/86Sr
ratios, Mg, K, Na, SO4, alkalinity, B, and Li. Below, the compositions
are generally constant (Figs. 4 and 5). From 258 to 500 mbsf, the trend is a progressive decrease of salinity (about 39‰to 34%o) due to decreases in Ca and Cl contents. In this interval, Na and Mg contents increase slightly.
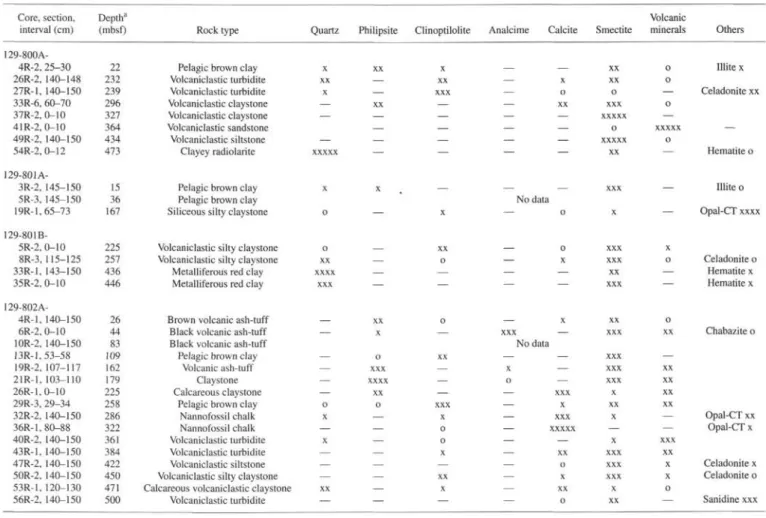
Pore-water 87Sr/86Sr ratios (Fig. 5) reach a minimum of 0.70427
at 83 mbsf. This value is similar to the 87Sr/86Sr ratios of both the
silicate and leachable fractions of the solid sediment (Table 5 and Fig. 5). Below, the pore-water 87Sr/86Sr ratios increase progressively to
0.707 at 322 mbsf, in the chalk of Unit III. At 322 mbsf the 87Sr/86Sr
ratio of carbonate is similar to that of contemporaneous seawater. From 361 to 500 mbsf, the 87Sr/86Sr ratios of pore waters and
leach-able fraction are almost constant around 0.7070, which is lower than
87Sr/86Sr ratios of contemporaneous seawater.
These concentrations and isotopic compositions are very unusual. For all of the DSDP-ODP sites, only several recent legs report comparable concentration gradients in volcaniclastic formations: Leg 126 (Sites 792 and 793; Egeberg et al., 1990b), Leg 134 (Sites 832 and 833; Collot, Greene, Stokking, et al., 1992), and Leg 135 (Site 841; Parson, Hawkins, Allan, et al., 1992; Blanc et al., 1991). The characteristics that these sites have in common with Unit II at Site 802 are the age, the fresh volcaniclastic compounds, and the high sedimentation rates. The main difference is the geodynamic context, which is forearc or intra-arc for Legs 126, 134, and 135.
800A Cl SO
4Alk Na
5687 m (mmol) (mmol) (meq) (mmol)520 540 560 580 10 15 20 25 30 0.5 1 1.5 2 2.5 380 420 460 A A A A A A A A A A A A A A A A A A A A A A " |V; A A A A A
Ca -Mg
(mmol) 20 \ \ \ / Mg 40 / /V
/ \
\
60y
CaK
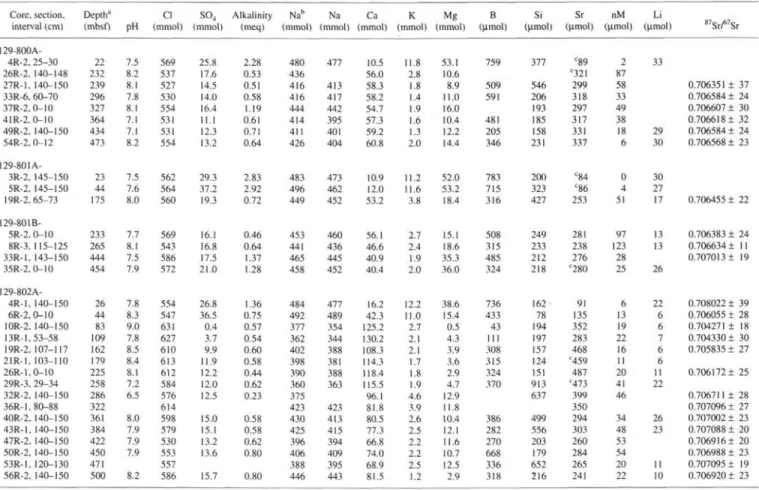
(mmol) 4 8 12Figure 2. Distribution with depth of chloride, sulfate, alkalinity, sodium, calcium, magnesium, potassium, silica, manganese, boron, lithium, strontium, and 7Sr/8
in pore fluids of Site 800. The contemporaneous seawater curve for the Sr isotope ratio is drawn after Koepnick et al. (1985). Lithologic legend in Figure 4. 'Sr
DISCUSSION
At all sites the interstitial water depth profiles present the classical
depletion in Mg, K, Na, SO4, and alkalinity, and enrichment in Ca.
This variation with depth has been described at numerous DSDP-ODP sites. It results from the superimposed effects of (1) diffusion between upper crustal basalts undergoing alteration, and (2) in-situ reactions of volcanogenic sediment to clays and zeolites (e.g., Kastner and Gieskes, 1976; McDuff, 1981). At these three sites, the 87Sr/86Sr ratios
of interstitial water are always lower than those of contemporaneous seawater except for the topmost samples and the bottom one at Site 801 (Fig. 3). Low 87Sr/86Sr ratios confirm the major role of basaltic
alteration. In both cases reactions of basaltic material, which is altered to smectites and zeolites (phillipsite and clinoptilolite), are involved. These reactions release Ca and consume Mg, Na, and K from the interstitial water. Similar secondary mineralogy and chemical vari-ation of pore waters are observed on experimental altervari-ation of basalts at low temperature (e.g., Crovisier et al., 1987; Crovisier, 1989). The interstitial water chemistry of each site provides evidence for specific processes involving alteration of basaltic matter either within the sediments or in the underlying basalts, and other diagenetic reactions. We examine the Sr budget on the basis of two main processes: (1) volcanic Sr release during alteration, which tends to lower the Sr isotope ratio, and (2) dissolution/recrystallization of biogenic tests, which releases Sr with an isotopic ratio of seawater contemporaneous to that of the sediment. The volcanic contribution to the Sr budget can be estimated from Sr isotope ratios of contemporaneous seawater and volcanic material (Hawkesworth and Elderfield, 1978):
r _ v ^r' ^) seawater ~ ( ^ " ^r) interstitial , .~. ~ , * •. /volcanic- . 8 7 cr/ 8 6 er\ _ ( 8 7 or/ 8 6 çr\ i U U ^>
V v->1/ Jl) seawater \ o l / o l ^volcanic
The input of biogenic Sr can be estimated from the Sr content budget:
The biogenic contribution to Sr is, therefore,
/ , S r — Srs e a w a t e r — (/volcanic × Sr)
× 100. (3)
/ , "^^interstitial ^'"seawater ' ^volcanic + ^biogenic (2)
/biogenic
Site 800
Distinctive features of the concentration profiles from Site 800 are (1) the break in slope at the chert and porcellanite unit and (2) the low chlorinity of most samples from the volcaniclastic unit. The changes in gradients are certainly due to the presence of the chert, which reduces diffusional communication. The chert unit corresponds to logging Unit 1, characterized by 6- to 9-ohm-m resistivities, which are high compared with those of other formations (0.5 to 3 ohm-m in lithologic Units III and IV) (see "Downhole Measurements" section, "Site 800" chapter, Lancelot, Larson, et al., 1990). Chert porosity is 10%-30%, whereas it is 30%-60% in the volcaniclastic sediments ("Physical Properties" section, "Site 800" chapter, 1990). Both high resistivity and low porosity imply a low diffusion constant in this unit. These results confirm the role of lithologic barriers to diffusion, which was already described for similar examples of chert over volcaniclas-tic units (DSDP Sites 315 and 317—Gieskes, 1976; DSDP Site 462—Gieskes and Johnson, 1981).
Diagenesis or Diffusion from the Basaltic Crust?
Under the chert barrier the interstitial water concentrations result from the combined effect of diffusion from basaltic crust and in-situ diagenetic reactions. The existence of in-situ reactions is indicated by two observations:
1. Unit IV is composed mainly of fresh and altered volcaniclastic material, including glass, which is unstable (e.g., Gislason and Eug-ster, 1987). Authigenic smectites and zeolites (phillipsite and
800A
5687 m
Si
(µmol) (µmol)
Mn
(µmol)B
Li
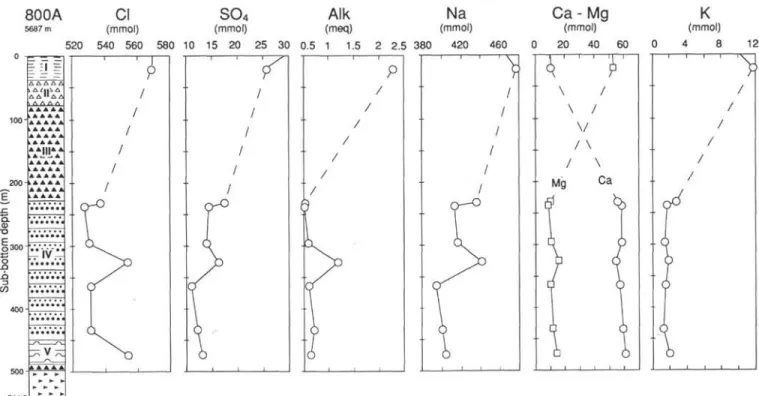
(µmol) ΔΛ "ΔΔ A A A A A A A A A A A AAA A A A A A A A A A >A A A A AAlMAi i A "L A A A A A A A A A A AAA A A §300 V ?r 150 300 450 600 0 20 40 60 80 100 150 450 750 i 1 r 28 30Sr
8 7Sr/
8 6Sr
(µmol) 0 100 200 300 0.706 0.708 Figure 2 (continued).tilolite) are abundant (Karpoff, this volume). The formation of such minerals from volcanic minerals (pyroxene, plagioclase, etc.) or glass consumes Mg, Na, and K and releases Ca. In this case the alkalinity sink results from calcite precipitation in response to the increase in
Ca concentration. Such reactions also lower the 87Sr/86Sr ratio of
interstitial water, as volcanic Sr with a low 87Sr/86Sr ratio is released
(e.g., Hoffert et al., 1978).
2. The concentration profiles are not straight, contrary to what is
expected for nonreacting sediments. Concentrations of Na, SO4, Cl,
and, to a lesser extent, Mg, and K are significantly less depleted at 232, 327, and, for some elements, 473 mbsf. The Ca and Sr contents are lower at 232 and 327 mbsf. This is correlated with mineralogical and chemical differences in the sediments. At 232 and 473 mbsf,
quartz is more abundant, with SiO2 at 64.7 and 81.2 weight percent
(wt%), respectively, instead of 43 to 53 wt%, as in the rest of the sequence (Table 3). The observed mineralogy is not, however, com-pletely consistent with the Na profiles. Interstitial waters below 327 mbsf are the most depleted in Na. If we correct the depletion for a possible effect of dilution by low-salinity water (see the following discussion), the decrease in Na is approximately 20 mmol/L with respect to seawater. Na loss is usually due to Na-zeolite formation; however, zeolites have not been detected by XRD analysis in these samples (Table 2). Karpoff (this volume) reports a minor occurrence of clinoptilolite in the upper section of the unit. The observed chemi-cal trends may correspond only to very minor changes in the miner-alogy of the sediment (e.g., Egeberg et al., 1990a). The observed depletion of Na could result from the neoformation of only 1 to 5 wt% of zeolite, depending on the exact stoichiometry of the reaction and the porosity. A small amount of zeolite could be difficult to observe by XRD. The Na profile may also be the result of diffusion from the basaltic crust, as pore waters from basaltic crust are depleted in Na (Mottl and Gieskes, 1990).
Sr Budget
For the samples of the volcaniclastic sediments of Site 800, /v o l c a n i c
varies between 19 and 25 mol% for a volcanic ratio of 0.7035.
Figure 6 shows that the Sr content is higher than can be predicted for a simple model of dissolution of basalt in seawater. The Cretaceous Sr content of seawater is not known (e.g., Holland, 1978), which adds a major uncertainty to budget calculations. Assuming that the initial
Sr content of the interstitial water was 85 µmol, /biO g e n i c should be
around 50 mol% (i.e., 150 µmol is biogenic). This is a minimum estimate because the Sr uptake in secondary smectites is not in-cluded. The minimum amount of carbonate recrystallization can be calculated. Manheim and Say les (1974) estimate that biogenic car-bonates lose about 1000 parts per million (ppm) Sr as a consequence of recrystallization. Therefore, in a sediment with 25 wt% interstitial water, the 150 µmol Sr of biogenic origin requires the recrystalliza-tion of 0.5 wt% calcite in the solid sediment. This is compatible
with the CaCO3 content in the sediment between 229 and 434 mbsf
(0.5 to 10 wt%, Table 4; "Site 800" chapter, Lancelot, Larson, et al.,
1990). In the radiolarite of Unit V, the CaCO3 content is less than 0.2
wt%; however, recrystallization of this small concentration could still produce a biogenic fraction of 50 mol% because of the low pore-water content (<5 wt%).
Chlorine Depletion
Four of the five samples from Unit IV are depleted in Cl by about 6% with respect to seawater. The chloride ion is conservative in marine sediments because there are no significant sinks or sources (e.g., Say les and Manheim, 1975). Contamination by drilling mud being excluded, such a depletion is due to dilution by low-chlorinity water. Sources of fresh water are probably local because the depletion is not uniform in the Unit IV. Several sources may be proposed:
1. Dehydration related to diagenetic reactions such as organic matter degradation, smectite to illite reaction, gypsum to anhydrite conversion, or opal-A/opal-CT/quartz transitions. Based on the min-eralogical composition of Unit IV, none of these reactions is likely to produce sufficient amounts of water in this context. Illite is not observed by XRD in this unit (Karpoff* this volume) and temperatures of Unit IV (10°-18°C; A. Fisher, pers, comm., 1991) are to low for
801A-B Cl SO
4Alk
5682 m (mmol) (mmol) (meq)
540 560 580 600 15 20 25 30 35 40 0 1 2 3 380
Na
(mmol) 420 460 0Ca
• M g (mmol) 20 40 60 0K
(mmol) 4 8 128
Figure 3. Distribution with depth of chloride, sulfate, alkalinity, sodium, calcium, magnesium, potassium, silica, manganese, boron, lithium, strontium, and 87Sr/86Sr in
pore fluids of Site 801. The contemporaneous seawater curve for the Sr isotope ratio is drawn after Koepnick et al. (1985, 1990). Lithologic legend in Figure 4.
this type of reaction (Dunoyer de Segonzac, 1970). Opal-A/opal-CT/quartz transitions are unlikely because silica phases are rare in Unit IV (Karpoff, this volume); moreover, the levels where SiO2 is
abundant (232 and 473 mbsf) do not show significant Cl depletions. 2. Ion filtration processes could retain chloride ions in a clay-rich formation and produce low-chlorinity water (Hanshaw and Coplen, 1973), which could percolate into the sampled area. This seems unlikely because no Cl-rich waters have been observed.
3. Interlayer water expulsion under burial compaction from smec-tite-type minerals (e.g., Burst, 1976; Bird, 1984). This process is difficult to demonstrate, as there are no verifiable measurement of sorbed water. The effect of interlayer dewatering on pore water de-pends on the porosity and on the interlayer water content of the clay. For example, to generate the measured freshening (560 to 530 mmol Cl) it would be necessary to release 8.5 g H2O/kg of sediment for a
pore-water content of 15 wt% and 20 g H2O/kg for a pore-water content
of 35 wt%. The interlayer water content of smectite (/) is difficult to determine. According to Bird (1984) it is variable with confining pressure and temperature. In the conditions of Unit IV it can be estimated to be between 15 and 20 dry wt%. Figure 7 illustrates the relative loss of interlayer water necessary to freshen pore water by 6% as a function of the final pore-water content. This calculation is for sediment with 90 wt% smectite, and / has been fixed at 15 and 20 dry wt% (Bird, 1984; Newman, 1987, chapter 5, p. 257).
This process is strongly dependent on the porosity. Estimates of pore-water contents have been made for two smectite-rich samples on the basis of measurement of total water content (pore water+interlayer water + adsorbed water) (France-Lanord and Sheppard, this volume). The estimates of pore-water content are 42.7^40.4 wt% at 327 mbsf and 23.7-20.6 wt% at 364 mbsf, assuming values of i = 15 and 20% dry wt%, respectively, and 90 wt% of smectite in the sediment. A 6% chlorinity decrease would require a release of 7%-10% of the initial interlayer water at 364 mbsf and 18%-21% at 327 mbsf (Fig. 7).
In this context, the dewatering of interlayer water of smectite is a likely source of fresh water. Small losses of interlayer water (5%-10%) may explain the decrease in Cl content of interstitial water in samples that are smectite-rich and have low porosity. At 327 mbsf the porosity is too high and no decrease of Cl concentration is observed. At 232 and 473 mbsf, where SiO2 is more abundant (64.7
and 81.2 wt%, Table 3), the chlorinity reduction is only 4% and 1.5%, respectively. This process is not frequently observed in similar deep-sea sediments; it has been proposed for ODP Site 765 (Ludden, Gradstein, et al., 1990) and inferred as a deep source of fresh water in the Barbados accretionary complex (Tribble, 1990; Gieskes et al., 1990; Vrolijk et al., 1991). At Site 800, the chert of Unit III prevents diffusion, which helps to maintain the differences in concentration. This, combined with a relatively low pore-water content (10-15 wt%) and high smectite content, is a factor in increasing the effect of the reaction.
Site 801
Diffusion Barriers and Alteration of the Jurassic Crust
Interstitial water depth profiles at Site 801 are far from simple diffusion profiles. Between 0 and 300 mbsf the chemical change is relatively similar to that at Site 800. A change in slope for nearly all chemical profiles occurs between Units I and III, which are separated by 60 m of chert-rich sediments. Low diffusion constants in the chert are indicated by the high sediment resistivities (2 to 10 ohm-m) and low porosities (8%-20%) (see "Physical Properties" and "Downhole Measurements" sections, "Site 800" chapter, Lancelot, Larson, et al., 1990). Interstitial water in the volcaniclastic Unit III is depleted in Mg, K, SO4, alkalinity, B, and Li, and enriched in Ca and Sr. The 87Sr/86Sr ratios are also lowered compared with that of
contempora-neous seawater. The volcanic contribution to Sr is estimated to be at 20 to 25 mol% (Fig. 6). All of these compositions are typical of an alteration reaction of material of basaltic origin.
801A-B Si
5682 m (µmol)
200 300 400
Mn B Li Sr
8 7Sr/
8 6Sr
(µmol) (µmol) (µmol) (µmol)
0 50 100 150 300 450 600 750 900 10 15 20 25 30 35 0 100 200 0.706 0.708
~ -I —
i i r
584-Figure 3 (continued).
From Units III to V, there is a reverse evolution of Ca, Mg, and alkalinity contents and the Sr isotope ratio. The waters in Unit V are less modified compared to seawater than those in Unit III. This change in gradients between Units III and V is important because, first, it implies that the interstitial water chemistry in volcaniclastic Unit III is mainly controlled by in-situ reactions rather than by diffusion from the basement. Second, the small effect of volcanic alteration on interstitial waters only 50 m above the basement suggests that the basaltic crust is not undergoing active low-temperature alteration. The petrographic and geochemical study of the underlying basalts (Alt et al., this volume) shows that significant alteration is limited to the alkali basalts and the upper 20 m of the tholeiitic basalts and is mainly related to low-temperature hydrothermal circulation. Below 540 mbsf
the basalts are remarkably fresh. For instance, the H2O+ content of the
basalts never exceeds 1.5 wt%, and the δ1 8θ values of the whole-rock
basalts are between 6‰and 8‰, little enriched in 18O (e.g.,
Muelen-bach, 1986). Based on a positive covariation between age and δ1 8θ
of deep-sea basalts, Muelenbach (1980, 1986) concluded that low-temperature alteration is a continuous process and persists even after sediment deposition. This has been confirmed by the interstitial water chemistry in sediments (Lawrence and Gieskes, 1981). At Site 801, the restricted diffusion through the sediments may partially explain the limited aging alteration of the basalts. In addition to the chert of Unit II, the radiolarite of Unit IV is a thick barrier for diffusion. Especially between 330 and 400 mbsf, relatively low porosities (2.5 to 10 vol%) and high resistivities ( 5 ohm-m) have been measured ("Site 801" chapter, Lancelot, Larson, et al., 1990).
Diagenetic Reactions
Interstitial waters in Unit III are almost isolated by their position between the chert and the radiolarite; hence, their chemistry is prin-cipally controlled by diagenetic reactions. The chemical changes of major ions is broadly similar to what is observed in the Site 800 volcaniclastic sediments. The main differences are (1) the Na
concen-trations are constant indicating that Na is not incorporated in the secondary phases, and (2) the stability of Cl in Unit III except for a slight dip at 265 mbsf (543 mmol). The mineralogy of secondary minerals is also different from that of Unit IV of Site 800 (Table 2). Here, zeolites are rare and celadonite is dominant with smectite. At 175 and 233 mbsf, celadonite and/or opal are dominant (Tables 2 and 3); hence, interlayer water release cannot have a reduced salinity. It is only at 265 mbsf, where smectite is dominant, that a slight fresh-ening of pore water is observed.
In Unit III the volcanic Sr represents 20 to 25 mol% of the total Sr and the Sr budget implies a biogenic carbonate contribution (Fig.
6). The CaCO3 content of the sediment is 4-8 wt%, which is much
higher than required by the preceding carbonate recrystallization model. In Unit V the volcanic Sr contribution is negligible, -3.5 to 4 mol% depending on the Sr isotope ratio of the contemporaneous seawater. The absence of volcanic contribution is consistent with the absence of volcanic detritus in the sediment, the red clay being of authigenic origin (Karpoff, this volume). Assuming a Sr concentra-tion of 85 µmol for Jurassic seawater, the Sr concentraconcentra-tion implies a
Sr input of 200 µmol/L. The CaCO3 content of the sediment (<0.2
wt%) is too low to account for Sr input by carbonate recrystallization. Sr may be released by dissolution of radiolarite tests, such as Acan-tharia, which contain Sr (Odum, 1951). An alternative is that Sr is released from authigenic smectite during diagenetic modifications with increasing burial and age (Clauer et al., 1975; 1982).
Site 802
The concentration gradients in the first hundred meters of Hole 802A are among the highest ever recorded in a DSDP-ODP hole. Between 44 and 83 mbsf, both Cl and Ca increase by 83 mmol/L,
SO4, Mg, K, B, and Li are reduced to almost zero, and the 87Sr/86Sr
ratio drops down to 0.704. Mechanisms that can raise the Cl concen-tration in interstitial waters are the dissolution of evaporites, ultrafil-tration and the uptake of water in secondary minerals, or formation
802A
5969 m 520Cl
(mmol) 560 600 640 0SO
4 (mmol) 10 20 30 40 0.2Alk
(meq) 0.6 1 1.4 320Na
(mmol) 400 480 0Ca-Mg
(mmol) 50 100 150 0K
(mmol) 4 8 12 II; IV ^Figure 4. Distribution with depth of chloride, sulfate, alkalinity, sodium, calcium, magnesium, potassium, pH, silica, manganese, boron, and lithium in pore fluids at Site 802.
of gas hydrates. The parallel evolution of the other ions, the Sr isotope ratios, the volcanic nature of the primary material, and the secondary paragenesis rich in smectites and zeolites clearly indicate that altera-tion of volcanic ash into secondary hydrous minerals is the process that enhances the Cl content by water uptake. Analogously high Cl and Ca concentrations recently found at Sites 792 and 793 has been attributed to alteration reactions in the volcaniclastic sediments (Ege-berg et al., 1990a).
Concentrations reach high and low extremes at 80-100 mbsf and reversed evolution are observed below this level, just below the Miocene tuffs. This implies that significant diagenetic reactions are only active in the tuff between 50 and 100 mbsf. Below the tuff, most concentration profiles are constant and similar to what is observed in volcaniclastic units at Sites 800 and 801. The fact that the 87Sr/86Sr
ratios of the interstitial waters and the leachate fraction (mainly carbonates) in volcaniclastic Unit V are similar, and that the values are lower than that of contemporaneous seawater (Fig. 5), imply an equilibrium of carbonates with altered pore waters.
Closed System Evolution?
In the 40 to 80 mbsf interval, the concentration gradients are extremely high, up to 2.3 mmol/m for Ca and Cl (Fig. 4). The existence of high gradients in 10- to 15-m.y.-old sediments implies either (1) that reactions are going on rapidly now (but there is no reason why alteration should have started only recently) or (2) that the tuffs rapidly become a "closed system" because of the high accumulation rate and high cementation of the sediments, which limit diffusive transport. Overall sedimentation rates in the Miocene tuffs are at least 25 m/m.y. ("Site 802" chapter, Lancelot, Larson, et al., 1990) which is not especially high. However, the type of deposit, mass flows intercalated by pelagic intervals (Cores 129-802A-13R and -19R), suggests that accumulation rates were higher between pelagic deposition periods. No downhole measurements are available for evaluating diffusion properties in the upper 100 mbsf. Nevertheless, between 100 and 140 mbsf resistivities are highly variable between 2 and 200 ohm-m at
121-124 mbsf ("Site 802" chapter, Lancelot, Larson, et al., 1990). These high resistivity levels correspond to intervals of coarse sandy tuff well cemented by silicates. At the same level, sonic velocities reach 4 km/s. This is much higher than the mean for all sandstone and tuff samples collected during Leg 129 (2.5 to 2.8 km/s; Fisher et al., this volume) and also indicates a high degree of cementation. Intervals with a low diffusion constant are therefore likely in the upper part of the unit because a similar lithology is present.
Alteration Budget
Following Egeberg et al. (1990a) it is possible to estimate the degree of alteration of the sediment from the Cl increase, assuming that Cl is not incorporated in the minerals and that the system is closed. Such a crude estimate depends on (1) the water content of the secondary phases (assumed to be between 20 and 26 wt% for a mixture of smectite and zeolites) and (2) the initial porosity. This last parameter is related to the degree of alteration and to the final porosity. The shipboard measurements of the sediment water content between 25 and 235 mbsf is 22 to 59 wt% (average = 32 wt%). These data overestimate the real interstitial water content because all or part of the interlayer water of smectites and the channel water of zeolites is included in the measure. If smectites and zeolites represent about 20 wt% of the solids, the overestimate may reach 5 wt% of the sediment. A reasonable value for average interstitial water content is, therefore, 28 wt% and the upper limit is 40 wt%. Figure 8 shows the relation between the degree of alteration and the Cl content of the interstitial water for interstitial water contents at 25 and 40 wt% and water contents in the secondary minerals of 20 and 26 wt%. Taking into account the large uncertainties, an increase of 85 mmol of the Cl content could be achieved by the alteration of 20 to 50 wt% of the solids, with the most plausible values at about 20 wt%. This is consistent with the shipboard core descriptions, which estimate the proportion of smectite, zeolite, and calcite at 20% of the tuffs. This estimate represents the average alteration of Unit II, but at a specific level secondary minerals may represent anywhere from 5% to 95%
802A
5969 m
PH
9 0
Si Mn B Li
(µmol) (µmol) (µmol) (µmol) 300 600 900 0 10 20 30 40 50 0 200 400 600 5 10 15 20 25 30 T3 ε 300 II, I I Volcaniclastic L . . . » I turt>kMβs 559.8-Figure 4 (continued).of the sediment. For instance, at 83 mbsf only magnetite is visible by XRD determination and basaltic glass is certainly higher than 80% (Table 2). The consistency of the calculated degree of alteration and the observed proportion of altered minerals supports the hypothesis that Unit II behaves like a nearly closed system and that the water/rock ratio remains very low. The conditions for such a sedimentary system are high accumulation rates and low diffusion properties.
The upper part of Unit II (<HO mbsf) is depleted in Sr compared with the curve for basalt dissolution (Fig. 6). This may be due to lower
concentration of Sr in Miocene seawater and/or of the 87Sr/86Sr ratio
of volcanic matter. For a system with considerable volcanic
contribu-tion, the 87Sr/86Sr ratio of volcanic matter is very important. In the
absence of direct measurement of the source, it has been fixed at 0.7035. This is already a little lower than the value of 0.7038 measured for the silicate fraction of Sample 129-802A-10R-2, 140-150 cm (83 mbsf), where fresh basaltic glass is dominant. Therefore, if the initial Sr concentration was similar to that of modern seawater, the low Sr content at 83 and 109 mbsf implies that Sr is incorporated in secondary phases. The phases that take up Sr in the unit are probably smectite and carbonate. At 109 mbsf the whole-rock Sr concentration is very high (1484 ppm); however, the phase(s) that contains Sr has not been identified. Below 110 mbsf, the volcanic contribution starts to decrease and the Sr content continues to increase (Fig. 6). This is consistent with
the progressive increase of the CaCO3 content of the sediment with
depth in Subunit IIB and Unit III (Fig. 5). Nevertheless, even at 286
mbsf in almost pure chalk, the interstitial water is still depleted in 87Sr
compared with the marine composition of the carbonates.
In systems of slowly accumulating sediments, Ca is removed from the sediment and Mg is continuously added from seawater as an effect of diffusional exchange (e.g., Perry et al., 1976). For the same reason,
H2O uptake in hydrous minerals is not visible and the Cl content of
the fluid does not change significantly. The low water/rock ratio estimated for the alteration of the tuffs implies some chemical and mineralogical consequences for the evolution of the system. The pH value increases with depth (7.8 to 9.0), similar to those described in basalt dissolution experiment at 0°C are also observed (Crovisier, 1989). The alteration of about 20 wt% of the initial basaltic glass
should deliver 2000 to 4000 mmol of Ca to the interstitial fluid. Calcium is reprecipitated in situ in phillipsite, clinoptilolite, and calcite (Karpoff et al., this volume), but the average Ca content of the sediment is 7 wt% (on dry total), which implies a significant extrac-tion of calcium if the initial glass concentraextrac-tion was 10-12 wt%. Part of this loss corresponds to Ca incorporated in fracture fillings, which are abundant between 50 and 150 mbsf and contain mainly a strange Ca-rich mineral named thaumasite (Karpoff et al., this volume).
Thaumasite is also demonstrated to be the dominant sink for SO4 on
the basis of δ34S of interstitial water (Alt and Burdett, this volume).
Another consequence of the low water/rock ratio should be low Mg enrichment. Mg/Al molar ratios are between 0.9 and 1.1 in the 83-179 mbsf interval (pelagic clay excepted) compared with 0.94 to 1.9 in the volcaniclastic sediments of Sites 800 and 801.
CONCLUSIONS
Studies of the chemistry and Sr isotope composition of interstitial water at Sites 800, 801, and 802 have revealed patterns related to the alteration of volcanic matter under conditions in which diffusive exchange with seawater is low. At Sites 800 and 801 and in volcani-clastic turbidites at Site 802 (Unit V), diagenetic reactions are limited and no Cl increase is observed. At Site 802, the alteration of the Miocene tuffs induces water uptake in secondary minerals and a subsequent Cl rise. The composition of the volcanic sediment is roughly similar at the three sites; however, Site 802 shows some distinctive characteristics: lower temperature, high cementation, probably high accumulation rates, and younger age (Miocene for Site 802 and middle to Late Cretaceous for the volcaniclastic tur-bidites at Sites 801,801, and 802). Both high accumulation rates and cementation favor a "closed system" alteration of the tuff since the deposition of the sediment. In contrast, at Sites 800 and 801, prior to the development of chert sequences that sealed the system, no low-diffusion layer are present, and a low accumulation rate favored the high water/rock ratio alteration of the volcaniclastic sediment. This suggests that the volcaniclastic material at Sites 800 and 801 becomes almost "inert" compared with the Miocene tuffs at Site 802.
The ages of the deposits are also an important factor in diffusion processes and it is possible that the gradients presently observed in the Miocene tuffs will be smoothed in 100 m.y., which is the age difference between the Miocene tuffs at Site 802 and the turbidites at Site 800.
ACKNOWLEDGMENTS
Support for research was provided by a grant from CNRS ASP "Soutien ODP-France." "Un grand merci" to Valerie Clark and Scott Chaffey in the chemistry lab of the JOIDES Resolution, Danielle Dautel, and Luc Marin for chemical help, Louis Derry for "frenglish" deciphering and various scientific discussions, and Peter Vrolijk, Andy Fisher, and an anonymous reviewer for constructive comments. This is CRPG contribution no. 887.
REFERENCES
Alibert, C , Michard, A., and Albarede, F., 1983. The transition from alkali basalts to kimberlites: isotope and trace element evidence from melilites. Contrib. Mineral. Petrol, 82:176-186.
Bird, P., 1984. Hydration-phase diagrams and friction of montmorillonite under laboratory and geologic conditions, with implications for shale compaction, slope stability, and strength of fault gouge. Tectonophysics, 107:235-260.
Blanc, G., and ODP 135 Shipboard Scientific Party, 1991. Hydrogeochemistry of the Lau backarc basin and the Tonga forearc basin, ODP 135. Terra Abstract, 3:466.
Burst, J. F., 1976. Argillaceous sediment dewatering. Annu. Rev. Earth Planet. Sci., 4:293-318.
Clauer, N., Hoffert, M., Grimaud, D., and Millot, G., 1975. Compositions isotopiques du Sr d'eaux interstitielles extraites de sediments récents: un argument en faveur de 1'homogénéisation isotopique des minéraux ar-gileux. Geochim. Cosmochim. Acta, 39:1579-1582.
Clauer, N., Hoffert, M., and Karpoff, A. M., 1975. The Rb-Sr isotope system as an index of origin and diagenetic evolution of southern Pacific red clays. Geochim. Cosmochim. Acta, 46:2659-2664.
Collot, J.-Y., Greene, H. G., Stokking, L. B., et al., 1992. Proc. ODP, Init. Repts., 134: College Station, TX (Ocean Drilling Program).
Crovisier, J. L., 1989. Dissolution des verres basaltiques dans l'eau douce: essai de modélisation [These de Doctorat]. Univ. Louis Pasteur, Strasbourg. Crovisier, J. L., Honnorez, J., and Eberhart, J. P., 1987. Dissolution of basaltic
glass in seawater: mechanism and rate. Geochim. Cosmochim. Acta, 51:2977-2990.
Dunoyer de Segonzac, G., 1970. The transformation of clay minerals during diagenesis and low-grade metamorphism: a review. Sedimentology,
15:281-346.
Egeberg, P. K., Aagaard, P., and Craig Smalley, P., 1990a. Major element and oxygen isotope studies of interstitial waters: ODP Leg 113./«Barker,P. F., Kennett, J. P., et al., Proc. ODP, Sci. Results, 113: College Station, TX (Ocean Drilling Program), 135-146.
Egeberg, P. K., and the Leg 126 Shipboard Scientific Party, 1990b. Unusual composition of pore water found in the Izu-Bonin fore-arc sedimentary basin. Nature, 344:215-218.
Gieskes, J. M., 1976. Interstitial water studies, Leg 33. In Schlanger, S. O., Jackson, E. D., et al., Init. Repts. DSDP, 33: Washington (U.S. Govt. Printing Office), 563-570.
Gieskes, J. M., and Johnson, J., 1981. Interstitial water studies, Leg 61. In Larson, R. L., and Schlanger, S. O., Init. Repts. DSDP, 61: Washington (U.S. Govt. Printing Office), 603-605.
Gieskes, J. M., Vrolijk, P., and Blanc, G., 1990. Hydrogeochemistry of the Northern Barbados Accretionary Complex transect: Ocean Drilling Project Leg 110. J. Geophys. Res., 95:8809-8818.
Gislason, S. R., and Eugster, H. P., 1987. Meteoric water-basalt interaction I: a laboratory study. Geochim. Cosmochim. Acta, 51:2827-2840. Hanshaw, B. B., and Coplen, T. B., 1973. Ultrafiltration by a compacted clayey
membrane. II: Sodium ion exclusion at various ionic strengths. Geochim. Cosmochim. Acta, 37:2311-2327.
Hawkesworth, C. J., and Elderfield, H., 1978. The strontium isotopic compo-sition of interstitial waters from Sites 245 and 336 of the Deep Sea Drilling Project. Earth Planet. Sci. Lett, 40:423^32.
Hoffert, M., Karpoff, A.-M., Clauer, N., Schaaf, A., Courtois, C , and Pautot, G., 1978. Néoformations et alterations dans trois facies volcanosédimen-taires du Pacific Sud. Oceanol. Acta, 1:187-202.
Holland, H. D., 1978. The Chemical Evolution of the Atmosphere and Oceans: Princeton, NJ (Princeton Univ. Press).
Kastner, M., and Gieskes, J. M., 1976. Interstitial water profiles and sites of diagenetic reactions, Leg 35, DSDP, Bellinghausen abyssal plain. Earth Planet. Sci. Lett., 33:11-20.
Koepnick, R. B., Burke, W. H., Denison, R. E., Hetherington, E. A., Nelson, H. F., Otto, J. B., and Waite, L. E., 1985. Construction of the seawater
87Sr/86Sr curve for the Cenozoic and Cretaceous: supporting data. Chem.
Geol. (hot. Geosci. Sect.), 58:55-81.
Koepnick, R. B., Denison, R. E., Burke, W. H., Hetherington, E. A., and Dahl, D. A., 1990. Construction of the Triassic and Jurassic portion of the Phanerozoic curve of seawater 87Sr/86Sr. Chem. Geol. (hot. Geosci. Sect.),
80:327-349.
Lancelot Y., Larson, R. L., et al., 1990. Proc. ODP, Init. Repts., 129: College Station, TX (Ocean Drilling Program).
Lawrence, J. R., and Gieskes, J. M., 1981. Constraints on water transport and alteration in the oceanic crust from the isotopic composition of pore water. J. Geophys. Res., 86:7924-7934.
Ludden, J. N., Gradstein, F. M., et al., Proc. ODP, Init. Repts., 123: College Station, TX (Ocean Drilling Program).
Manheim, F. T, and Sayles, F. L., 1974. Composition of interstitial waters of sediments, based on deep-sea drill cores. In Goldberg, E. D. (Ed.), The Sea (Vol. 5): New York (Wiley), 527-568.
McDuff, E., 1981. Major cation gradients in DSDP interstitial water: the role of diffusive exchange between seawater and upper oceanic crust. Geochim. Cosmochim. Acta, 34:105-120.
McDuff, E., and Gieskes, J. M., 1976. Calcium and magnesium profiles in DSDP interstitial waters: diffusion or reaction? Earth Planet. Sci. Lett., 33:1-10. Mottl, M. J., and Gieskes, J. M., 1990. Chemistry of water sampled from
Oceanic Basement Borehole, 1979-1988./ Geophys. Res., 95:9327-9342. Muelenbach, K., 1980. The alteration and aging of the basaltic layer of the sea
floor: oxygen isotope evidence from DSDP/IPOD Legs 51, 52, and 53. In Donnelly, T, Francheteau, J., Bryan, W., Robinson, W., Flower, M., Salisbury, M., et al., Init. Repts. DSDP, 51,52,53: Washington (U.S. Govt. Printing Office), 1159-1167.
, 1986. Alteration of the oceanic crust and the 18O history of
seawater. In Valley, J. W, Taylor, H. P., and O'Neil, J. R., Stable Isotope in High Temperature Geological Processes. Mineral. Soc. Am., Rev. in Mineral. Ser., 16:425^144.
Newman, A.C.D., 1987. The interaction of water with clay mineral surfaces. In Newman, A.C.D. (Ed.), Chemistry of Clays and Clay Mineral (Vol. 5): London (Longman Scientific and Technical), 237-274.
Odum, H. T, 1951. Notes on the strontium content of seawater, celestite, radiolaria, and strontianite snail shells. Science, 114:211.
Parson, L , Hawkins, J., Allan, J., et al., 1992. Proc. ODP, Init. Repts., 135: College Station, TX (Ocean Drilling Program).
Perry, E. A., Gieskes, J. M., and Lawrence, J. R., 1976. Mg, Ca and O18/O16
exchange in the sediment-pore water system, Hole 149, DSDP. Geochim. Cosmochim. Acta, 40:413^123.
Sayles, F. L., and Manheim, F. T, 1975. Interstitial solutions and diagenesis in deeply buried marine sediments: results from the Deep Sea Drilling Project. Geochim. Cosmochim. Acta, 39:103-127.
Smith, W.H.F., Staudigel, H., Watts, A. B., and Pringle, M. S., 1989. The Magellan Seamounts: Early Cretaceous record of the South Pacific iso-topic and thermal anomaly. J. Geophys. Res., 94:10501-10523. Tribble, J. S., 1990. Clay diagenesis in the Barbados Accretionary Complex:
potential impact on hydrology and subduction dynamics. In Moore, J. C , Mascle, A., et al., Proc. ODP, Sci. Results, 110: College Station, TX (Ocean Drilling Program), 97-110.
Vrolijk, P., Fisher, A., and Gieskes, J., 1991. Geochemical and geothermal evidence for fluid migration in the Barbados accretionary prism (ODP Leg 110). Geophys. Res. Lett., 18:947-950.
Date of initial receipt: 3 June 1991 Date of acceptance: 6 January 1992 Ms 129B-124
802A
5969 m 87Sr/
8 6Sr
0.704CaCO
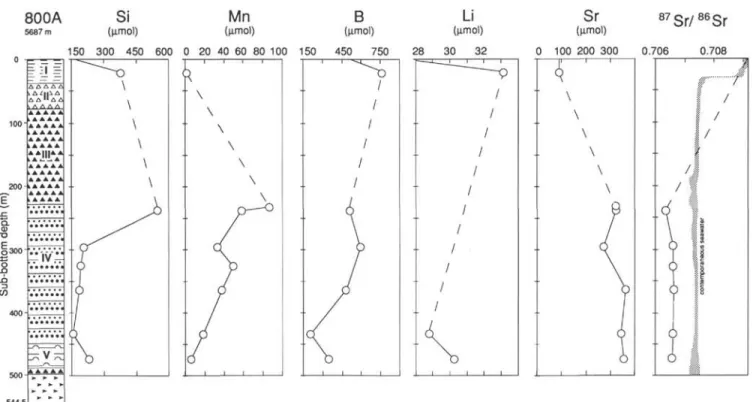
3 (wt % solid) 40 60 80 500 559.8 • O Interstitial-water Solid sed. teachable • Solid sed. residueFigure 5. Site 802 distribution with depth of 87Sr/86Sr in pore fluids and in solid sediments, Sr in pore fluids, and CaCO3 in solid sediment. Data are from Tables
1, 4, and 5 and Lancelot, Larson, et al. (1990). The contemporaneous seawater curve for Sr isotope ratio is drawn after Koepnick et al. (1985). Lithologic legend in Figure 4. Open symbols on the CaCO3 plot are for the solid residue of interstitial water samples.
Table 2. Lithologic description and X-ray determination of major minerals of interstitial water sample sediment. Core, section,
interval (cm)
Deptha
(mbsf) Rock type Quartz Philipsite Clinoptilolite Analcime Calcite Smectite
Volcanic minerals Others 129-800 A-4R-2, 25-30 26R-2, 140-148 27R-1, 140-150 33R-6, 60-70 37R-2, 0-10 41R-2, 0-10 49R-2, 140-150 54R-2, 0-12 129-801A-3R-2, 145-150 5R-3, 145-150 19R-1,65-73 129-801B-5R-2, 0-10 8R-3, 115-125 33R-1, 143-150 35R-2, 0-10 129-802 A-4R-1, 140-150 6R-2, 0-10 10R-2, 140-150 13R-1, 53-58 19R-2, 107-117 21R-1, 103-110 26R-1,0-10 29R-3, 29-34 32R-2, 140-150 36R-1,80-88 40R-2, 140-150 43R-1, 140-150 47R-2, 140-150 50R-2, 140-150 53R-1, 120-130 56R-2, 140-150 22 232 239 296 327 364 434 473 15 36 167 225 257 436 446 26 44 83 109 162 179 225 258 286 322 361 384 422 450 471 500
Pelagic brown clay Volcaniclastic turbidite Volcaniclastic turbidite Volcaniclastic claystone Volcaniclastic claystone Volcaniclastic sandstone Volcaniclastic siltstone Clayey radiolarite
Pelagic brown clay Pelagic brown clay Siliceous silty claystone
Volcaniclastic silty claystone Volcaniclastic silty claystone
Metalliferous red clay Metalliferous red clay
Brown volcanic ash-tuff Black volcanic ash-tuff Black volcanic ash-tuff Pelagic brown clay
Volcanic ash-tuff Claystone Calcareous claystone
Pelagic brown clay Nannofossil chalk Nannofossil chalk Volcaniclastic turbidite Volcaniclastic turbidite Volcaniclastic siltstone Volcaniclastic silty claystone Calcareous volcaniclastic claystone
Volcaniclastic turbidite X XX X — — — xxxxx X o o XX xxxx XXX — — — — — — () X — X — — — XX XX — XX — — — X — — — — — XX X o XXX xxxx XX () — — — — — — — No data XX XX o XXX xxxxx o xxxxx XX XXX X XXX XXX XX XXX o o — o — xxxxx o — — — X o Illite x Celadonite xx — Hematite o Illite o Opal-CT xxxx Celadonite o Hematite x Hematite x No data — — — X X X X X X X xxxxx — X X o X X X X X X X X X X X X X X — X X X X X X X Chabazite o Opal-CT xx Opal-CT x x Celadonite x x Celadonite o o — Sanidine xxx
Note: Qualitative estimates of the abundance based on peak height: xxxxx >90%, x 5%, o = detected, — = not detected.
aDepth rounded to the nearest meter.
Table 3. Major element composition of solid sediment (squeeze cake) in interstitial water samples. Core, section, interval (cm) 129-800A-4R-2, 25-30 26R-2, 140-148 27R-1, 140-150 33R-6, 60-70 37R-2, 0-10 41R-2, 0-10 49R-2, 140-150 54R-2,0-12 129-801A-3R-2, 145-150 5R-3, 145-150 19R-1,65-73 129-801B-5R-2, 0-10 8R-3, 115-125 33R-1, 143-150 35R-2, 0-10 129-802 A-4R-1, 140-150 6R-2, 0-10 10R-2, 140-150 13R-1, 53-58 19R-2, 107-117 21R-1, 103-110 26R-1,0-10 29R-3, 29-34 32R-2, 140-150 36R-1,80-88 40R-2, 140-150 43R-1, 140-150 47R-2, 140-150 50R-2, 140-150 53R-1, 120-130 56R-2, 140-150 Deptha (mbsf) 22 232 239 296 327 364 434 473 15 36 167 225 257 436 446 26 44 83 109 162 179 225 258 286 322 361 384 422 450 471 500 SiO2 (wt%) 49.10 64.72 53.50 45.57 46.56 53.96 43.04 81.18 49.56 54.46 63.62 48.22 56.34 73.10 65.00 40.23 43.65 41.92 48.87 43.67 43.32 37.59 52.71 27.75 6.61 49.53 43.45 49.25 51.34 48.15 55.14 A12O3 (wt%) 14.78 6.35 9.58 10.63 9.26 9.13 8.78 5.09 16.82 15.13 6.76 9.03 8.21 7.28 8.41 9.80 10.50 11.03 11.50 10.16 10.71 9.89 10.96 3.41 1.31 11.60 8.21 9.35 9.48 7.94 11.55 Fe2O3l (wt%) 6.41 6.07 10.03 12.23 10.61 9.23 13.01 3.92 7.34 6.0.4 6.40 9.78 9.42 7.19 11.21 10.35 11.98 12.55 7.69 11.58 11.13 8.60 8.33 1.62 0.58 12.96 8.80 11.10 10.55 5.77 9.07 MnO (wt%) 2.29 0.08 0.15 0.15 0.17 0.11 0.11 0.40 2.15 0.96 0.08 0.14 0.17 0.02 0.08 0.07 0.15 0.17 1.58 0.17 0.15 0.20 2.02 0.45 0.14 0.12 0.16 0.14 0.19 0.07 0.04 MgO (wt%) 3.11 3.17 6.20 8.21 14.66 11.36 12.11 1.45 3.27 2.97 3.67 8.16 6.20 1.67 2.04 8.76 10.73 8.36 3.02 9.73 8.38 4.47 2.88 0.86 0.44 5.19 6.12 11.21 10.19 2.22 4.44 CaO (wt%) 4.45 4.67 6.58 5.01 1.61 2.09 5.83 0.56 1.85 1.75 4.76 5.20 3.37 0.28 0.48 7.76 3.20 5.41 4.19 7.13 6.44 14.98 3.55 33.42 49.04 6.22 11.89 4.39 2.75 15.30 1.28 Na2O (wt%) 1.92 1.82 2.29 1.50 2.52 1.87 1.86 0.77 2.09 2.09 1.97 1.81 2.02 0.93 1.02 3.29 4.91 4.70 2.88 3.72 3.97 2.61 2.70 0.72 0.08 2.45 1.95 2.17 1.56 1.29 K2O (wt%) 3.94 2.49 0.88 4.83 2.18 1.58 0.94 1.41 4.15 4.27 2.16 4.83 2.66 2.29 2.72 2.00 0.86 0.29 1.58 1.04 1.51 1.72 1.63 0.41 0.03 1.64 1.63 0.55 1.04 1.20 7.00 TiO2 (wt%) 0.59 1.12 1.79 1.51 1.52 1.43 1.47 0.32 0.61 0.55 1.36 2.09 1.70 0.51 0.60 2.75 2.77 3.08 0.65 2.47 2.62 1.53 0.51 0.16 0.08 3.18 2.42 2.50 2.50 0.97 0.97 P2O5 (wt%) 2.41 0.20 0.27 0.39 0.27 0.24 0.24 0.20 1.04 0.98 0.26 0.38 0.28 0.15 0.27 0.35 0.36 0.41 0.75 0.32 0.36 0.27 0.83 0.56 0.40 0.44 0.30 0.32 0.27 0.25 0.12 Loss on ignition 11.14 9.07 8.11 10.39 10.13 8.63 12.33 5.01 11.43 10.51 9.24 10.12 9.07 6.15 7.74 14.31 9.33 11.57 16.87 9.74 10.28 17.70 13.63 29.91 40.18 6.37 14.40 8.76 9.62 16.73 8.95 Total (wt%) 100.14 99.76 99.38 100.42 99.49 99.63 99.72 100.31 100.31 99.71 100.28 99.76 99.44 99.57 99.57 99.67 98.44 99.49 99.58 99.73 98.87 99.56 99.75 99.27 98.89 99.70 99.33 99.74 100.09 100.16 99.85
Note: Fe2O3' as total iron. aDepth rounded to the nearest meter.
Table 4. Carbonate content and trace element composition of solid sediment in interstitial water samples. Core, section, interval (cm) 129-800 A-4R-2, 25-30 26R-2, 140-148 27R-1, 140-150 33R-6, 60-70 37R-2, 0-10 41R-2, 0-10 49R-2, 140-150 54R-2, 0-12 129-801A-3R-2, 145-150 5R-3, 145-150 19R-1,65-73 129-801B-5R-2, 0-10 8R-3,115-125 33R-1, 143-150 35R-2, 0-10 129-802A-4R-1, 140-150 6R-2, 0-10 10R-2, 140-150 13R-1, 53-58 19R-2, 107-117 21R-1, 103-110 26R-1,0-10 29R-3, 29-34 32R-2, 140-150 36R-1,80-88 40R-2, 140-150 43R-1, 140-150 47R-2, 140-150 50R-2, 140-150 53R-1, 120-130 56R-2, 140-150 C a C O3 a (wt%) 0.6 5.3 2 8.2 0.7 1.2 0.2 0.2 4.3 4 10 0.7 1.8 0.5 3 2.7 21.8 0.4 53.5 85.4 0.5 13 2.2 1.7 23.2 0.6 B 141 29 31 55 50 38 30 39 147 152 29 39 41 51 75 51 47 26 56 22 28 41 112 37 24 41 35 25 31 41 47 Ba 400 60 81 61 21 18 o 745 392 310 211 50 112 214 178 84 61 54 229 114 94 261 886 454 442 108 68 47 185 118 <5 C 256 15 37 32 32 41 43 11 209 101 10 26 37 523 627 64 51 66 167 48 60 58 75 21 7 27 3 33 52 28 45 Cr 51 122 482 374 586 623 791 22 63 53 188 465 233 60 50 597 648 550 45 694 487 260 31 15 12 313 470 526 767 110 161 Cu 385 79 113 82 97 111 25 70 285 261 67 88 54 77 83 110 123 134 322 103 112 69 332 88 48 140 114 134 122 53 119 Ni 581 46 184 167 276 265 276 39 481 261 49 167 124 71 101 66.4 298 252 259 328 280 156 81 67 17 119 209 223 230 96 93 Rb 86 36 18 48 46 31 17 44 121 101 32 67 39 73 85 29 12 7 29 14 19 27 30 16 13 28 26 9 14 24 78 Sr 269 493 362 105 107 134 124 69 168 169 310 189 199 79 84 97 123 308 1484 127 158 414 780 676 494 391 303 236 294 346 53 Tb 13 <5 <5 <5 <5 <5 <5 <5 15 6 <5 6 <5 <5 <5 <5 <5 <5 5 <5 <5 <5 5 13 16 6 <5 <5 <5 5 <5 V 127 101 168 165 98 169 268 42 119 100 110 174 136 89 138 258 281 295 67 258 216 204 126 19 7 274 231 257 285 91 237 Y 503 10 17 22 12 12 15 10 243 154 13 17 12 6 16 26 27 29 122 24 23 24 138 76 52 29 19 19 15 23 4 Zn 201 50 83 74 86 77 70 82 173 153 67 75 71 75 101 82 98 101 137 93 93 76 157 56 17 141 85 96 85 79 70 Zr 154 78 127 117 111 106 100 54 151 130 114 173 126 93 108 182 183 203 124 161 169 101 113 31 13 204 162 166 184 109 47
Notes: All analyses are in parts per million (ppm) except for CaCO3, which is in weight percentage (wt%).
aShipboard analyses (Lancelot, Larson, et al., 1990).
Table 5.87Sr/86Sr in solid sediments for the teachable fraction (carbonates) and the silicate residue.
Core, section, interval (cm) 129-802 A-10R-2, 140-150 13R-1, 53-58 36R-2, 80-88 40R-2, 140-150 43R-1, 140-150 47R-2, 140-150 53R-1, 120-130 Silicate residue 8 7Sr/8 6Sr 0.703832+ 17 0.704380+ 37 0.704487 ± 14 0.705158 ± 27 0.704541 ± 27 0.707043+ 21 Sr (ppm) 49 1093 292 217 121 227 Leachate 87Sr/86Sr 0.704219+ 31 0.704458 ± 29 0.707668 ± 23 0.706747 ± 23 0.707050+ 21 0.706931 ± 17 0.707336 ± 34 Sr (ppm) 658 2452 457 347 202 267 403 280
26 A
O
π
§ 44 Δ / / 800 801 /i
Δ 802 Miocene tuffs A 802 OtherΔ Δ
109 ** -r•T : 162 225 Δ" 90 80 70 ü 6 0 ^~ 50 CO-§ 40
>
K 30 20 10 0 100 200 I 300 400Sr (µmol)
Figure 6. Sr content of interstitial water samples of the three sites vs. the fraction of volcanic Sr calculated from the Sr isotope ratio of pore water, contemporaneous seawater, and volcanic matter (see text). The vertical error bar corresponds to the uncertainty of the 87Sr/86Sr ratio of contemporaneous seawater. The curve
corre-sponds to a dissolution of basalt in interstitial water. 87Sr/86Sr of volcanic matter
has been taken at 0.7035, as it corresponds to average 87Sr/86Sr ratio of Cretaceous
volcanism in the area (e.g., Smith et al., 1989; Castillo et al., this volume). Addition of biogenic Sr is necessary to explain the samples in which Sr is higher than expected for a given value of/vojcanic. The numbers with the Miocene tuff symbols (802) indicate the sub-bottom depth.
Cl content: 560 530 mmol
15 20 25 30 35 40
Final pore-water content (wt%)
45
Figure 7. Estimate of interlayer-water dewatering for a 5.4% freshening of the pore water (560 —> 530 mmol Cl) as a function of the final pore-water content of the sediment and the final interlayer water content of the smectite in a 90% smectite sediment. Interlayer-water dewatering corresponds to (1 - /fmai//jnitiai) • 100- Points
at 327 and 364 mbsf correspond to Samples 129-800A-37R-2, 0-10 cm, and 129-800A-41R-2, 0-10 cm, respectively, for which estimates of the pore-water content have been made from bulk water content measurements (France-Lanord and Sheppard, this volume).
900
800
o
E
5
O
700
600
500
in secondary phases
20 wt%
26 wt%
0
0.2
0.4
0.6
Secondary phases /
α/
Q\
Solid sediment
v y yFigure 8. Chlorine increase by water uptake during alteration of a volcaniclastic sediment in a closed system. The initial fluid is seawater with 545 mmol Cl. The two line groups correspond to 25 and 40 wt% final water content in the sediment. Secondary phases contain 20 and 26 wt% of total water, which correspond to 0.25 and 0.35 g/g of water sorbed. The fraction of altered mineral is expressed as dry weight.