HAL Id: hal-01226818
https://hal-brgm.archives-ouvertes.fr/hal-01226818
Submitted on 10 Nov 2015
HAL is a multi-disciplinary open access
archive for the deposit and dissemination of
sci-entific research documents, whether they are
pub-lished or not. The documents may come from
teaching and research institutions in France or
abroad, or from public or private research centers.
L’archive ouverte pluridisciplinaire HAL, est
destinée au dépôt et à la diffusion de documents
scientifiques de niveau recherche, publiés ou non,
émanant des établissements d’enseignement et de
recherche français ou étrangers, des laboratoires
publics ou privés.
geometric structure of the sub-surface: an example in
Argostoli, Greece
Afifa Imtiaz, Cécile Cornou, Pierre-Yves Bard, Aspasia Zerva
To cite this version:
Afifa Imtiaz, Cécile Cornou, Pierre-Yves Bard, Aspasia Zerva. Spatial coherence of seismic ground
motion and geometric structure of the sub-surface: an example in Argostoli, Greece. 9ème Colloque
National AFPS 2015, IFSTTAR, Nov 2015, Marne-La-Vallée, France. �hal-01226818�
9ème Colloque National AFPS 2015 – IFSTTAR
Cohérence spatiale des mouvements sismiques et structure
géométrique du proche sous-sol: un exemple à Argostoli,
Grèce
Spatial coherence of seismic ground motion and geometric
structure of the sub-surface: an example in Argostoli, Greece
Afifa Imtiaz*,** — Cécile Cornou* — Pierre-Yves Bard* — Aspasia Zerva***
* Université de Grenoble, ISTerre / IRD / IFSTTAR, BP 53, 38041 Grenoble, [email protected] **Bureau de recherches géologiques et minières (BRGM), [email protected]
*** Drexel University, Philapdelphia, PA, USA
RÉSUMÉ. La variabilité spatiale des mouvements sismiques sur de courtes distances peut affecter significativement la réponse dynamique des structures de génie civil de grande taille, en particulier quand elles sont fondées sur des sites latéralement hétérogènes. Elle est souvent prise en compte au travers de fonctions empiriques – peu calibrées et peu extrapolables d’un site à l’autre - décrivant la perte de cohérenceen fonction de la fréquence et la distance. Dans le but d'améliorer la compréhension de la structure de la cohérence et son lien avec les caractéristiques géométriques et mécaniques du sous-sol, un réseau sismologique très dense a été installé dans la région sismiquement très active d'Argostoli-Koutavos (Céphalonie, Grèce). Constitué de 21 vélocimètres déployés sur 4 cercles concentriques de rayons 5, 15, 40 et 80 m autour d'une station centrale au sein d'une vallée de petite taille (épaisseur ~50 m, largeur 1.5 km), ce réseau a enregistré plusieurs centaines d'événements sur la période septembre 2011-avril 2012. Un sous ensemble de 46 événements présentant une distribution homogène en termes de distance épicentrale (0-200 km), back-azimut (0-360°) et magnitude (2 à 5) a été sélectionné pour une analyse systématique de la cohérence observée sur la phase forte comprenant l’onde S de toutes les paires de stations. Les résultats indiquent une absence de dépendance claire de la cohérence moyenne en fonction de la magnitude, du back-azimut de la source, et de la distance hypocentrale, ainsi qu'une grande robustesse vis-à-vis de la fenêtre de signal choisie, pour peu qu'elle contienne la phase S énergétique. Le résultat le plus marquant concerne le contrôle par la géométrie du site : la cohérence est systématiquement plus forte pour les paires alignées parallèlement à l'axe de la vallée (2D), et minimale pour celles alignées selon la direction perpendiculaire. Ce résultat est cohérent avec la constitution du champ d'ondes dans la vallée dominé par des ondes de surface se propageant d'un bord à l'autre de la vallée. Les cohérences observées ne sont par ailleurs que très partiellement expliquées par les modèles existants.
ABSTRACT. The spatial variation of the earthquake ground motion over short distances can significantly affect the dynamic response of large and extended engineered structures, particularly when they are located at sites with lateral heterogeneity. In current practices, it is taken into account in terms of coherency, as a function of frequency and distance, established on an essentially empirical basis, making it difficult to extrapolate at different sites. Hence, in order to improve our understanding of the physical significance of coherency and its relationship to the geometrical and mechanical characteristics of the ground structure, a very dense network was installed in seismically active region of Argostoli-Koutavos (Cephalonia, Greece). Consisting of 21 velocimeters deployed on four concentric circles of radii 5, 15, 40 and 80 m around a central station in a small valley (~50 m thickness, width 1.5 km), the array recorded several hundred events in the period from September 2011 to April 2012. A subset of 46 events having a homogeneous distribution in terms of epicentral distance (0-200 km), back-azimuth (0-360 °) and magnitude (2 to 5) has been selected for a systematic analysis of the coherency of all station pairs observed on ‘the most energetic phase’ containing the S-wave. The results indicate a lack of a clear dependence of the average coherency on the magnitude, back-azimuth or site-to-source distance of the event, and on the length of chosen signal window provided that it contains the same S-phase energy. The most striking result concerns the influence of the site geometry; the coherency is systematically higher for the pairs aligned parallel to the axis of the valley (2D), and lower for those aligned in the perpendicular direction. This result is consistent with the formation of the wavefield in the valley, dominated by surface waves propagating from one edge to the other. The observed coherency estimates are, however, weakly represented by the existing parametric models.
MOTS-CLÉS: variabilité spatiale, réseau dense, cohérence, champ d'ondes.
1. Introduction
The observed difference in amplitude and phase of seismic ground motions, measured at different locations within a short distance is termed as spatial variation of earthquake ground motions (SVEGM). The importance of SVEGM has been recognized for a long time in earthquake-resistant design and analysis of large and extended structures (see Zerva and Zervas, 2002 for a review). Usually, the spatial variation is attributed to the wave passage, spatial incoherence, and site effects. In order to represent spatial incoherency, the variation in waveform between two ground-motions is generally characterized by the complex valued coherency function. Up to date, ground-motion records from few dense seismic arrays installed at various sites around the world have been analyzed and a large number of empirical coherency functions have been developed (Harichandran and Vanmarcke, 1986; Abrahamson, 1991; Ancheta et al., 2011). However, most of these arrays are located at uniform ground conditions, frequently at soil sites, and, generally, the smallest station separation distance is larger (> 100 m) than the dimensions of most engineered structures. The majority of the studies utilized a stochastic approach to model the spatial variation from the strong-motion shear (S-) wave window. In spite of this fact, it is difficult to compare results from different datasets because of the difference in experimental setups, site conditions, source mechanisms, and spectral estimation procedures adopted. Some researchers introduced analytical or semi-empirical models by combining analytical consideration with the parameter evaluation from real data (e.g. Luco and Wong, 1986; Zerva et al., 1987; Der Kiureghian, 1996; Zerva and Harada, 1997), but these models may not capture the reality because of the simplified assumptions they are based on.
The geological complexity of a site was also observed to have significant effects on the lagged coherency (Schneider et al., 1992). It is well known that engineering structures often cross sites with irregular subsurface topography and ground types. Such sites give rise to the formation of surface waves, especially the ones diffracted by the basin edges, that can lead to large amplifications, loss of correlation and significant ground strains in the wave-field (e.g. Bard and Bouchon, 1980; Moczo and Bard, 1993; Cornou et al., 2003; Scandella and Paolucci, 2010). These short-period surface waves appear early in the seismogram and get mixed with the direct S-wave train, making the effect of spatial incoherence even more complex. A recent study (Zerva and Stephenson, 2011) also highlighted the significance of irregular subsurface topography and formation of surface waves in the physical understanding and modelling of the spatial variation of seismic ground motions.
One of the main goals of the present work is, then, to analyze the variability of ground motion over short distances in connection to the shallow underground structure at the site. The dense seismic array installed in Argostoli basin, as a part of the NERA project (Network of European Research Infrastructures for Earthquake Risk Assessment and Mitigation, European Community’s Seventh Framework Program, project # 262330, 2010-2014, www.nera-eu.org), gives us the opportunity to study the loss of coherency over a rather wide range of station separation distances, namely from 5 to 160 m, from a large number of local and regional earthquakes. Lagged coherency of the most energetic part of the ground motion, beginning from S-wave onset, has been quantified for each possible pair within the array. This article summarizes a comprehensive investigation on the sensitivity of the coherency to various potentially impacting factors including source (magnitude, distance, back-azimuth) and site (orientation of the horizontal components and the station pairs) signatures.
2. Site, array and the dataset
The dataset used in this study have been recorded by a dense seismic array, Array A, deployed at the Koutavos-Argostoli of Cephalonia Island, Greece, during a dedicated NERA seismological experiment taking place from September 2011 to April 2012. Argostoli is located in the north-westernmost boundary of the Aegean plate, tectonically one of the most active regions in Europe. A major right-lateral strike-slip fault system in the west of the Island, known as Cephalonia Transform Fault (CTF), dominates the seismicity of the area. Koutavos-Argostoli is a relatively small alluvium valley situated in the eastern part of the Gulf of Koutavos-Argostoli. Existing literature demonstrates that the valley is about 3 km long and 1.5 km wide, surrounded by hills of limestone and
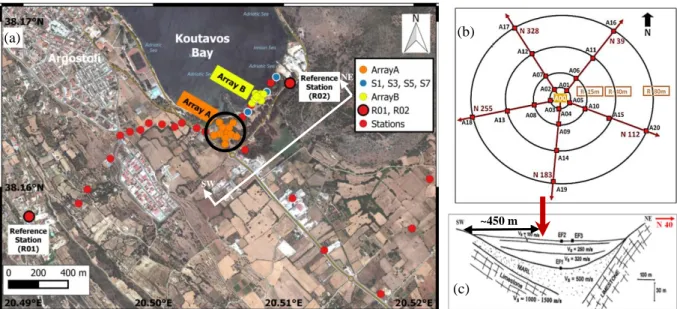
marl, and covered by soft Neogene sediments up to an estimated depth of 40-50 m (Protopapa et al., 1998). The available description of the valley is very preliminary and further studies are being carried out for a better characterization (Cultrera et al., 2014; Boxberger et al., 2014; Hollender et al., 2015). The location of Array A within the experimental setup and its configuration are shown in Figure 1 (a) and (b), respectively. The array consists of 21 broadband velocimeters, positioned in four concentric circles, with radii 5, 15, 40 and 80 m, around the central station A00. The stations branch off from A00 in five directions, N 39, N 112, N 183, N 255 and N 328. The NE-SW cross-section of the valley, proposed by Protopapa et al. (1998), is presented in Figure
1 (c). An updated version of the cross-section may be found in Hollender et al. (2015).
Figure 1. (a) Location and (b) layout of Array A in the seismological experiment at Argostoli. (c) 2D model of
the SW-NE cross-section of the Argostoli valley (Protopapa et al., 1998). The red arrow points out the location of Array A.
Figure 2. (a) Location of the selected events around Argostoli site. The events are plotted on SRTM data-maps,
available from http://srtm.csi.cgiar.org (Jarvis et al., 2008). (b) Duration of the selected time windows, from 46 events, plotted against the respective hypocentral distance. Colorbar represents the magnitude of the events.
~450 m
Site
SW NE (a) (c) (b) (a) (b)The array stations lie on the same geological unit constituted of soft Quaternary sediments and the average fundamental frequency at the location of the array is approximated around 1.5 Hz from the H/V peak frequency estimations (Cultrera et al., 2014). The two reference stations R01 and R02, about 2 km apart from each other, are situated on soft and hard rock sites, respectively. The Array A is located approximately 450 m away from the southwest edge of the valley Figure 1 (c).
This study considers a subset of 46 events from the catalogue of Argostoli data. The events are located within 200 km epicentral distance from A00 station and have local magnitudes between 2 and 5. Most of the events are shallow and they were chosen in such way that a homogeneous distribution of epicentral distance, magnitude and azimuthal coverage can be achieved. Figure 2 (a) shows the location of the selected events.
3. Estimation of coherency
By definition, coherency characterizes the variation in Fourier phase and expresses the loss of correlation between two ground motions, generally as exponentially decaying functions of frequency and station separation distances. The selected signal time segments for the estimation of coherency are assumed to be homogeneous, stationary, and ergodic. The most commonly cited coherency measure is the lagged coherency, estimated after aligning the two time histories by using the time lag that leads to the largest correlation. Thus, this coherency measure is assumed to remove the effects of systematic delay due to the wave-passage effect. The lagged coherency, |γ̅jk(ω)|, of the seismic motion between the stations j and k is given by the modulus of the ratio of the smoothed cross-spectrum of the two time series to the geometric mean of the respective, identically smoothed, auto power spectra:
|γ
̅
jk(ω)|=
|S̅jk(ω)||√S̅jj(ω)S̅kk(ω)|
[1]
As the ground motions recorded at Argostoli valley are composed of a complex mixture of body and surface waves (Imtiaz, 2015), it was difficult to identify a clear S-wave window on the seismogram. Thus, the most energetic segment from the onset of S-wave for each event has been selected from the visual inspection of the recorded signals on the nearby rock stations R01 and R02. Figure 2 (b) shows the distribution of durations of the selected time windows with their corresponding hypocentral distances and magnitudes. Frequency smoothing is an important step in coherency estimation as it introduces the information about the differences in the phases of the motions. It also controls the statistical properties (variance and bias) and resolution of the coherency estimates. Abrahamson et al. (1991) suggests that in order to use coherency in structural analysis, for time windows less than approximately 2000 samples and for structural damping coefficient 5% of critical, an 11-point Hamming window (frequency weight, Mh=5) would be reasonable.
We estimated the lagged coherency from 1 to 25 Hz frequency for the three ground-motion components and each possible combination of pairs in the array (max. 210 pairs). The records from each station were aligned with respect to the central station A00. Since the array has very small radii, no significant time lag is observed among the records. Thus, it can be said that the time windows represent almost absolute timescale and account for the realistic case. The selected segments have been tapered by applying a 5% cosine bell window at each end. The estimated power spectral densities and cross-spectral density have been smoothed by using an 11 point (Mh=5) Hamming window. The frequency smoothing bandwidth can be calculated as,
BW
smoothed=2M
h*
Nfsf [2]
where, fs is the sampling frequency and Nf is the number of frequency points corresponding to the selected
window length. In our analysis, equivalent numbers of smoothing points have been adapted to account for constant smoothing bandwidth for different time window lengths. The value of lagged coherency ranges from 0
to 1 for uncorrelated to linearly correlated processes, respectively. However, the lagged coherency levels down toward a “coherency resolvability threshold” value at higher frequencies due to the bias and variance in the estimation procedure and selection of the smoothing window. The 50% confidence level of this “resolvability threshold” of lagged coherency estimates is 0.33 for the frequency smoothing Mh=5 (Abrahamson, 1992).
4. Results
4.1. Coherency from a single event
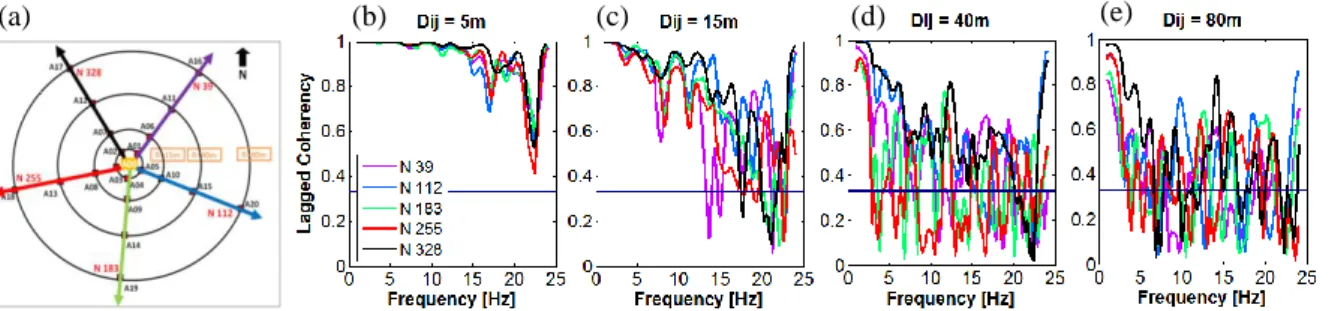
We illustrate the coherency computations on the example of one event, occurred on October 9, 2011 at 18:42:20 UTC (M=3.3, Rhyp=93.3 km, Baz= N 117, S-tw=5.88s). The estimated lagged coherency of the EW
component has been plotted for the pairs located along the five array-branch directions and at four different separation distances (5, 15, 40 and 80 m) in Figure 3. It is evident that the coherency decays with increasing frequency as well as with increasing inter-station distances. As mentioned earlier, coherency values below 0.33 bear no significance in terms of interpretation. At the intermediate separation distances, at 15 m and 40 m, some variations of coherency are observed depending on the direction of the pairs.
Figure 3. (a) Array configuration. (b)-(e) Lagged coherency of the EW component of the event for pairs lying in
5 array-branch directions and at 4 separation distances.
4.2. Statistical analysis
Our main goal is to investigate the dependency of coherency on various site and source parameters on the basis of average values derived from a large and representative set of events. For such an averaging process, the use of normally distributed data is preferable. As discussed by Abrahamson (1992), by using the tanh-1 (or ATANH) transformation, coherency values are observed to be approximately normally distributed about the median tanh-1 curve and, thus, the scatter of coherency becomes independent of frequency (homoscedastic) (Enochson and Goodman, 1965). This is the rationale why it is suggested that the statistical analyses of coherency be performed on the tanh-1|γ̅jk(ω)| instead of the |γ̅jk(ω)| estimate (Harichandran, 1991; Abrahamson
et al., 1991). When the chosen frequency smoothing is a Hamming window with Mh = 5, the bias and standard
deviation of tanh-1|γ̅jk(ω)| are 0.08 and 0.26, respectively (Abrahamson 1992), and the 50% confidence levels for “coherency resolvability threshold” is 0.34.
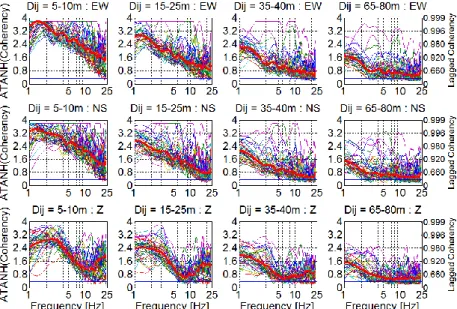
Four interstation distance ranges, 5-10 m, 15-25 m, 35-40 m and 65-80 m, have been chosen to display the results. The coherency estimates of the pairs available for each distance range have been used to derive the ‘individual median’ curve for a single event. The ‘global median’ of all 46 events, at a given interstation distance range, has been derived by combining all pairs available from all events. The residuals for each event have been computed from the difference between ‘individual median’ and ‘global median’. We show in Figure 4 the median estimates, ‘individual’ and ‘global’, of the ATANH lagged coherency from all events at four distances ranges (Dij) and for the three components EW, NS and Z. Note that the ATANH coherency values lower than 0.34 are not interpreted. However, the estimated median curves are observed to be well above the coherency
(b)
resolvability threshold. The two horizontal components show very similar tendencies while the vertical component looks somewhat different. Coherency of the vertical component drops sharply between 0 and 5 Hz and shows an increasing trend after 10 Hz at shorter distances (5-10 m and 15-25 m). This increase at higher frequencies could be attributed to the presence of P-waves in the vertical component even though the selected windows mainly correspond to the S-wave. Since the wavefield is actually very complex, the vertical component may include converted S-P waves or higher harmonics, Rayleigh waves, with large phase velocities. We also observe that the medians of the individual events, with respect to the global median, are highly variable over all distance ranges. This indicates the importance of providing the variability around the global average estimation in parametric modelling. However, by following the common practice, we will focus our analyses on the global median curve in the next sections.
Figure 4. Median estimates of ATANH coherency of 46 events at four separation distances. The corresponding
lagged coherency values are marked at the right-side axis of the figure. The thick red curve shows the ‘global median’. Dij stands for interstation distance and EW, NS, Z for the ground-motion components. Blue straight line marks the coherency resolvability threshold.
5. Sensitivity analysis of lagged coherency 5.1. The orientation of horizontal components
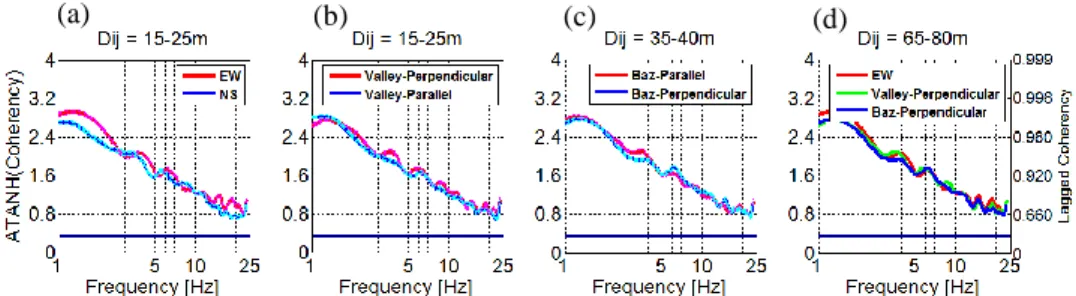
Three cases have been considered for the examination of the directional orientation of the horizontal components of our ground-motion data: (1) EW and NS, (2) ‘valley-perpendicular’ and ‘valley-parallel’, where the NS and EW are rotated along the valley-perpendicular (N40), and valley-parallel (N130) directions, respectively, and (3) ‘baz-parallel’ and ‘baz-perpendicular’, where horizontal components are rotated along the radial and transverse directions of the event’s back-azimuth, respectively. Figure 5 (a) to (c) show the example of comparison of ATANH coherency estimates among the three cases along with their respective 85% confidence intervals, CI (curves in cyan and magenta color), at 15-25 m separation distance. Whatever the rotation considered, both horizontal components exhibit fairly similar tendencies at all frequencies. Figure 5 (d) shows the comparison between one horizontal component from each case (EW, valley-perpendicular and baz-perpendicular components) and again no remarkable difference is observed. Similar trends were observed at all four distance groups considered (Imtiaz, 2015). This indicates that the coherency estimates are independent of the orientation of the horizontal components, and irrespective of their relation to the site or source.
Figure 5. Comparison between (a) EW and NS, (b) valley-perpendicular (N40) and valley-parallel (N130), (c)
baz-parallel and baz-perpendicular horizontal components of the ground motion at separation distance 15-25 m. On each figure, red and blue curves indicate the horizontal components and magenta and cyan curves indicate the respective 85% CI intervals. (d) Comparison among horizontal components oriented at EW, valley-perpendicular and baz-valley-perpendicular directions at 15-25 m. Blue straight line marks the coherency resolvability threshold. The corresponding lagged coherency values are marked at the right-side axis of the figure.
5.2. The source back-azimuth
We then investigated the influence of the orientation of the considered station pairs. We first grouped them according to their orientation in the direction parallel (Baz±10 and Baz+180±10) or perpendicular (Baz+90±10 and Baz+270±10) to the event back-azimuth (Baz) in order to examine the effect of source-direction on the coherency. Figure 6 (a) and (b) show an example of the comparison between the global median estimates at separation distances 15-25 and 35-40 m for the baz-parallel horizontal component. No systematic difference has been observed between the coherency estimates of baz-parallel and baz-perpendicular pairs for the two separation distances shown here. Similar trends were observed at the other two distance groups considered in this study (Imtiaz, 2015).
Figure 6.Comparison of ATANH coherency between the event back-azimuth oriented station pairs at separation distances (a) 15-25 and (b) 35-40 m for the baz-parallel horizontal component. Red and blue curves indicate the two groups of pairs while magenta and cyan curves indicate the respective 85% CI intervals. Comparison of ATANH coherencies among the five array-branch directions at separation distances (c) 15-25 and (d) 35-40 m for valley-perpendicular (N40) horizontal component. Blue straight line marks the coherency resolvability threshold. The corresponding lagged coherency values are marked at the right-side axis of the figure.
5.3. The site-axis orientation
We have also summarized the coherency estimates from all events by grouping the pairs in five array-branch directions, N 39, N 112, N 183, N 328 and N 255. Figure 6 (c) and (d) represent the global median estimates of the five groups of pairs at separation distances 15-25 and 35-40 m for the valley-perpendicular horizontal component. Notably, the pairs lying in N 39 and N 255 directions, corresponding to the valley-edge direction, have the lowest coherency and the highest values are observed at N 328, which is close to the valley-parallel axis.
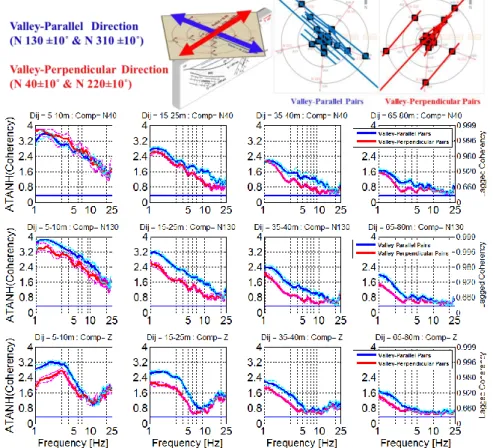
We have thus grouped the station pairs according to their orientation with respect to the valley principal axes. Global medians of ATANH coherency from all available station-pairs lying in the valley-perpendicular (N40±10
(a) (b) (c) (d)
and N220±10), and valley-parallel (N130±10 and N310±10) directions, have been estimated for the four separation distance ranges. The medians (along with 85% CI) for the three components are presented in Figure
7. The plots clearly reveal that the coherency estimates are, generally, higher for pairs in the valley-parallel
direction. The difference between the coherency estimations along the two valley axes becomes particularly important at separation distances 15-25 m and 35-40 m. For instance, at 15-25 m, the lagged coherency values within the 5-15 Hz frequency range vary between a band of 0.66 and 0.92, which reflect very remarkable differences. Such site geometry dependency is consistent with the formation of the wavefield in the valley dominated by surface waves propagating from one edge to the other (Imtiaz, 2015).
Figure 7. Comparison of ATANH coherencies between the valley-perpendicular and valley-parallel station
pairs, for valley-perpendicular (N40), valley-parallel (N130) and Z horizontal components. Red and blue curves indicate the two groups of pairs while magenta and cyan curves indicate the respective 85% CI intervals. The corresponding lagged coherency values are marked at the right-side axis of the figure. Dij stands for interstation distance, Comp for the component of ground motion. Blue straight line marks the coherency resolvability threshold. On top, the two station-orientations and the respective pairs are schematically explained.
6. Comparison with existing parametric models
In order to investigate how well the existing parametric models compare with our observed median estimations, we selected two most widely used models in engineering applications: the analytical (semi-empirical) model of Luco & Wong (1986) and the empirical model of Abrahamson (1991). Luco and Wong derived their model by considering the analysis of shear waves propagating a distance R through a random medium. According to this model, the lagged coherency for a pair of ground motions as a function of separation distance (ξ) and angular frequency (ω) is given by,
|γ(ξ,ω)|= e-α2ω2ξ2 [3]
in which, the coherency drop parameter α is given by α = ν/Vs, where Vs is the average shear-wave velocity of the ground medium along the wave travel-path and ν is a constant related to the medium properties. Luco and Wong suggested that typical values of α are in the range from 2 × 10⁻⁴ s/m to 3 × 10⁻⁴ s/m. In this study, we have considered the median value of α = 2.5 × 10⁻⁴ s/m.
The empirical model of Abrahamson et al., (1991) is based on the data from a small array at a soil site, which allows investigations of coherency for horizontal components and station separation distance smaller than 100 m. The lagged coherency in this model for a pair of ground motions as a function of separation distance (ξ) and frequency (f) is given by
|γ(ξ,f)|=tanh {(2.54-0.012ξ)[exp[(-0.115- 0.00084ξ) f]f-0.878
3 ] + 0.35} [4]
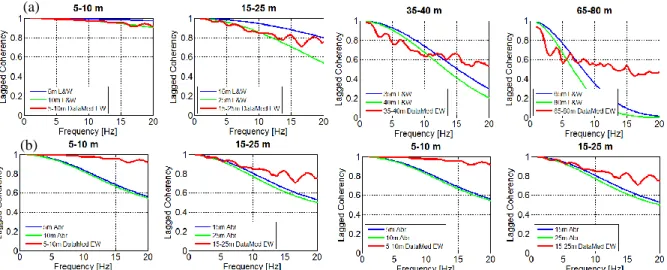
The global median coherency estimates from the Argostoli array recordings are compared with the aforementioned two models for the four separation distances and presented in Figure 8. The comparison shows that the analytical model is in fair agreement with the Argostoli estimates at separation distances 5-10 m and 15-25 m, but the actual decay of coherency with increasing frequency is overestimated for higher frequencies at larger distances (Figure 8 (a)). This is because the L&W, being an analytical model, eliminates the coherency resolvability threshold effect, which no model based on data can. On the other hand, the empirical model either underestimates (at 5-10 m, 15-25 m) or overestimates the coherency observed from the present data (at 35-40 m, 65-80 m). It thus appears that the "theoretical" model fits better at short distances and/or rather low frequencies, whereas the empirical one performs better for distant locations in the high-frequency range.
Figure 8. Comparison of the global lagged coherency of Argostoli data with (a) the analytical model of Luco
and Wong (1986) and (b) the empirical model of Abrahamson (1991) for the EW component and at 4 separation distances. The blue and green curves show the estimates given by the parametric models and the red curve shows the global median estimate from the Argostoli array data.
7. Summary and conclusions
This work investigates the phase variability of the ground motion by estimating lagged coherency from data recorded at a dense array. For the estimation of coherency, it is a common practice to choose the shear (S-) wave part of the seismograms, as it is considered to be the most damaging component from the engineering point of view. However, it was challenging to clearly identify such a window for the Argostoli array records as the ground motions appear to be a complex mixture of body and surface waves (Imtiaz, 2015). It was also observed
(a)
by Imtiaz (2015) that the statistics of coherency estimates derived from many events is only weakly sensitive to the length of time windows provided that they include the same most energetic pulse. In this work, the most energetic signal windows from the onset of the S-wave have been carefully selected from visual inspection of the nearby rock station recordings for lagged coherency estimation. Therefore, our selected windows include the most energetic phase that contains a mix of S-waves along with some converted body waves and surface waves.
Lagged coherency between two ground-motions recorded at a pair of stations, from the selected time windows, is computed for 1 to 25 Hz frequency range and at separation distances 5-10 m, 15-25 m, 35-40 m and 65-80 m. For the statistical analyses an ATANH transformation was applied to the results to produce approximately normally distributed data around the median in order to summarize the observed tendency of coherency. As expected, spatial coherency estimates exhibit decay with increasing frequency and interstation distance. No dependence of lagged coherency has been observed on the orientation of the horizontal ground-motion component. However, the vertical component shows a somewhat different trend, often including an increasing coherency at higher frequencies. Slight or no systematic dependence of coherency was observed on the magnitude, back-azimuth or site-to-source distance of the event, at least for the range of magnitudes investigated here (M≤ 5) (Imtiaz, 2015). Abrahamson, (2007) also examined the effects of earthquake magnitude and source distance on the lagged coherency, and similarly concluded on the absence of any strong dependence.
The key result of the sensitivity analysis is that the coherency estimates exhibit robust, consistent variations as a function of the orientation (azimuth) of station pairs. Coherency along the five different directions of the array-branches yielded statistically different results. A careful investigation showed that the largest coherency is observed for station pairs oriented parallel to the valley-parallel axis (SE-NW), whereas the lowest one corresponds to the perpendicular or valley-edge direction (SW-NE). Differences between the coherency estimates along the two valley directions are particularly important at separation distances 15-25 m and 35-40 m. At 15-25 m inter-station distances and within the 5-15 Hz frequency range, the lagged coherency values vary considerably between 0.66 and 0.92. This robust observation proves to be very consistent with that of Imtiaz (2015) showing the predominance of scattered surface waves propagating along SW-NE direction: the ground motion associated to such waves is in-phase for valley-parallel pairs, and out-of-phase for valley-perpendicular pairs. The incoherence effect in the valley-edge direction, hence, can be related to the wave scattering at the basin edges. In the light of these observations, we may draw our most important conclusion that the spatial lagged coherency estimates seem to be controlled by site dependent characteristics such as the velocity profile, which controls the wavelength of surface waves, and also the valley-geometry, which controls the predominant propagation direction of scattered waves.
8. Bibliography
Abrahamson N. A., Spatial Variation of Earthquake Ground Motion for Application to Soil-Structure Interaction, Electrical Power Research Institute, Rpt. No. EPRI TR-100463, Tier 2, 1992.
Abrahamson N. A., Program on Technology Innovation: Effects of Spatial Incoherence on Seismic Ground Motions, EPRI, Palo Alto, CA: 2007. 1015110.
Abrahamson N. A., Schneider J. F., Stepp J. C., « Empirical Spatial Coherency Functions for Applications to Soil-Structure Interaction Analyses », Earthquake Spectra, 7(1-27), 1991.
Ancheta T. D., Stewart J. P., Abrahamson N. A., « Engineering characterization of earthquake ground motion coherency and amplitude variability », Earthquake Engineering, UCLA Civil and Environmental Engineering, UC Los Angeles, 2011. Bard P.-Y., Bouchon M., « The seismic response of sediment-filled valleys. Part 1. The case of incident SH waves », Bulletin
of the Seismological Society of America, 70(4), 1263-1286, 1980.
Boxberger T., Bindi D., Cara F., Cornou C., Cultrera G., Cushing M., Dechamp A., Delavaud E., Di Giulio G., Guyonnet-Benaize C., Hollender F., Imtiaz A., Kuperminc M., Parolai S., Savvaidis A., Theodoulidis N., Vassallo M., Bard P.- Y., « Effect of the underground structure on the wave-field: the high-resolution experiment in Cephalonia Island (Greece) »,
Second European Conference on Earthquake Engineering and Seismology (2ECEES), Istanbul, Turkey, Abstract #2942,
24-19 August, 2014.
Cornou C., Bard P.-Y., Dietrich M., « Contribution of dense array analysis to basin-edge-induced waves identification and quantification, part II: Application to Grenoble basin, French Alps », Bull. seism. Soc. Am., 93(6), 2624–2648, 2003. Cultrera G., Andreou T., Bard P.-Y., Boxberger T., Cara F., Cornou C., Di Giulio G., Hollender F., Imtiaz A.,
Kementzetzidou D., Makra K., Savvaidis A., Theodoulidis N., The Argostoli Team, « The Argostoli (Cephalonia, Greece) experiment », Second European Conference on Earthquake Engineering and Seismology (2ECEES), Istanbul, Turkey, Abstract #2265, 24-19 August, 2014.
Der Kiureghian A., « A Coherency Model for Spatially Varying Ground Motions », Earthquake Engineering and Structural
Dynamics, 25, 99-111, 1996.
Enochson L. D., Goodman N. R., « Gaussian approximations to the distributions of sample coherence. Tech Report, AFFDL-TR-65-57, 1965, Wright- Patterson Air Force Base.
Harichandran R., « Estimating the spatial variation of earthquake ground motion from dense array recordings », Structural
Safety, 10, 219-233, 1991.
Harichandran R., Vanmarcke E., « Stochastic variation of earthquake ground motion in space and time », Journal of
Engineering Mechanics, ASCE, 112, 154-174, 1986.
Hollender F., Perron V., Imtiaz A., Svay A., Mariscal A., Bard P.-Y., Cottereau R., Lopez-Caballero F., Cushing M., Theodoulidis N., Moiriat D., « A deux pas du repaire du Cyclope d'Ulysse: la campagne post-sismique et le démarrage du réseau accélérométrique SINAPS@ sur l'île de Céphalonie », 13 pages, Colloque AFPS 2015, Paris, France.
Imtiaz A., Seismic wave field, spatial variability and coherency of ground motion over short distances: near source and alluvial valley effects, Earth Sciences. Université de Grenoble, 2015, English. <NNT:2015GRENU002>,<tel-01148138>. Jarvis A., Reuter H. I., Nelson A., Guevara E., Hole-filled seamless SRTM data V4, International Centre for Tropical
Agriculture (CIAT), 2008, available from http://srtm.csi.cgiar.org, accessed on January 02, 2015.
Luco J., Wong H., « Response of a rigid foundation to a spatially random ground motion », Earthquake Engineering and
Structural Dynamics, 14, 891-908, 1986.
Moczo P., Bard P.-Y., « Wave diffraction, amplification and differential motion near strong lateral discontinuities »,Bull. seism. Soc. Am., 83, 85-106, 1993.
Protopapa E., Papastamatiou D. M., Gazetas G., « The Ionianet Accelerometer Array: Early Results and Analysis »,
Proceedings of the 11th European Conference on Earthquake Engineering, Balkema,Rotterdam, 1998.
Scandella L., Paolucci R., « Earthquake induced ground strains in the presence of strong lateral soil heterogeneities »,
Bulletin of Earthquake Engineering, 8(6), 1527-1546, 2010.
Schneider J., Stepp J., Abrahamson, N., « The spatial variation of earthquake ground motion and effects of local site conditions », Proceedings of the Tenth World Conference on Earthquake Engineering, A. A. Balkema, Rotterdam, 2, 967-972, 1992.
Zerva A., Harada T., « Effect of Surface Layer Stochasticity on Seismic Ground Motion Coherence and Strain Estimates »,
Soil Dynamics and Earthquake Engineering, 16, 445-457, 1997.
Zerva A., Stephenson W. R., « Stochastic Characteristics of Seismic Excitations at a Non-Uniform (Rock and Soil) Site »,
Soil Dynamics and Earthquake Engineering, 31, 1261-1284, 2011.
Zerva A., Zervas V., « Spatial variation of seismic ground motions: an overview », Applied Mechanics Review, ASME, 55(3), 271-297, 2002.
Zerva A., Ang A. H-S., Wen Y. K., « Development of differential response spectra for lifeline seismic analysis »,