SHORT COMMUNICATION
Dynamic NanoSIMS ion imaging of unicellular freshwater
algae exposed to copper
Vera I. Slaveykova&Cédric Guignard&Tanja Eybe&
Henri-Noël Migeon&Lucien Hoffmann
Received: 5 September 2008 / Revised: 10 October 2008 / Accepted: 15 October 2008 / Published online: 5 November 2008
# Springer-Verlag 2008
Abstract This work demonstrates the capabilities of nano-scale secondary-ion mass spectrometry, using the Cameca NanoSIMS50 ion microprobe, to detect and image the copper-ion distribution in microalgal cells exposed to nanomolar and micromolar copper concentrations. In parallel to 63Cu− secondary-ion maps, images of 12C−,
12
C14N−, and 31P− secondary ions were collected and analysed. A correlation of63Cu− secondary-ion maps with those found for12C14N−and31P−demonstrated the possible association of Cu with cell components rich in proteins and phosphorus. The results highlighted the potential of Nano-SIMS for intracellular tracking of essential trace elements such as Cu in single cells of the microalga Chlorella kesslerii.
Keywords NanoSIMS . Microalgae . Ion mapping . Copper ion images
Abbreviations
LA-ICP-MS Laser ablation inductively coupled plasma mass spectrometry
PIXE Particle-induced X-ray emission SIMS Secondary-ion mass spectrometry XAS X-ray absorption spectroscopy
XRF X-ray fluorescence
Introduction
Effect-oriented environmental analysis is emerging as an important component in hazard identification of environ-mental contaminants [1]. Among the different groups of environmental contaminants [2], metals such as copper have a particular position. At trace concentrations, copper is an essential micronutrient for most living organisms, because it participates in electron transport and in many biologically important reactions. However, copper can become highly cytotoxic, e.g. causing oxidative damage and interfering with important cellular events [3], if accumulated in excess of cellular needs. Because the biological effects (e.g. toxicity) are a complex function of the contaminants’ cellular concentrations, intracellular distribution, and speciation, new analytical tools and strategies able to provide information at cellular and sub-cellular levels are required. The most common analytical strategy for understanding a metal’s role from a sub-cellular perspective involves separation and detection of individual organelles and/or utilization of different organelle-specific labelling probes (reviewed by Olson et al. [4]). Alterna-tively, complementary and relevant biological metal infor-mation can be obtained by different recent developments in analytical techniques, including PIXE,μ-XAS, XRF, SIMS, LA-ICP-MS, and a number of hyphenated techniques. This
DOI 10.1007/s00216-008-2486-x
V. I. Slaveykova (*)
Environmental Biophysical Chemistry,
Environmental Science and Technology Institute,
School of Architecture, Civil and Environmental Engineering, Ecole Polytechnique Fédérale de Lausanne (EPFL),
Station 2, 1015 Lausanne, Switzerland e-mail: [email protected] C. Guignard
:
T. Eybe:
L. HoffmannDepartment of Environment and Agro-Biotechnologies (EVA), Public Research Center—Gabriel Lippmann,
41 rue du Brill, 4422 Belvaux, Luxembourg H.-N. Migeon
Department of Science and Analysis of Materials (SAM), Public Research Center—Gabriel Lippmann,
allows for qualitative and quantitative imaging of the distribution, and determination of intracellular speciation, as reviewed in Ref. [5]. Among these techniques, dynamic secondary-ion mass spectrometry (SIMS) [6] and, in particular, nanoscale (Nano) SIMS, is emerging as a powerful tool for the determination of ion distributions and the dynamics of different processes, using trace element analysis both of natural and isotopically enriched elements, for example C, N, O, Mg, Si, S, and I, in single cells, with a high resolution (e.g. 50 nm) and a high sensitivity. Nano-SIMS has been successfully applied in the biological and biomedical sciences [7–10] and in environment-related disciplines such as geology [11], geochemistry [12], and cosmochemistry [13]. Very recently, the potential of Nano-SIMS in soil biogeochemistry and ecology has also been explored [14–16].
The objective of this study was to determine the intracellular distribution of Cu in single cells of unicellular microalgae, compared with that of the major structural elements C, N, and P. For this purpose, the unique capabilities of NanoSIMS 50 were used to directly visualise these elements at the cellular level and to follow their occurrence along the cell axes. The green microalga Chlorella kesslerii was chosen because it represents the primary producers playing an important role in aquatic systems, and the base of the aquatic food chain.
Experimental
Exposure of algae to Cu and intracellular Cu determination C. kesslerii was cultured in an OECD algal growth medium [17] at 20 °C, with rotary shaking (100 rpm) and a 12:12 hour light-dark regime. Cells were collected by gentle filtration when the mid-exponential algal growth phase was attained, and washed with metal-free experimental medium. Algae were further re-suspended in experimental medium containing 1 nmol L−1or 10μmol L−1Cu(NO3)2in 10 mmol
L−1MES (2-[N-morpholino]ethanesulfonic acid; Fluka, p.a.) at pH 6.0 to a cell density of approximately 105cells mL−1. After 8 h exposure, 50-mL aliquots of algal suspensions were filtered through 3.0-μm pore-size regenerated cellulose filters. Algae on the filter were then washed twice with 5 mL 10 mmol L−1EDTA (ethylenediaminetetraacetic acid; Fluka, p.a.) to remove Cu adsorbed on the cell by using a previously optimized methodology [18], then re-suspended in 20 mL copper-free experimental medium and divided into two portions. The first was used to prepare and fix samples for NanoSIMS measurements, as described in the next section. The second was centrifuged for 10 min at 100 g. The amount of intracellular Cu was measured in the algal pellet following digestion with 500 μL conc. HNO3 (Suprapur, Baker) at
100 °C for 1 h. The Cu concentration in the intracellular fractions was measured by inductively coupled plasma mass spectrometry (ICP-MS) (Hewlett-Packard 4500; Agilent Technologies, Palo Alto, CA, USA). Controls and corrections of the blanks and chemicals used were performed. Cell numbers and densities were determined with a Coulter Multisizer III particle counter (50-μm orifice). The average cell diameter was 3.6–3.8 μm.
Sample preparation for NanoSIMS
All the chemicals used for sample preparation were ordered from Sigma-Aldrich (Seelze, Germany). Algal cells were harvested by centrifugation (Sanyo/MSE Harrier 18/80 Refrigerated; Jepson Bolton, Watford, UK) for 1–2 min at 100 g at room temperature, and then washed with 10 mmol L−1MES. The cells were fixed in 1% agar cubes (edge length 1–2 mm) prior to the embedding procedure. This method allowed the resin embedding of cells without further centrifugation.
The first fixation was done with 5% glutaraldehyde in 10 mmol L−1 MES overnight. Cells were washed in 10 mmol L−1 MES and then post-fixed with osmium tetroxide (0.2% in H2O) for 16 h. After washing with MES
and dehydration with five increasing acetone concen-trations (30, 50, 70, 90, and 100% acetone), the algal cells were embedded in epoxy resin (Epon 812 substitute). The samples were cut to 500-nm semi-thin sections with an ultramicrotome (Leica Ultracut, Le Pecq Cedex, France) equipped with a diamond knife and deposited on silicon wafers (Siltronix, Archamps, France) for NanoSIMS analysis. Before analysis the samples were stored in plastic boxes at room temperature in the dark.
NanoSIMS imaging of Chlorella kesslerii individual cells NanoSIMS imaging was carried out on the Cameca Nano-SIMS 50 ion microprobe (Cameca, Courbevoie, France). Cs+ primary ions were generated by a caesium source and accelerated towards the sample surface as a tightly focused ion beam with a probe working diameter of approximately 50 nm, an intensity of 0.8 pA, and an ion-impact energy of 16 keV. The secondary beam was focused and guided through several transfer lenses to the entrance of the mass spectrometer, which was a double-focusing filter analyzer. The first filter was an electrostatic sector and the second filter was a magnetic sector in which a variable magnetic field, perpendicular to secondary ion motion, deflects ions according to their momentum. According to the mass-to-charge (m/z) ratio, ions were discriminated by their differential deviation in the magnetic field to a parallel multidetector system. Up to five masses can be simulta-neous detected and counted. In this study, signals arising
from secondary ions of 12C−, 12C14N−, 31P−, 63Cu−, and
65
Cu− were acquired simultaneously. As a mass resolution of 1800 is necessary to distinguish 63Cu− and 31P16O2−
ions, the mass spectrometer was set to a minimum resolu-tion of 3500. All images were acquired in 256×256 pixels format with a counting time of 20 ms per pixel.
Results and discussion
The sub-cellular distribution of copper in individual cells of the alga C. kesslerii was mapped by measurement of63Cu− and65Cu−secondary ions in cells exposed to 1 nmol L−1or
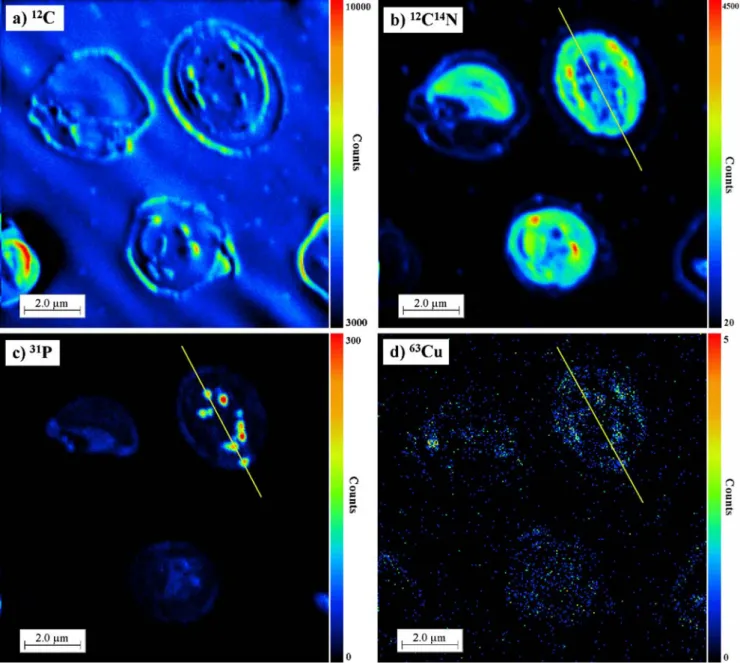
10 μmol L−1 copper, representative of natural and heavily contaminated waters. In order to provide cell background images, ion mapping of the main elements that occur in biological tissues,12C−,12C14N−, and31P− secondary ions was performed in parallel. The existing correlation between secondary ion images of 12C−, 12C14N−, and31P− and the knowledge of the composition of the main cellular components were used to interpret the results obtained. For example, a combination of a high 12C− signal with lower12C14N− (Fig.1a,b) in the periphery of the cell (e.g. cell wall), may indicate lipid or/and sugar contents [8], which is consistent with the cellulose-rich walls of Chlorella cells. High 12C14N− may indicate proteins or
Fig. 1 12C−,12C14N−,31P−, and63Cu−secondary ion distributions in the whole cell of Chlorella kesslerii. Different colours correspond to different intensities of the signal, which increase from black to red.
The straight lines represent the line scans made in the region of interest, given in Fig.2
glycoproteins, and 12C− associated with 31P− indicates phospholipids. Higher 31P− (Fig. 1c, red spots) associated with lower 12C14N− (Fig. 1b, blue spots) probably corre-sponds to phosphate granules [8]. In several regions of interest the line scans for the elements63Cu−,12C14N−, and
31
P−were accomplished to explore the possible association of Cu with other sub-cellular components.
Cu ion mapping in the cells of Chlorella kesslerii exposed to 1 nmol L−1Cu
A good signal was obtained for the63Cu−secondary ion in the algae exposed to 1 nmol L−1Cu, whereas the signal for
65
Cu− secondary ions was near the detection limits of the technique, because of the lower natural abundance (30.83%). The 63Cu− secondary-ion map obtained from individual cells of the alga Chlorella kesslerii is presented in Fig. 1d, and corresponds to an average cellular Cu concentration of 5×10⁵Cu atoms per cell, determined by measurements with ICP-MS. A very weak63Cu−signal was detected at the cell periphery, indicating that the quantity of Cu in the cell wall and membrane is negligible compared with that in the cell interior. The above observations are in agreement with Cu biouptake experiments, that revealed the tendency of Cu to enter the cell, rather than to be adsorbed by the cell surface [19], and confirmed the efficiency of Cu extraction from the cell wall by 10 mmol L−1 EDTA [18], used to distinguish between intracellular and adsorbed metal on the algal surface.
Furthermore, 63Cu− sub-cellular distribution matched phosphorus and protein distributions. Higher63Cu− signal (Fig.1d) corresponds to higher31P−(Fig.1c, red spots) and lower 12C14N− (Fig. 1b, blue spots). These observations demonstrate that Cu probably associates with the phosphate granules in the cell [8]. On the other hand, the high signal of63Cu−followed the high12C14N−and high31P−intensity, which may point to Cu association with the nucleus.
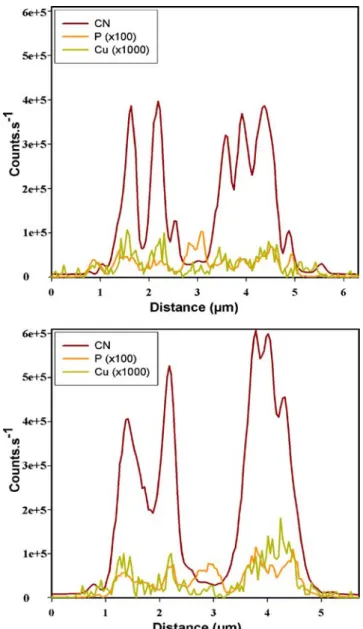
The above considerations were further confirmed by a line scan of the intensity of the signals of63Cu−,12C14N−, and 31P− demonstrated in Fig. 2. The intensity profiles of
63
Cu−closely followed those of31P−. On the other hand the large12C14N− over the whole cell overlaps both the63Cu− and 31P− profiles, making precise interpretation of the images difficult. In addition,63Cu− accumulation followed spots rich in12C14N− (Fig. 1b) and poor in31P−(Fig. 1c), which further suggests that, in addition to the polyphos-phate granules, Cu may be associated with the protein-rich cell organelles and the nucleus.
Cu ion mapping in the algal cells exposed to 10μmol L−1Cu Ion images collected in algal cells exposed to 10μmol L−1 Cu (Fig. 3) showed that algal cells were intact following
exposure to toxic copper concentrations for 8 h. Both63Cu− and 65Cu− isotopes were visualized in the cytosolic space. The secondary-ion maps obtained correspond to cellular Cu concentrations of (1.5±0.5)×109atoms per cell exposed to 10 μmol L−1 Cu. The 63Cu− ion signal near the cell periphery (e.g. cell wall) was lower than that in the cell interior, demonstrating that the EDTA extraction procedure was rather efficient even after exposure to a high Cu concentration. Similarly to images obtained for algae exposed to 1 nmol L−1 Cu2+, both 63Cu− and 65Cu− sub-cellular distributions generally followed ion maps obtained for 12C14N− and 31P−. Interestingly the high 63Cu− signal (Fig.3d) corresponded to the higher31P−and lower12C14N− (Fig. 4a) in the central part of the cell, indicating a possible association with phosphate granules, which are known to sequester and store copper [8,21,22].
On the one hand, high 63Cu− values are obtained in regions yielding strong 12C14N− and 31P− signals, most likely corresponding to cell nucleotides. This might suggest that at high exposure concentrations, Cu can affect the cell nucleus. On the other hand, it can also be noticed that Cu can be found in zones with lower31P−, which may indicate an association of Cu with different proteins.
Overall, these preliminary measurements demonstrated that NanoSIMS is a very promising tool for mapping sub-cellular ion distribution of elements such as Cu in single cells, simultaneously to those of main cellular elements N, C, and P. To our knowledge, this is the first report showing the applicability of NanoSIMS analysis to study of Cu distribu-tion in microalgal species exposed to trace (nmol L−1) and toxic (μmol L−1) levels of Cu in an ecotoxicological
context. The unique features of the NanoSIMS technique, combining high element specificity, high sensitivity, and
Fig. 2 Line-scan data collected across the alga in the region of interest as depicted in Fig.1
nanometre spatial resolution, have opened up new fields for tracking trace elements in unicellular microorganisms such as green algae, which represent the base of the food chain in aquatic ecosystems. In addition, the simultaneous ion imaging of two copper isotopes makes study of the dynamics of different cellular processes involving Cu possible, e.g. by using samples enriched with 65Cu−.
Although providing a background cell image, the applied technique is not able to provide the sub-cellular compart-ment distribution, because the different organelle mem-branes have almost the same composition of the structural elements (C, N, O, P, and S) and lack contrast in ion images [20]. Hence, it is currently not possible to reveal with certainty the various cellular organelles using NanoSIMS
imaging. This makes it difficult to compare the ion images obtained in this study with literature data available on the ultrastructural localization of Cu in algae, because Nano-SIMS provides only indirect information about algal cell morphology. Furthermore, it is worth noting that the chemical fixation procedure used in this work might involve a risk of ion redistribution before cell embedding, even if the ion mobility is considerably reduced by use of glutaraldehyde and osmium tetroxide. Thus, alternative sample-preparation procedures could be envisaged to im-prove the fixation of cell tissues, particularly if highly diffusible ions (i.e. K, Na, Mg, and Ca) have to be monitored. To that purpose, cryo-fixation techniques have recently been developed and are now regarded as the best
Fig. 3 12C−, 12C14N−, 31P−, and 63Cu− distributions in cells of Chlorella kesslerii exposed to 10μmol L−1Cu(II). The straight lines represent the line scans made in the two regions of interest, given in
Fig.4Different colours correspond to the different intensities of the signal, which increase from black to red
choice to preserve the integrity of tissues and eliminate the risk of ion redistribution [21,22].
Nonetheless, it is worth mentioning the general consis-tency of the obtained 63Cu− over 12C−,12C14N−, and 31P− secondary-ion maps with the existing literature on the ultrastructural localization of Cu in algal cells and the chemical composition of their structural units. For example, Cu was detected in the starch grains, thecal plates, and osmophilic vesicles of the dinophyceae Prorocentrum micans [23]. Moreover, by use of X-ray energy-dispersion spectroscopy, the presence of trace metals (including Cu) was found in polyphosphate bodies of the cyanophyceae Plectonema boryanum [24], bodies that may provide storage sites for essential metals such as Cu.
A large number of Cu proteins such as plastocyanin and cytochrome oxidase, and Cu transporting proteins required
to supply Cu for photosynthesis, are found in the thylakoids [25]. Indeed, Cu was found to accumulate in the thylakoids and pyrenoids of other green algae, for example Oocystis nephrocystioides, by electronic spectroscopic imaging [26]. NanoSIMS can also be a valuable complementary tool, providing information of ecotoxicological value and im-proving the predictability of the biological effects of toxic metals. Moreover, NanoSIMS can provide further impetus in emerging disciplines such as metallomics and metal-loproteomics [27,28] that critically need probes enabling the obtention of spatially resolved trace element maps in a single cell, disciplines that will be increasingly important in the future [29].
Conclusion
This study demonstrated the applicability of NanoSIMS in imaging Cu distribution in single micrometer-sized algal cells, simultaneously to major cell constituents’ ions. Combined analysis of 12C−, 12C14N−, 31P−, and 63Cu− secondary-ion maps provides important information about the sub-cellular distribution of Cu and possible Cu interactions with bioactive macromolecules in phytoplank-ton cells. Correlation of the secondary63Cu−ion map with those obtained for12C14N−and31P−demonstrated the pos-sible association Cu with cell components rich in proteins and phosphorus for cells exposed to both low and high concentrations of Cu.
Acknowledgements Funding for this work by the Swiss National Science Foundation PP002–102640 and the Luxembourgish National Research Fund (Nano programme) are warmly acknowledged. The authors are grateful to Esther Lentzen for NanoSIMS measurements.
References
1. Suter MJF (2008) Anal Bioanal Chem 390:1957–1958
2. Schwarzenbach RP, Escher BI, Fenner K, Hofstetter TB, Johnson CA, von Gunten U, Wehrli B (2006) Science 313:1072–1077 3. Gaetke LM, Ching KC (2003) Toxicology 189:147–163 4. Olson KJ, Ahmadzadeh H, Arriaga EA (2005) Anal Bioanal
Chem 382:906–917
5. Lobinski R, Moulin C, Ortega R (2006) Biochimie 88:1591–1604 6. McDonnell LA, Heeren RMA (2007) Mass Spectrom Rev
26:606–643
7. Lechene CP, Luyten Y, McMahon G, Distel DL (2007) Science 317:1563–1566
8. Lechene CP, Hillion F, McMahon G, Benson D, Kleinfeld AM, Kampf JP, Distel D, Luyten Y, Bonventre J, Hentschel D, Park KM, Ito S, Schwartz M, Benichou G, Slodzian G (2006) J Biol 5:20.1–20.30
9. Guerquin-Kern JL, Wu TD, Quintana C, Croisy A (2005) Biochim Biophys Acta 1724:228–238
10. Chandra S, Pumphrey G, Abraham JM, Madsen EL (2008) Appl Surface Sci, Available online 14 May 2008
Fig. 4 Line-scan data collected across the alga in the regions of interest 1 and 2, as depicted in Fig.3
11. Stern RA, Fletcher IR, Rasmussen B, McNaughton NJ, Griffin BJ (2005) Int J Mass Spectrom 244:125–134
12. Badro J, Ryerson FJ, Weber PK, Ricolleau A, Fallon SJ, Hutcheon ID (2007) Earth Planetary Sci Lett 262:543–551
13. Hoppe P (2006) Appl Surf Sci (2006) 252:7102–7106
14. Herrmann AM, Ritz K, Nunan N, Clode PL, Pett-Ridge J, Kilburn MR, Murphy DV, O’Donnell AG, Stockdale EA (2007) Soil Biol Biochem 39:1835–1850
15. Audinot JN, Guignard C, Migeon HN, Hoffmann L (2006) Appl Surf Sci 252:6813–6815
16. Krein A, Audinot JN, Migeon HN, Hoffmann L (2007) Environ Sci Poll Res Int 14:3–4
17. OECD (1984) OECD guideline for testing of chemicals. OECD Publications Office, Paris, France
18. Hassler CS, Slaveykova VI, Wilkinson KJ (2004) Limnol Ocean-ogr Methods 2:237–247
19. Lamelas C, Slaveykova VI (2007) Environ Sci Technol 41:4172– 4178
20. Roemer W, Wu TD, Duchambon P, Amessou M, Carrez D, Johannes L, Guerquin-Kern JL (2006) Appl Surface Sci 252:6925–6930
21. Grovenor CRM, Smart KE, Kilburn MR, Shore B, Dilworth JR, Martin B, Hawes C, Rickaby REM (2006) Appl Surface Sci 252:6917–6925
22. Smart KE, Kilburn MR, Salter CJ, Smith JAC, Grovenor CRM (2007) Int J Mass Spectrom 260:107–114
23. Lage OM, Parente AM, Vasconcelos MTSD, Gomes CAR, Salema R (1996) J Phycol 32:416–423
24. Jensen TE, Baxter M, Rachlin JW, Jani V (1982) Environ Pollut 27:119–127
25. Shikanai T, Müller-Moulé P, Munekage Y, Niyogi KK, Pilon M (2003) Plant Cell 15:1333–1347
26. Soldo D, Hari R, Sigg L, Behra R (2007) Aquat Toxicol 71:307–317 27. Szpunar J (2004) Anal Bioanal Chem 378:54–56
28. Szpunar J (2005) Analyst 130:442–465