Online Disturbance Prediction for
Enhanced Availability in Smart Grids
Doctoral Dissertation submitted to the
Faculty of Informatics of the Università della Svizzera italiana in partial fulfillment of the requirements for the degree of
Doctor of Philosophy
presented by
Igor Kaitovic
under the supervision of
Prof. Miroslaw Malek
Dissertation Committee
Prof. Fernando Pedone Università della Svizzera italiana, Switzerland
Prof. Olaf Schenk Università della Svizzera italiana, Switzerland
Prof. Mario Paolone École polytechnique fédérale de Lausanne, Switzerland
Prof. Paulo Verissimo University of Luxembourg, Luxembourg
Dissertation accepted on 17 November 2017
Research Advisor PhD Program Director
Prof. Miroslaw Malek Prof. Walter Binder
I certify that except where due acknowledgement has been given, the work presented in this thesis is that of the author alone; the work has not been submit-ted previously, in whole or in part, to qualify for any other academic award; and the content of the thesis is the result of work which has been carried out since the official commencement date of the approved research program.
Igor Kaitovic
Lugano, 17 November 2017
To my wife and my mother.
"Ordinary mortals know what’s happening now, The gods know what the future holds
Because they alone are totally enlightened. Wise men are aware of future things Just about to happen."
Constantine P. Cavafy (1863 - 1933)
Abstract
A gradual move in the electric power industry towards Smart Grids brings new challenges to the system’s efficiency and dependability. With a growing com-plexity and massive introduction of renewable generation, particularly at the distribution level, the number of faults and, consequently, disturbances (errors and failures) is expected to increase significantly. This threatens to compromise grid’s availability as traditional, reactive management approaches may soon be-come insufficient. On the other hand, with grids’ digitalization, real-time sta-tus data are becoming available. These data may be used to develop advanced management and control methods for a sustainable, more efficient and more de-pendable grid. A proactive management approach, based on the use of real-time data for predicting near-future disturbances and acting in their anticipation, has already been identified by the Smart Grid community as one of the main pillars of dependability of the future grid.
The work presented in this dissertation focuses on predicting disturbances in Active Distributions Networks (ADNs) that are a part of the Smart Grid that evolves the most. These are distribution networks with high share of (renew-able) distributed generation and with systems in place for real-time monitoring and control. Our main goal is to develop a methodology for proactive network management, in a sense of proactive mitigation of disturbances, and to design and implement a method for their prediction. We focus on predicting voltage sags as they are identified as one of the most frequent and severe disturbances in distribution networks.
We address Smart Grid dependability in a holistic manner by considering its cyber and physical aspects. As a result, we identify Smart Grid dependabil-ity properties and develop a taxonomy of faults that contribute to better under-standing of the overall dependability of the future grid. As the process of grid’s digitization is still ongoing there is a general problem of a lack of data on the grid’s status and especially disturbance-related data. These data are necessary to design an accurate disturbance predictor. To overcome this obstacle we in-troduce a concept of fault injection to simulation of power systems. We develop
viii
a framework to simulate a behavior of distribution networks in the presence of faults, and fluctuating generation and load that, alone or combined, may cause disturbances. With the framework we generate a large set of data that we use to develop and evaluate a voltage-sag disturbance predictor. To quantify how prediction and proactive mitigation of disturbances enhance availability we cre-ate an availability model of a proactive management. The model is generic and may be applied to evaluate the effect of proactive management on availability in other types of systems, and adapted for quantifying other types of properties as well. Also, we design a metric and a method for optimizing failure prediction to maximize availability with proactive approach.
In our conclusion, the level of availability improvement with proactive ap-proach is comparable to the one when using high-reliability and costly compo-nents. Following the results of the case study conducted for a 14-bus ADN, grid’s availability may be improved by up to an order of magnitude if disturbances are managed proactively instead of reactively.
The main results and contributions may be summarized as follows: (i) Taxon-omy of faults in Smart Grid has been developed; (ii) Methodology and methods for proactive management of disturbances have been proposed; (iii) Model to quantify availability with proactive management has been developed; (iv) Sim-ulation and fault-injection framework has been designed and implemented to generate disturbance-related data; (v) In the scope of a case study, a voltage-sag predictor, based on machine-learning classification algorithms, has been de-signed and the effect of proactive disturbance management on downtime and availability has been quantified.
Keywords: Active Distribution Networks, Availability, Data analytics,
De-pendability, Disturbances, Fault injection, Machine learning, Prediction, Proac-tive management, Simulation, Smart Grid, Voltage sags
Acknowledgements
First and foremost I would like to thank my advisor, Prof. Miroslaw Malek for the continuous support, numerous valuable discussions and for his friendly and open attitude. Also, I would like to thank some of the members of the ALaRI in-stitute, Faculty of informatics, and the SCCER-FURIES project, particularly Slo-bodan Lukovic, for collaboration on projects and publications and for fruitful discussions. Besides, my many former students have helped me to widen my knowledge and to enhance my work. Supporting Filip Obradovic in his mas-ter’s thesis and working with him on a publication had a strong impact on my dissertation results. My work also benefited greatly from comments and sugges-tions from my committee members and publication reviewers to whom I am very grateful.
I thank the Hasler Foundation and the Commission for Technology and Inno-vation for funding a part of this work. Also, I thank Università della Svizzera ital-iana and the administrative director, Albino Zgraggen, for granting me a schol-arship for the completion of my work as well as the dean’s office of the Faculty of informatics for an excellent administrative support and their friendship.
Finally, I would like to express my limitless gratitude to my wife for her un-selfish support and love and for proofreading some of my publications and parts of the manuscript, as well as to my parents, for their support, understanding and unconditional love.
Contents
Contents xi
List of Figures xv
List of Tables xvii
List of Acronyms xix
1 Introduction and Motivation 1
1.1 Smart Grids - A Brief Overview . . . 1
1.1.1 Needs and Trends . . . 3
1.1.2 Enabling Technologies . . . 5
1.1.3 Active Distribution Networks . . . 9
1.2 Rising Smart Grid Dependability Concerns . . . 9
1.2.1 Dependability Challenges . . . 10
1.2.2 A Need for Revision of Power Grid Reliability Standards . . 11
1.2.3 Dependability of Active Distribution Networks . . . 12
1.3 Proactive Management Concept . . . 13
1.4 Problem Statement . . . 15
1.4.1 Challenges . . . 15
1.4.2 Goals and Objectives . . . 16
1.5 Contents and Contributions . . . 18
2 Terminology, Concepts and Taxonomies 21 2.1 Overview of Basic Dependability Concepts . . . 22
2.2 Overview of Modeling and Evaluation Methods and Tools . . . 25
2.3 Dependability of Smart Grids . . . 26
2.3.1 Terminology of Smart Grid Dependability Threats . . . 27
2.3.2 Smart Grid Dependability Attributes . . . 28
2.3.3 Taxonomy of Smart Grid Faults . . . 32 xi
xii Contents
2.3.4 Figures of Merit of Smart Grid Availability . . . 39
3 Related Work 41 3.1 Traditional Approach to Power Grid Dependability . . . 41
3.2 Smart Grid Dependability Modeling and Evaluation . . . 42
3.3 Disturbance Prediction and Proactive Management . . . 45
3.4 Relevant Smart Grid Projects . . . 47
4 Proactive Management and Its Impact on Availability 51 4.1 Model of Proactive Management . . . 53
4.1.1 Failure Prediction Model and Quality Metrics . . . 53
4.1.2 Proactive Action Model . . . 55
4.1.3 Models of Predictive Policies . . . 56
4.2 Optimizing Prediction for Enhanced Availability . . . 59
4.2.1 Steady-state Availability Equation . . . 60
4.2.2 A-measure and Prediction Optimization . . . 61
4.3 Model Validation . . . 63
4.3.1 System Structure and Parameters . . . 63
4.3.2 Availability with Reactive and Proactive Policies . . . 66
4.3.3 Sensitivity Analysis . . . 70
4.3.4 Simulation Results . . . 73
5 Methodology for Online Disturbance Prediction 77 5.1 Monitoring and Data Acquisition . . . 78
5.2 Disturbance Prediction . . . 78
5.3 Proactive Mitigation . . . 78
5.4 Disturbance Predictor Design . . . 79
5.4.1 Data Collection . . . 79
5.4.2 Data Analysis . . . 79
5.4.3 Prediction Design and Evaluation . . . 80
5.4.4 Tools . . . 81
6 Simulation and Fault Injection Framework 83 6.1 Functionalities, Structure and Components . . . 84
6.1.1 Framework Frontend . . . 86
6.1.2 Framework Backend . . . 87
6.2 Implementation Details . . . 89
6.2.1 Power System Simulator . . . 89
6.2.2 Dynamic Model Manipulation Mechanism . . . 91
xiii Contents
6.3 Graphical User Interface . . . 92
6.3.1 Simulation Environment . . . 92
6.3.2 Fault Injection Environment . . . 93
6.3.3 Data Manipulation Environment . . . 94
7 Case Study: Predicting Voltage Sags in an Active Distribution Network 97 7.1 Voltage Sags: Properties, Classification and Causes . . . 99
7.2 Simulation of Voltage Sags and Data Generation . . . 100
7.3 Data Conditioning . . . 103
7.4 Prediction Quality Evaluation Method . . . 107
7.5 Preliminary Feature Selection . . . 108
7.6 Prediction Algorithm and Feature Set Selection . . . 113
7.7 Analyzing the Effect of Prediction Parameters on Its Quality . . . . 115
7.8 Analyzing the Effect on Availability . . . 121
8 Concluding Remarks, Main Contributions and Future Work 129 8.1 Summary and Conclusions . . . 129
8.2 Overview of Main Contributions . . . 133
8.3 Future Work . . . 134
Figures
1.1 Overview of Smart Grid elements. . . 2
1.2 System management paradigm evolution. . . 14
2.1 Taxonomy of fault-tolerance techniques. . . 23
2.2 Taxonomy of fault-tolerance policies. . . 25
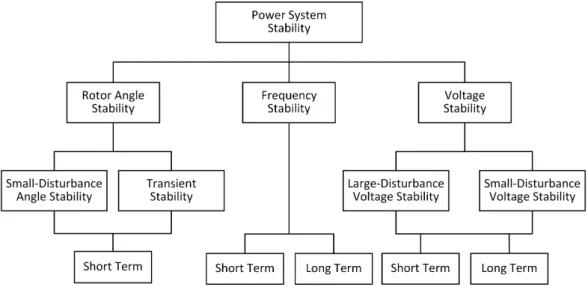
2.3 Power system stability classification. . . 30
2.4 Viewpoints and categories for faults classification. . . 33
2.5 Classification of common Smart Grid faults. . . 38
3.1 Power system operating states and transitions. . . 42
4.1 An example of a precision-recall curve. . . 55
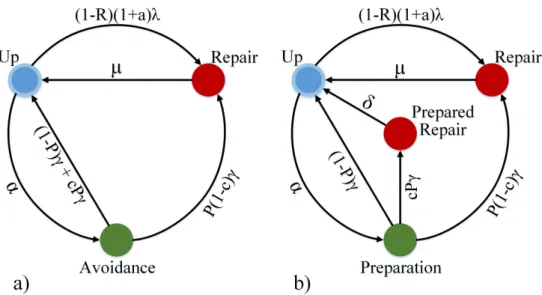
4.2 Markov models of two predictive fault-tolerance policies (a) pre-diction and avoidance and (b) prepre-diction and preparation. . . 56
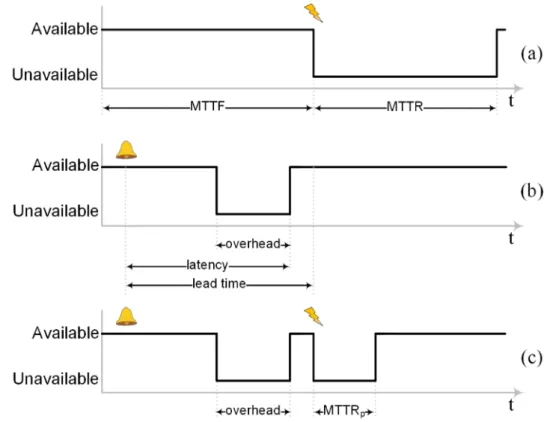
4.3 System availability for the case of a true-positive alarm and suc-cessful proactive action for (a) reactive, (b) prediction and avoid-ance, and (c) prediction and preparation fault-tolerance policies. 58 4.4 Unified Markov model of predictive fault-tolerance policies. . . 59
4.5 Structure of the analyzed virtualized server system. . . 64
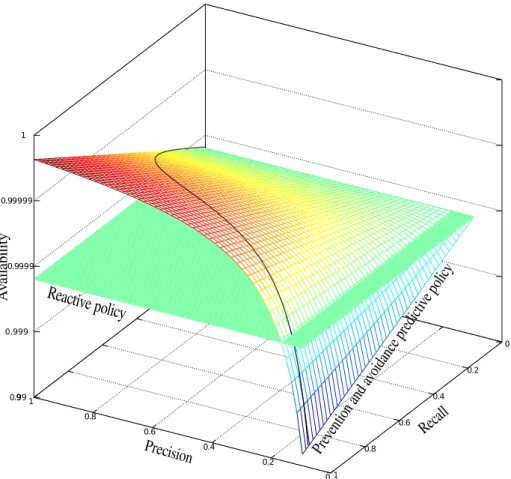
4.6 Availability of the server infrastructure with prediction and avoid-ance, and reactive policies as a function of prediction quality. . . . 66
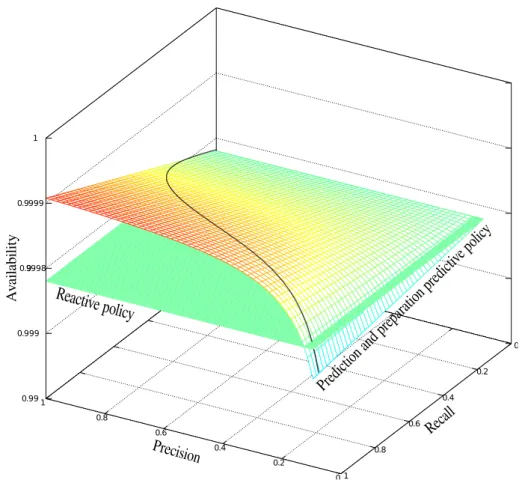
4.7 Availability of the server infrastructure with prediction and prepa-ration, and reactive policies as a function of prediction quality. . . 67
4.8 Impact of MTTF on steady-state availability. . . 70
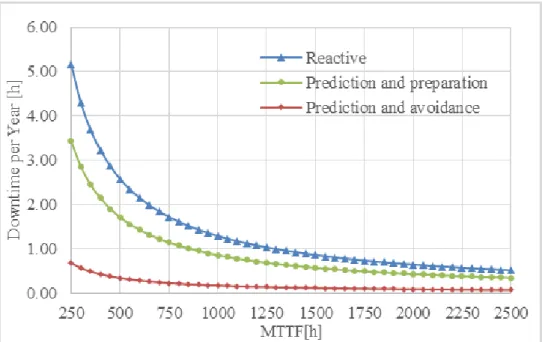
4.9 Impact of MTTF on downtime per year. . . 70
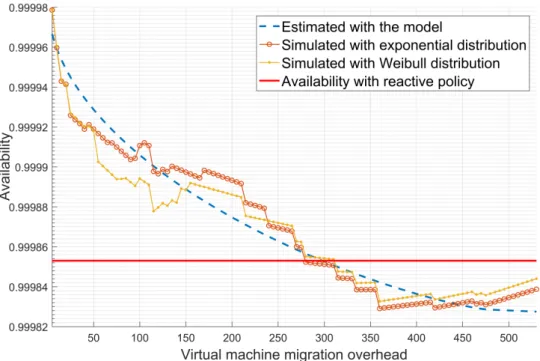
4.10 System’s availability with different virtual machine migration over-head for prediction and avoidance policy. . . 74
4.11 System’s availability with different checkpoint overhead for the prediction and preparation policy. . . 75
xvi Figures
5.1 Proactive disturbance management methodology overview. . . 77
5.2 Disturbance predictor design phases. . . 79
6.1 Structure of the simulation and fault injection framework. . . 85
6.2 A part of the PSAT structure. . . 90
6.3 New simulation window snapshot. . . 92
6.4 Adding faults window snapshot. . . 93
6.5 Data manipulation window snapshot. . . 94
7.1 Active Distribution Network based on the IEEE 14-bus model. . . 100
7.2 An example of voltage sags caused by a fault on Bus 7. . . 102
7.3 An example of a tagged data output sequence from DyPSyFI. . . . 104
7.4 An example of a data instance. . . 104
7.5 An example of a part of a data matrix. . . 105
7.6 An example of prediction window and lead time. . . 106
7.7 Evaluation of performance of different algorithms for combina-tions of the most indicative features. . . 114
7.8a The effect of prediction window size on prediction performance when lead time is 10 cycles. . . 116
7.8b The effect of prediction window size on prediction performance when lead time is 30 cycles. . . 116
7.8c The effect of prediction window size on prediction performance when lead time is 90 cycles. . . 117
7.8d The effect of prediction window size on sag detection performance.118 7.9 The effect of lead time on prediction performance. . . 119
7.10 The effect of sampling period on performance of prediction with different lead times. . . 120
7.11 Basic principle of an OLTC operation. . . 122
7.12 Distribution of the number of sags with respect to their duration. 122 7.13 A precision-recall curve of the predictor of sags that last more than 10 cycles. . . 124
7.14 Availability for OLTC delay of 10 cycles and different number of sags per year. . . 125
7.15 Availability for a range of values for the OLTC delay and a different number of sags per year. . . 127
Tables
2.1 Major dependability attributes and means as defined in computer systems dependability (CSD) and electric power systems (EPS)
communities. . . 29
2.2 The most severe recent blackouts that were analyzed. . . 37
4.1 Failure prediction contingency table. . . 54
4.2 Description of the unified Markov model states. . . 59
4.3 System parameters. . . 65
4.4 Availability of different policies with perfect failure prediction. . . 68
4.5 Availability for different optimization metrics. . . 69
4.6 Sensitivity analysis results. . . 71
6.1 Output data format. . . 92
7.1 Classification of voltage sags and their characteristics. . . 99
7.2 Overview of the network power balance. . . 101
7.3 Nominal power demand on load buses. . . 101
7.4 Simulation parameters summary. . . 103
7.5 Summary of the number of "sag" and "no sag" instances per bus. . 106
7.6 Brief description of used machine-learning algorithms. . . 109
7.7 Feature ranking with F-measure for Logistic regression for the case of sag prediction on Bus 6 when faults are injected on Bus 2. . . . 110
7.8a The most indicative features for different machine-learning algo-rithms when sags are predicted on Bus 6 for fault injected on Buses 1 to 7. . . 111
7.8b The most indicative features for different machine-learning algo-rithms when sags are predicted on Bus 6 for fault injected on Buses 8 to 14. . . 112
7.9 Availability and downtime per year for the selected values of the number of sags per year and OLTC delays. . . 127
List of Acronyms
AMI Automatic Metering Infrastructure AND Active Distribution Network ASAI Average Service Availability Index AVR Automatic Voltage Regulator
CAIDI Customer Average Interruption Duration Index CIGRE International Council on Large Electric Systems CIM Common Information Model
CPES Cyber-Physical Energy Systems CPS Cyber-Physical System
CSD Computer Systems Dependability CTMC Continuous-Time Markov Chain DER Distributed Energy Resource DG Distributed Generator
DMS Distribution Management System DSM Demand Side Management DSO Distribution System Operator DSS Decision Support System EMS Energy Management System EPS Electric Power System
ES Energy Storage
EV Electric Vehicle
FACTS Flexible AC Transmission System FDR Frequency Disturbance Record
FT Fault Tolerance
HVDC High-Voltage Direct Current
ICT Information and Communication Technology IED Intelligent Embedded Device
IEEE Institute of Electrical and Electronics Engineers
xx
IoT Internet of Things
MPC Model-Predictive Control MTTF Mean-Time-To-Failure MTTR Mean-Time-To-Repair
NIST National Institute of Standards and Technology OLTC Online Tap Changer
PCA Principal Component Analysis PLC Power-Line Communication PMU Phasor Measurement Unit PSAT Power System Analysis Toolbox
PV PhotoVoltaics
RBD Reliability Block Diagram
RCM Reliability-Centered Maintenance RES Renewable Energy Source
rms root mean square
SAFRI System Average interruption FRequency Index SAIDI System Average Interruption Duration Index SCADA Supervisory Control And Data Acquisition SCCER Swiss Competence Center for Energy Research SPNP Stochastic Petri Net Package
SRARPE Symbolic Hierarchical Automated Reliability and Performance Evaluator SST Solid-State Transformer
SVM Support Vector Machine UPS Uninterrupted Power Supply V2G Vehicle-To-Grid
VM Virtual Machine
VPP Virtual Power Plan VPS Virtual Power System
WAMS Wide-Area Monitoring System
WEKA Waikato Environment for Knowledge Analysis WSN Wireless Sensor Network
Chapter 1
Introduction and Motivation
A concept of Smart Grid is first introduced and frequently used Smart Grid defi-nitions are reviewed. The main needs for modernization of electric power grids, trends and enabling technologies are then explained in more detail. Following this, rising Smart Grid dependability concerns are identified, giving a broader motivation for the work presented in the manuscript. A proactive management paradigm, as one of the ways to address these concerns, is then described. Next, the addressed problem and the problem area are specified followed by a list of major contributions.
1.1
Smart Grids - A Brief Overview
Essentially, Smart Grid may be described as an electric power system that, in the light of growing demand and efforts to reduce the use of fossil fuels, relies on renewable generation as well as on enhanced control that is based on a wider adoption of ICT elements and data analytics in order to ensure sustainable elec-tric power delivery, to keep the system reliable, to make it more efficient and cost effective, as well as to provide new customer services. The Smart Grid concept is still under development and thus it lacks a formal, comprehensive and widely-accepted definition. Instead, a few definitions are used in the community, each emphasizing different aspects of Smart Grids.
The US National Institute of Standards and Technology (NIST) uses the term "Smart Grid" to refer to "a modernization of the electricity delivery system so that it monitors, protects and automatically optimizes the operation of its intercon-nected elements - from the central and distributed generator through the high-voltage transmission network and the distribution system, to industrial users and building automation systems, to energy storage installations and to end-use
2 1.1 Smart Grids - A Brief Overview
sumers and their thermostats, electric vehicles, appliances and other household devices[1]." European Technology Platform’s Smart Grid definition is more con-cise describing it as "an electricity network that can intelligently integrate the actions of all users connected to it - generators, consumers and those that do both - in order to efficiently deliver sustainable, economic and secure electric-ity supplies[2]." Major industry players such as ABB, General Electric, IBM, and Siemens as well as professional associations including CIGRE and IEEE also have their own definitions. A comprehensive overview of them and other ones may be found in[3].
Considering these and other definitions including those given in[4, 5, 6, 7, 8], in a very broad sense, Smart Grid may be described as an evolved electric power system that supports integration of Distributed Energy Resources (DERs), Re-newable Energy Sources (RES’es), Energy Storages (ES’es), and Electric Vehicles (EVs). It relies on massive adaptation of ICT components such as meters and sensors for better grid visibility at all levels, reliable and cyber-secure two-way communication, and the use of online information for provision of new services to both system operators and customers as well as methods for optimizing man-agement to meet efficiency, cost effectiveness, dependability, resilience and sus-tainability requirements.
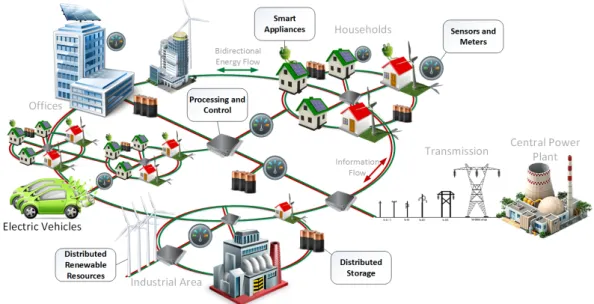
An overview of the main Smart Grid structural elements, with the focus on the distribution network is presented in Figure 1.1. This is an extended version of a figure that has been originally published in[9].
3 1.1 Smart Grids - A Brief Overview
1.1.1
Needs and Trends
The structure of today’s electric power system has not essentially changed since the end of the 19thcentury. It is based on the generation-transmission-distribution-consumption paradigm and on a unidirectional power flow[10]. With some aged and, with respect to today’s requirements, outdated components, parts of the power system are already operating at their full capacity [11] as the grid is ap-proaching its operational limits [12]. On the other hand, despite more efficient industrial processes, a demand for electricity is gradually increasing. According to EUREL’s1 forecast from 2013 [13], annual electricity demand in Europe will
rise to approximately 4300 TWh by 2050. For the comparison, electricity con-sumption in Europe in 2008 was 3043 TWh. This requires an increase in power generation but also a grid modernization in a sense of structural changes and new management strategies in order to support delivery of more power while maintaining the system’s stability. Moreover, as the process of electrification in developing countries is still ongoing, the grid is also gradually expanding.
Efforts to reduce global greenhouse gas emission drive additional changes in power systems. This includes an increase in use of electric power in industry and transportation (e.g. electric vehicles) and decrease of share of fossil fuels in electricity generation-mix by using more RES’es. EU is particularly interested in wider adaptation of renewable generation as a part of decreasing its dependency on fossil fuel import. Initiative of the EU commission is to increase the share of generation from RES’es from today’s 25% to 40% until 2020. Also, the forecasts are that renewable capacities production by 2050 will be between 50% and 80% [13]. This causes a major paradigm shift from traditional, centralized, to dis-tributed electric power generation as most of the renewable generation is based on DERs. It particularly effects distribution part of the grid as it has to support a bidirectional energy flow in order to accept a larger number of distributed gen-erators. Management strategies and protection mechanisms will also have to be adapted and improved to ensure system’s efficiency and stability especially con-sidering volatile nature of renewable generation. In fact, when well controlled, DERs may even provide an opportunity to enhance grid’s stability and depend-ability [14, 15]. Higher adaptation of DERs is also in line with energy market deregulation (liberalization) efforts that aim at increasing competition to moti-vate better, more efficient and less expensive electric power system services. On the other hand, this calls for more changes in the system management due to decentralized decision making, interdependencies and a lack of fully centralized
1EUREL - The Convention of National Association of Electrical Engineers of Europe,
4 1.1 Smart Grids - A Brief Overview
control over system components[16].
Massive adaptation of (plug-in hybrid) EVs is another opportunity to signifi-cantly reduce green-house gas emission provided a high emission share of tran-spiration in developed countries [17]. On the other hand, power demanding EVs will add a significant load to the existing distribution system and, in some cases may cause overloads as well as power quality degradations. Coordinated charging of EVs may help in overcoming some of these problems[18].
Volatile nature of DERs, their low controllability and increasing number of EVs, trigger another important change in the system operation approach from traditional, consumption-driven generation to generation-driven consumption. In fact, various Demand Side Management (DSM) strategies are already being put in place to change power demand through dynamic pricing, greater customer engagement and various other initiatives, in order to tailor consumption to the current production and state of the grid and to maintain the power balance[19]. For example, with DSM a consumption at peak hours may be decreased so that generation can meet the demand such that system’s stability is not jeopardized. At the same time DSM aims at maximizing local consumption from DERs which decreases transmission and distribution losses as well as avoiding investments in long-distance transmission lines[12].
Better control and integration of DERs, may be realized through the concept of Virtual Power Plan (VPP)[20, 21]. A VPP is a logical aggregation of DERs that, considering their place in the grid and the current status information, manages generation and presents the entire aggregation, to the rest of the system, as one, virtual generator equivalent to a traditional centralized power plant. This way, a VPP increases visibility of DERs and allows their integration into the grid. The concept of VPPs has been further expanded to Virtual Power Systems (VPS’es) that represent logical aggregations of DERs and controllable loads. That way, energy balance is optimized within a VPS and, from the perspective of the rest of the grid, the aggregation is considered as a "prosumer" that, depending on the current power balance, may be seen as a load or as a generator[22]. A similar approach is taken in Microgrids. These are distribution grids that may operate interdependently but may still be connected to the central grid.
Higher adaptation of DERs and EVs also brings new opportunities for pro-vision of ancillary services. These are additional services provided on top of real power generation and distribution, including reactive power supply, voltage and frequency control, operating reserves, energy balance, and network stabil-ity[23]. For example, a vehicle-to-grid (V2G) concept proposes to use batteries of stationary EVs to provide power to the grid in the case of unpredicted load increase and insufficient generation[24].
5 1.1 Smart Grids - A Brief Overview
1.1.2
Enabling Technologies
The backbone to fulfilling the aforementioned needs and to realize described con-cepts and trends is the ICT infrastructure that includes monitoring, data acquisi-tion, and communication infrastructures as well as advanced data analytics and simulation tools to improve grid status awareness and to provide a basis for post-mortem analysis as well as for online detection and prediction of disturbances. This information is then used for planning grid improvements and extensions and for real-time control. In addition, for implementing real-time control, it is necessary to deploy responsive actuators and control devices in order to be able to quickly react on detected or predicted events.
1.1.2.1 Monitoring and Communication Infrastructure
Grid monitoring and data acquisition infrastructure, at power distribution level, includes various meters, sensors as well as systems for data collection and ag-gregation. Automatic Metering Infrastructure (AMI) which relies on smart me-tering technologies allow not only to automatically collect consumption readings and device status information but also, using two-way communication, to con-trol these devices remotely[4]. In most of today’s implementations the control through meters, is limited to switching the power in an entire household whereas switchers and actuators may be used to control individual devices.
Various types of sensor networks, for example, the one proposed in[25], may be installed to observe the grid health-status at distribution level. In that sense, Phasor Measurement Units (PMUs) are becoming increasingly important as they provide UTC time-tagged and synchronized estimations of electricity waveforms (frequency, rate-of-change-of-frequency, and voltage/current phasors) [26] in resolution much higher than the traditional Supervisory Control And Data Acqui-sition (SCADA) systems may provide [8]. Typical sampling period of a SCADA system is between 2 s and 4 s[8], whereas modern PMUs provide measurements at every 20 ms[27]. The principle of PMU operation is based on sampling wave-forms and synchronizing them using an accurate time reference. A synchronpha-sor estimator then extracts the base tone from the sampled (raw) data collected over the PMU sampling period (observe that sampling of raw data occurs with much shorter period) and provides an estimated waveform as an output. Ob-viously, the process introduces uncertainty and the accuracy of the estimated waveforms depends on the accuracy of the time source, sampling and condition-ing unit and the synchronphasor. Details on PMU operation may be found in[26] and[28].
6 1.1 Smart Grids - A Brief Overview
Having high sampling rate and being more accurate than the other mon-itoring devices, PMUs are the central part of Wide-Area Monmon-itoring Systems (WAMS’es) and are the basis for accurate state estimation and real-time visibility of the grid and its parts[29]. Moreover, PMU data may be used for monitoring instabilities, and detecting and locating disturbances[4]. As relatively expensive devices there are mostly used at transmission level but their adoption is expected to take part also at distribution level in particular in ADNs. For example, [30] proposes a solution for integrating PMUs into monitoring system of distribution networks that have high share of renewable generation.
Smart Grids fully rely on a secure and reliable two-way communication in-frastructure for the delivery of real-time information to processing centers and for sending the control signals back to actuating devices. Smart Grid commu-nication infrastructure itself is a highly complex system that allows communica-tion between all system elements while incorporating business and home area networks to connect to office and household appliances [31]. In order to fulfill these requirements, different communication technologies have to be combined including power-line communication (PLC), fiber optics and numerous wireless solutions from Wireless Sensor Networks (WSNs), GSM, GPRS to satellite com-munication [4]. Standardization and interoperability of existing technologies represent one of the most challenging tasks when it comes to implementation of this aspect of Smart Grid concept. In that respect, remarkable efforts have been invested and considerable progress has been made with wider implementation of substations automation as well as communication standard synchronization through a number of widely promoted and accepted standards and protocols such as CIM and IEC61850[3].
1.1.2.2 Data Analytics
The process of power grid digitalization is still ongoing but, according to [32], the data volume in Smart Grids will be still greater by multiple orders of mag-nitude than in traditional grids. This includes operational data (e.g. voltage, phase, and active and reactive power measurements), non-operational data (e.g. power quality and reliability data), meter usage data (e.g. statistics on average and peak consumption), event message data (e.g. fault detection messages), and metadata (e.g. grid topology). In fact, a vast amount of data is already being collected from various devices in different formats and their unification is necessary in order to process such a data volume. This is the main motiva-tion for the development of a standard data exchange framework known as the Common Information Model (CIM) [33]. CIM defines interoperability
seman-7 1.1 Smart Grids - A Brief Overview
tics, syntax for data exchange and proposes implementation technologies. This data may be further analyzed in a centralized or distributed fashion as a part of the existing SCADA, Energy Management Systems (EMS’es) and Distribution Management Systems (DMS’es). Enablers for the data analysis are high perfor-mance and cloud computing systems [8] and the main goal is to provide more accurate and optimal grid management through better understanding of the grid state and the prediction of future state.
The current trend is mainly in statistical analysis and postmortem analysis but also in real-time state estimation[29], grid status visualization [34], and demand forecast. Future applications may include also prediction of grid disturbances (as, for example, planned in the scope of the GridEye/FNET project [34]) [8]. Also, IBM’s vision on big data in Smart Grids[35] is to use predictive analytics not only for a wide range of predictions including demand and generation forecasts and anticipation of customers’ behavior but also for the prediction of equipment downtime and grid failures.
1.1.2.3 Simulation Tools
Considering safety-critical aspects of the grid, simulation provides an affordable and safe alternative to analyze and to validate new control strategies before their deployment. A challenge for Smart Grid simulation tools is that, besides simulat-ing state of the electric infrastructure with high samplsimulat-ing rate and incorporatsimulat-ing advanced components such as PMUs [36], they must also consider ICT infras-tructure as well as their interdependency. We give a brief overview of only a few commonly used commercial and academic tools whereas a more comprehensive and an up-to-date list may be found at OpenElectrical’s page2.
• Power System Planning and Data Management (PSS)3is a set of tools pro-vided by Siemens for system planning and operation with accurate and effi-cient system analyses. This includes tools for contingency and fault analysis as well as modeling of corrective actions, analysis during changing network conditions, simulation of distributed generation, dynamic simulations in time and frequency domains and CIM-compliant data representation. It is also important to point out that PSS is frequently used as a benchmark for validation of open-source tools.
2OpenElectrical’s list of power systems analysis software,
http://www.openelectrical.org/wiki/index.php?title=Power_Systems_Analysis_Software
3Siemens Power System Planning and Data Management suite,
http: //w3.siemens.com/smartgrid/global/en/products-systems-solutions/software-solutions/planning-data-management-software/Pages/overview.aspx
8 1.1 Smart Grids - A Brief Overview
• Neplan4is Swiss-based company modular software based on MATLAB and C/C++ that provides a number of features ranging from load flow, dy-namic simulation, and optimal power flow to reliability analysis and load forecasting.
• DIgSILENT PowerFactory5, is a Windows-based integrated power systems modeling and analysis package that, besides standard power system analy-sis, includes high-end applications in new technologies such as wind power and distributed generation as well as algorithms for handling very large power systems.
• OPAL-RT HYPERSIM6 is a real-time simulation platform that supports
in-tegration of DERs and incorporates real-time monitoring, control and pro-tection features. It also supports hardware-in-the-loop testing.
• MatDyn7 [37] is an open-source software for dynamic analysis of power systems developed as an extension of MATPOWER8 [38] simulation tool for load flow and optimal power flow analysis.
• Power Systems Analysis Toolbox (PSAT)9 [39] is an open-source MATLAB-based tool for analysis and design of small to medium size electric power systems that supports power flow, continuation power flow, optimal power flow, small-signal stability analysis, and time-domain simulation. It also includes several static and dynamic models of distribution and transmission grids.
1.1.2.4 Real-Time Actuators and Controllers
In order to be able to apply management strategies based on data analytics for grid control and to quickly react to detected or anticipated problems, new types of intelligent devices and actuators must be widely deployed. Among those that are expected to significantly contribute to the system’s reliability are Intelligent Embedded Devices (IEDs), Flexible AC Transmission Systems (FACTS) and Solid-State Transformers (SSTs). IEDs may be controlled not only remotely but also provide the capability of local data processing and decision making. Different types of IEDs may also be used to control household appliances. FACTS provide control of AC transmission parameters. For example, they can alter power flow through transmission lines. Equipped with real-time control algorithms these
4Neplan, www.neplan.ch
5DIgSILENT PowerFactory, http://www.digsilent.de/index.php/products-powerfactory.html 6OPAL-RT HYPERSIM, http://www.opal-rt.com/systems-hypersim/
7MatDyn, http://www.esat.kuleuven.be/electa/teaching/matdyn/ 8MATPOWER, http://www.pserc.cornell.edu/matpower/
9 1.2 Rising Smart Grid Dependability Concerns
devices may help improving system’s reliability [40]. SSTs are lighter and more efficient than traditional transformers. Moreover, they come with new functions such as power flow control, voltage sag compensation, and fault current limita-tion[41]. As such, they are also seen as an efficient way of coping with intermit-tent nature of renewable energy generators.
1.1.3
Active Distribution Networks
A traditional distribution network is designed as a passive one with radial topol-ogy and unidirectional power flow. It accepts bulk power from the transmission grid and distributes it to customers[42]. Typically, it has a very limited monitor-ing infrastructure as most of the power flow problems are resolved at plannmonitor-ing and design time[43, 44].
With exponential growth of distributed resources (DG) that include both DERs and ES’es, distribution network is significantly changing and becoming an active part of the power system. As defined by International Council on Large Electric Systems (CIGRE)10 an Active Distribution Network (ADN) is a distribu-tion network that has systems in place to control a combinadistribu-tion of distributed energy source (generators, loads and storage) [45].
With topology changes, bidirectional energy flow and intermittent resources, more faults and disturbances may be expected at this level of the grid. This includes greater voltage variations, power imbalance and supply quality decrease in general[44]. Redundancy, as a way to ensuring network’s reliability may be too expensive and also not sufficiently efficient solution from the perspective of generated power exploitation. Therefore, novel control algorithms must be developed and put in place. This includes methods for fast online state estimation with PMUs[29, 46] as well as methods for DERs [47] and ES’es [48] integration and control for voltage and frequency regulation.
1.2
Rising Smart Grid Dependability Concerns
Compromising power system’s dependability may cause a high financial loss or may even have more severe consequences related to grid’s safety-critical aspects. According to US Department of Energy report from 2009, an annual cost of power outages and interruptions in US is at least 150 billion dollars [49]. The same report reveals that grid’s availability in US equals to 0.9997 that corresponds to more than 2.5 h of complete power interruption per year. Considering the
10 1.2 Rising Smart Grid Dependability Concerns
challenges that were reviewed in the previous subsections, we may only expect a decrease in availability if new approaches to maintain grid’s dependability are not imposed.
1.2.1
Dependability Challenges
With (r)evolution of electric power systems and foreseen changes, the risk of compromising its dependability is increasing. Here we identify, categorize and describe the main Smart Grid dependability challenges:
• Complexity and interdependency With evolution towards Smart Grid, complexity of the system is rapidly increasing, and ensuring its dependabil-ity becomes more difficult, especially when taken into account that Smart Grid closely combines electric power and ICT infrastructures. As such, it is a good example of a system-of-systems whose operation and management requires to combine knowledge and best practice from various domains. Since a systematic approach to Smart Grid dependability does not exist at this time, the danger is that dependability may be compromised due to generally different approaches in the two communities (ICT and electric power), including diverse terminology for dependability attributes and fre-quently interchangeable use of terms[50], different understanding of ba-sic concepts such as fault, error and failure, and different figures of merit for the quantification of dependability attributes. Moreover, with growing interdependency between ICT (cyber) and electric power (physical) infras-tructures, components’ failures may propagate from one infrastructure to another[51], causing errors and failures.
• Structural changes. Generation paradigm shift and bidirectional energy flow significantly change grid’s structure, especially at the distribution level. Protection systems are designed with unidirectional power flow in mind [14] and they may fail to ensure reliability when the flow is bidirectional. Moreover, due to deregulation and economic reasons, the system is be-coming more congested, has fewer redundant components and frequently operates at its full capacity.
• Increasing number of faults. Due to growing complexity, we may expect an increase in the number of faults and also new types of power grid faults in the near future [52]. Aging infrastructure and smaller energy margins may also cause an increase in the number of faults. Finally, as the com-plexity increases, more human faults may also be expected.
11 1.2 Rising Smart Grid Dependability Concerns
• Uncertainties. With the market deregulation, the level of uncertainty in power systems has increased significantly [53]. This includes uncertainty on availability of generators, transmission and distribution lines, electricity prices as well as uncertainty on load and (renewable) generation forecasts that are frequently weakly correlated with real production and consump-tion [5]. Volatile nature of RES’es particularly contributes to the uncer-tainty of electric power generation. Moreover, with growing demand and introduction of EVs as power-demanding loads, predicting customers be-havior is ever-more important and, at the same time, more challenging. • Cyber security. As the Smart Grid expands and incorporates more ICT
el-ements, from servers to embedded devices and even novel technologies as Internet-of-Things (IoT), it opens a door to a plethora of attack opportuni-ties that bring its security concerns to an extreme [54]. Practically, every connected device (e.g. a smart meter or a household appliance) is a poten-tial gateway for a cyber-attack[4]. Some of these attacks may also cause malfunction of power equipment, disturbances and outages, thus reducing power delivery service availability. In fact, a few recent outages are be-lieved to have been caused by cyber-attacks (e.g. those reported in [55]). All of this is threatening to increase the number and severity of disturbances, including voltage and frequency deviations as well as brownouts (long-term volt-age drops) and blackouts. For example, one such blackout occurred in Amster-dam (that is considered to be an advanced-stage Smart City with a Smart Micro-grid), in March 2015 affecting almost 3 million people [56]. In [57] we have reviewed almost 40 recent events such as this one. Many of these events have left tens and hundreds of millions of people without electricity for tens of hours. This obviously demonstrates the need for new methods for grid management.
1.2.2
A Need for Revision of Power Grid Reliability Standards
Power grid reliability standards, that are still in use, have been defined in 1950s and need to be fundamentally reviewed in the light of the grid evolution[15]. In brief, these standards mainly require sufficient redundancy to ensure reliability and do not consider Smart Grid solutions based on, for example, real-time moni-toring and control and energy storage. As such they are not economically efficient as the result is low utilization of assets and higher operational cost. Moreover, the current standard is deterministic in the sense that the system is considered as free of risks of disturbances as long as no operational limits are violated (e.g.
12 1.2 Rising Smart Grid Dependability Concerns
all voltages and frequencies are in a defined range), and in an unacceptable level of risk if operating limits are violated. A more realistic approach would be to es-timate the risk of a disturbance at runtime considering current system state and previously observed disturbances.
On the other hand, understanding dependability of Smart Grid and proposing new standards is difficult as the concept is still under development and the grid is evolving gradually. There is still not sufficient data to model and to evaluate dependability and to design new methods for its enhancement. Even when dis-turbance data is available, for example in industrial pilots, due to high sensitivity and security concerns, such data is rarely, if at all, available for public use.
1.2.3
Dependability of Active Distribution Networks
As distribution grids are rapidly evolving towards Active Distribution Networks, there is a concern that dependability of this part of the grid may also be affected to a greater extent. In fact, Distribution System Operators (DSOs) are already faced with disturbances such as voltage variations and congestions [44]. Over-voltage is a common problem that occurs at a DER connection point and the surrounding area. Reverse power flow may also occur due to a DER generation that compromises dependability as protection schemes in a radial distribution network that are designed with unidirectional flow in mind.
Voltage sags and swells are particularly dangerous as they may damage volt-age sensitive equipment[58]. As defined by IEEE standard 1159 [59], a voltage sag (dip) is a decrease in voltage root mean square (rms) value to between 0.1 and 0.9 from the nominal value for a duration of 0.5 cycle to 1 minute. Similarly, a swell (surge) is an increase of rms to between 1.1 and 1.8 of the nominal value for 0.5 cycle to 1 minute. Voltage problems in general are identified as the most severe ones in distribution grids as frequency is regulated at higher levels. In fact, voltage disturbances are also observed in some mid-size ADNs such as the one in Rheinfelden, Switzerland and that has been analyzed in the scope of the VEiN11project.
A congestion is a type of power imbalance that occurs when a distributed gen-erator pushes the system beyond its physical limits causing a power interruption. An imbalance may also occur when local generation is not sufficient to meet the demand. In principal, DERs may help ADN’s dependability if well controlled and if sufficiently close to points of consumption. Unfortunately, this is not always the case as DERs, in most cases, cannot be dispatched[44].
13 1.3 Proactive Management Concept
There are several ways of coping with disturbances in ADNs for improved dependability. Redundancy is the most obvious one but it is not always efficient. More sophisticated solutions include different protection algorithms as the ones proposed in [14], coordinated distributed generation and load control schemes as in[47] and [60] as well as methods based on distributed storage control such as, for example, the one proposed in [61]. Finally, methods based on online prediction of oscillations as well as voltage sags and swell as in [62] and [63] are also being proposed.
1.3
Proactive Management Concept
Traditional approaches to electric power grid operation are essentially reactive and based on detect-localize-repair paradigm. If a disturbing event is detected (e.g. a voltage sag, a frequency deviation or a line trip), a fault location is first determined and corrective actions are taken (e.g. load shedding) to bring the system back to a stable state and to prevent disturbance propagation. As previ-ously pointed out, this traditional reactive approach becomes insufficient in the face of increasing complexity, uncertainties, interdependencies as well as higher number and new types of faults and disturbances.
With the ability to collect and to analyze increasing amount of data in real time, we observe a rapid paradigm shift in all industrial spheres from analyzing the past and monitoring the present, to predicting and prescribing the future (as on the Figure 1.2 from Gartner12). For systems such as Smart Grids and others, we used to ask questions like what happened and why it happened but now with the ability to collect more data and with rapid processing capability, we are or will be able to ask questions about the future: what will happen and what can we do about it? Obviously, the level of difficulty increases but so does the expected level of dependability, as knowing about future problems gives a possibility to prepare for them and to handle them more efficiently.
Managing the grid proactively, in the sense of predicting future problems by using data analytics and acting in their anticipation to prevent or to mitigate them, may significantly improve grid’s dependability and is identified as one of the pillars of Smart Grid’s dependability [8]. In this sense, we may differenti-ate between two types of proactive management based on prediction of failures [64]: predict-prevent and predict-mitigate. In the first case, after a prediction of a failure (or a disturbance) actions are taken to avoid it. For example, in
12Gartner IT Glossary, Predictive Analytics:
14 1.3 Proactive Management Concept
Figure 1.2. System management paradigm evolution.
a cloud environment, virtual machines may be migrated to another host when a failure of the main host is predicted. In power systems, for example, we may use controllable distributed generators when a voltage sag at a specific location is predicted. This boosts availability when compared to typical reactive approaches as downtime is, in an ideal case, fully avoided.
Still, not all problems may be anticipated in advance and prevented. In cases when the prediction lead time is not sufficient for prevention, or when prevention is not possible, we may still prepare the system for the recovery so as to decrease recovery-associated downtime. For example, a cold spare might be started when a failure of a server is predicted. In power systems, a maintenance team may be directed to a specific location when a failure of a component is predicted. Also, the cost of false positive predictions must be taken into account as a mitigation triggered by a false alarm may cause unnecessary downtime.
Proactive management and predictive analytics have already found their way to the power grid and are used for predictive maintenance[65] and mainly load forecasting[66]. However, to the best of our knowledge, a comprehensive proac-tive approach that specifically aims at improving availability of Smart Grids, by predicting disturbances, has not been proposed to date.
15 1.4 Problem Statement
1.4
Problem Statement
Massive introduction of renewable generation, market deregulation, new opera-tion paradigms and other Smart Grid trends drive numerous changes in electric power systems, especially at the distribution level, that result in new challenges to Smart Grids dependability, and dependability of ADNs in particular. Hence, with power grid’s digitalization we also need new dependability management approaches and methods.
Efforts towards more dependable grid, that in great part rely on ICT infras-tructure, include, among others, new demand side management programs[8] for better power balance and real-time state estimation[29] for improved grid status awareness, and faster and better detection of disturbances and other problems. Complementing and extending these efforts, the goal of this thesis is to develop a methodology and to design methods for prediction of disturbances in ADNs us-ing voltage sags as a case study. With this we want to pave the way for proactive management methods to additionally enhance availability of electric power de-livery service, and thus to contribute to a more trustworthy grid. The motivation for adopting such an approach are numerous research results in failure predic-tion developed for industrial systems, such as, for example telecommunicapredic-tion systems[67], high-performance computing systems [68], as well as commercial computer systems that exploit predictions for enhancing availability including IBM XIV storage system [69], IBM predictive management [70] and HP Backup Navigator[71]. More examples of systems with proactive fault management may be found in[72].
The backbone of the approach is in the use of accurate grid-status data (e.g. from PMU devices whose number is steadily increasing) to predict a disturbance and to take proactive corrective actions (e.g. with a distributed storage, a con-trollable generator or a tap changer) to prevent it or to mitigate it.
1.4.1
Challenges
Even though it is appealing to assume that, with more ICT elements in power grids, proactive management methods, as used in computer systems, may be simply transferred to the new field of application, their adaptation comes with numerous challenges:
• Identification and classification of Smart Grid faults and failures. With grow-ing complexity and interdependency between cyber and physical Smart Grid infrastructures and higher penetration of RES’es, the number of faults
16 1.4 Problem Statement
and disturbances is expected to increase but also new types of faults are expected to appear. This requires to identify and to classify faults and dis-turbances as a part of a comprehensive approach to Smart Grid depend-ability.
• Determination of the efficiency of proactive approach for enhancing system’s
availability. Despite encouraging implementations of proactive approaches in computer systems, there are still no models and figures of merit that would allow to evaluate to what extent, for which failure prediction qual-ity, and under what conditions availability of a system may be enhanced with proactive (predictive) approaches. Such models and metrics must be developed to determine the efficiency of proactive approaches on sys-tem’s availability in general before proposing their application for enhanc-ing Smart Grid’s availability.
• Development of proactive methodology and methods for fault management in
Smart Grids. A proactive fault-management methodology has to be defined for Smart Grids and appropriate methods for prediction and mitigation of disturbances identified. This also includes acquisition of data for prediction algorithm training and evaluation.
• Quantification of power delivery service availability and evaluation of
proac-tive methods. Comparing the existing and the proposed Smart Grid fault-management methods requires their evaluation with respect to availability enhancement that has to be quantified.
In addition to these challenges, the fact that the Smart Grid as a concept is constantly developing and improving brings new problems due to lack of depend-ability standards in Smart Grids and standardized models for system simulation that consider its cyber and physical aspects to allow evaluation of different man-agement approaches. Another difficulty is that the data on disturbances in power grids are rarely, if at all, publicly available.
1.4.2
Goals and Objectives
To tackle these challenges and problems for the sake of achieving the goal of the thesis, we aim at meeting the following objectives that also drive the dissertation work-flow:
1. Propose definitions for Smart Grid dependability attributes, develop
17 1.4 Problem Statement
This should provide unambiguous communication platform between var-ious Smart Grid communities and, along the lines of the thesis goal, it should also help in identifying new types of faults and proper figures of merit of grid dependability and availability in particular.
2. Develop a model and metrics to evaluate to what extent availability of a
sys-tem may be enhanced with a proactive approach and how this depends on the quality of prediction. The model should be sufficiently general, easily ap-plicable and understandable so as to provide better insights into the effect of a proactive failure management on availability of a system.
3. Define a methodology for proactive management of disturbances in Smart
Grid (and Active Distribution Networks in particular) and identify methods for the implementation. As accurate and effective disturbance prediction is the core of the approach it deserves particular attention. This includes identification of requirements for monitoring infrastructure, identification and adaptation of methods for the selection of features and finally methods for the prediction (e.g. by adopting the ones reviewed in[72]).
4. Develop and implement a simulation environment to synthesize
disturbance-related data that can be used for disturbance analysis and prediction. In the absence of field data, generation of disturbance-related data through sim-ulation is an alternative. In this respect, fault injection, that is used in computer systems for the evaluation of fault-tolerance policies and predic-tion methods [73] may be employed. Simulations must be performed for relevant models (that also need to be defined) and for different settings including different load and generation profiles that simulate system dy-namics, and behavior of the systems in the presence of different types of faults. In this regard, faults identified in the scope of the Objective 1 should be used.
5. Case Study: Implement disturbance predictor and evaluate the approach for
management of voltage sags in Active Distribution Networks. Evaluate the approach defined in the scope of the Objective 3 for the case of prediction of voltage sags in distribution networks in the presence of distributed gen-eration and variable gengen-eration and load. Use the framework implemented in the scope of the Objective 4 for the generation of voltage sag data. Iden-tify an appropriate mitigation mean and quanIden-tify availability enhancement using the model from the Objective 2.
18 1.5 Contents and Contributions
1.5
Contents and Contributions
The rest of the manuscript is organized as follows:
• In Chapter 2 first basic dependability concepts as well as modeling and evaluation methods and tools are introduced. This includes definition of dependability attributes and figures of merit, means to attain dependabil-ity, the fault-error-failure concept as well as a brief description of com-monly used modeling and evaluation tools. Also, considering recent ap-proaches based on prediction of disturbances, we present our extension of a taxonomy of fault-tolerance policies. Then, modeling Smart Grid as a cyber-physical system (CPS), a unified approach is taken to define its de-pendability by combining approaches and definitions from computer and power systems communities. A large set of previous blackouts (close to 40) has been analyzed to identify most common root causes, to identify their main properties and to conduct their classification in a form of a developed taxonomy. Finally, appropriate figures of merit for quantification of Smart Grid availability are identified.
• Related work is reviewed in Chapter 3. First a traditional approach to power grid dependability is explained followed by an overview of recent research in Smart Grid dependability modeling and evaluation. Proac-tive management approaches and prediction-based methods are then re-viewed. The section concludes with a description of relevant Smart Grid pilot projects.
• In Chapter 4 the impact of predictive (proactive) management on avail-ability is analyzed. First a generic model of a predictive management is defined considering the quality of failure prediction and the cost of distur-bance mitigation actions. Then, a metric for optimizing failure prediction for enhanced availability is proposed and a sensitivity analysis of the ap-proach with respect to model parameters is conducted. The main contribu-tion of this part of the work is that the derived model and the metric may be used to identify if a proactive approach may be applied to the specific system and what the minimum prediction quality requirements are. Also, derived model and equations may be used to maximize availability when a proactive approach is used.
• A methodology and methods for online disturbance prediction are described in Chapter 5. Also a methodology, methods and tools for the design of a disturbance predictor are proposed.
19 1.5 Contents and Contributions
• Developed framework for disturbance-related data generation is described in Chapter 6. The framework is based on simulation and fault injection following successful examples of implementing a similar approach for syn-thesizing failure data in computer systems for failure predictor training and evaluation. The framework is developed as fully modular so that system simulator, monitor and disturbance detector may be clearly distinguished. The final output of the framework is a set of time tagged and classified in-stances. An instance represents a set of values of selected variables (volt-ages, phasors, etc.). Each instance may be classified as disturbance-free or related with a specific disturbance. The generated data set must be fur-ther conditioned before being used for training a prediction algorithm. The same data set maybe used for training and evaluating online disturbance detectors.
• The case study is presented in Chapter 7. We evaluate if and to what extent voltage sags may be predicted in an Active Distribution Network (ADN). Us-ing the developed simulation framework we first simulate behavior of an ADN in the presence of short-circuit balanced faults that cause voltage sags in different parts of the network. We record and condition the data so that it may be used with the classification-based machine learning algorithms. We then perform feature selection to identify the most indicative features and evaluate with what quality of prediction sags may be predicted. We also evaluate how the prediction quality varies with monitoring sampling pe-riod, lead time and the size of the prediction window. Finally, we optimize the prediction to maximize availability of an ADN and compare availability gain measured with downtime decrease.
• Chapter 8 concludes the work, reviews the contributions and gives direc-tions for the future work.
Chapter 2
Terminology, Concepts and Taxonomies
As dependability is a mature field in computer systems with well-defined and widely-accepted terms and terminology, basic dependability concepts, as used in computer systems, are first introduced. This includes definitions of dependability attributes and figures of merit, description of means to attain dependability, the fault-error-failure concepts as well as a brief overview of commonly used model-ing and evaluation tools. Also, considermodel-ing recent approaches based on predic-tion of disturbances, we present our extension of a taxonomy of fault-tolerance policies.
Then, we present our unified approach to Smart Grid dependability that we modeled as a cyber-physical system (CPS). In fact, our unified model is built by combining approaches and definitions from computer and power systems com-munities. A large set of reported blackouts (close to 40) has been analyzed to identify the most common root causes, to identify their main properties and to conduct their classification by proposing a fault taxonomy. The proposed set of definitions and the taxonomy contribute to better communication between the two communities as a mutual understanding platform. Also, it gives a unique overview of the range of faults that may occur in Smart Grids and help to better understand Smart Grid dependability threats. Moreover, the taxonomy facilitates the application of dependability evaluation methods, such as fault injection.
Finally, appropriate figures of merit for quantification of Smart Grid availabil-ity are identified.
A part of the work presented in this section has been published[57]. 21
22 2.1 Overview of Basic Dependability Concepts
2.1
Overview of Basic Dependability Concepts
Dependability is the ability of a system to perform a required service under stated conditions for a specified period of time. A dependable system is the one which delivers a required service during its lifetime.
As an umbrella term, dependability integrates the following attributes[74]: • Availability: readiness for correct service,
• Reliability: continuity of correct service,
• Safety: absence of catastrophic consequences on the user(s) and the envi-ronment,
• Integrity: absence of improper system alterations, and
• Maintainability: ability to undergo modifications and repairs.
Security, that is mostly addressed separately, integrates availability, integrity and confidentiality (the absence of unauthorized disclosure of information)[74]. An important concept in dependability is the fault-error-failure one. If a fail-ure occurs, delivered service deviates from the correct one. An error is a deviation of a system’s state from the correct state, and a fault is a root cause of an error [74]. In addition, Salfner, Lenk and Malek distinguish between detected unde-tected and deunde-tected errors (an error is undeunde-tected as long as a detector does not identify an incorrect state)[72]. A failure of one component may also propagate to another components or cause a fault at higher levels of system hierarchy. A failure of a component may be a fault from the system’s point of view as long as it does not cause deviation of the system’s state.Once activated, the fault will cause an error that, if affecting the service provided to the user, propagates to a failure.
According to[74], means to attain dependability include:
• Fault prevention (also called fault avoidance or fault intolerance): preven-tion of occurrence or introducpreven-tion of faults,
• Fault tolerance (FT): avoidance of service failures in the presence of faults. Also, capability to continue the correct operation in the presence of faults, • Fault removal: reduction of the number and severity of faults, and
• Fault forecasting: estimation of the present number, the future incidence, and the likely consequences of faults as well as prediction of failures. In this work, we focus mainly on fault tolerance. Considering novel tech-niques based on online prediction of failures, we extend taxonomy of fault-tolerance techniques, originally developed by Avizienis et. al[74]. The taxonomy
23 2.1 Overview of Basic Dependability Concepts
is presented in Figure 2.1. Parts that are present in the taxonomy from[74] are written in italics, whereas classes of techniques are presented in rectangles.
Figure 2.1. Taxonomy of fault-tolerance techniques.
Error detection may be performed concurrently or by interrupting the main process to check the system for errors. In concurrent error detection techniques, for example, health-status (as in [75]) or the system load (as in [76]) may be estimated by online monitoring system parameters (also called features or vari-ables). For a computer system and ICT components these parameters may be: memory usage, CPU activity and temperature, disk activity, number of exceptions or fan speed. For a power systems and its components these parameters may be voltages, phasors, and component temperatures. Failure prediction may be per-formed by: failure tracking, symptom monitoring, detected error reporting, and undetected error auditing [72]. The same or a similar set of error- and fault-handling techniques that are identified in [74] as system recovery techniques, may be used to prevent errors and failures when triggered based on the results of the state estimation or failure prediction. When a failure is anticipated, the system can be prepared for a recovery. In computer systems this may be done by creating a checkpoint on-demand, preparing a spare components, performing a failover or by applying similar techniques. In power systems, for example, a spare