HAL Id: hal-02319530
https://hal.archives-ouvertes.fr/hal-02319530
Submitted on 18 Oct 2019
HAL is a multi-disciplinary open access
archive for the deposit and dissemination of
sci-entific research documents, whether they are
pub-lished or not. The documents may come from
teaching and research institutions in France or
abroad, or from public or private research centers.
L’archive ouverte pluridisciplinaire HAL, est
destinée au dépôt et à la diffusion de documents
scientifiques de niveau recherche, publiés ou non,
émanant des établissements d’enseignement et de
recherche français ou étrangers, des laboratoires
publics ou privés.
Targeted Magnetic Intra-Lysosomal Hyperthermia
produces lysosomal reactive oxygen species and causes
Caspase-1 dependent cell death
Pascal Clerc, Pauline Jeanjean, Nicolas Hallali, Michel Gougeon, Bernard
Pipy, Julian Carrey, Daniel Fourmy, Véronique Gigoux
To cite this version:
Pascal Clerc, Pauline Jeanjean, Nicolas Hallali, Michel Gougeon, Bernard Pipy, et al.. Targeted
Magnetic Intra-Lysosomal Hyperthermia produces lysosomal reactive oxygen species and causes
Caspase-1 dependent cell death. Journal of Controlled Release, Elsevier, 2018, 270, pp.120-134.
�10.1016/j.jconrel.2017.11.050�. �hal-02319530�
OATAO is an open access repository that collects the work of Toulouse
researchers and makes it freely available over the web where possible
Any correspondence concerning this service should be sent
to the repository administrator:
tech-oatao@listes-diff.inp-toulouse.fr
This is an author’s version published in:
http://oatao.univ-toulouse.fr/24543
To cite this version:
Clerc, Pascal and Jeanjean, Pauline and Hallali, Nicolas and Gougeon, Michel
and Pipy, Bernard and Carrey, Julian and Fourmy, Daniel and Gigoux,
Véronique Targeted Magnetic Intra-Lysosomal Hyperthermia produces
lysosomal reactive oxygen species and causes Caspase-1 dependent cell death.
(2018) Journal of Controlled Release, 270. 120-134. ISSN 0168-3659
Official URL:
https://doi.org/10.1016/j.jconrel.2017.11.050
Targeted Magnetic Intra-Lysosomal Hyperthermia produces lysosomal
reactive oxygen species and causes Caspase-1 dependent cell death
Pascal Clerc
8'
b, Pauline Jeanjean
3•
h,
Nicolas Hallali
8,
Michel Gougeon
C,
Bernard Pipy
d,
Julian Carrey
8,
Daniel Founny
3•
h,
Véronique Gigoux
a,
b,
*
a Laboratoire de Phys/Jlm et Chimk des NOM-Objets, CNRS UMR5215-mSA, Univemti de Toutous,, m, Tculouse, Prome
b msERM ERI.12
26, ReceptOlogy and Ta,geœd 1heropy of Comers, Tculouse, France • Universlii de rouleuse 3/CNRS, CIRIMAT, Toulouse, Fronœ
d UMR 152-Plnmrl-Dev, Univenlli de Toulouse, 31432 Toulous,,, Franœ
ARTICLE INFO
ABSTRACT
Keywords:
Cell death Cancer Caspase-1
Magnetlc hyperthennla
Lysosome membrane penneabllizatlon Cathepsln-B
Therapeutic strategies using drugs which cause Lysosomal <:cil Death have been proposed for eradication of resistant cancer cells. In this context, nanotherapy based on Magnetic Intra-Lysosomal Hyperthermia (MILH) generated by magnetic nanoparticles (MNPs) that are grafted with ligands of receptors overexpressed in tumors appears to be a very promising therapeutic option. However, mechanisms whereby MILH induces cell death are still elusive. Herein, using Gastrin-grafted MNPs specifically delivered to lysosomes of tumor cells from different cancers, we provide evidences that MILH causes cell death through a non--apoptotic signaling pathway. The mechanism of cell death involves a local temperature elevation at the nanoparticle periphery which enhances the production of reactive oxygen species through the lysosomal Fenton reaction. Subsequently, MILH induces lipid peroxidation, lysosomal membrane permeabilization and leakage of lysosomal enzymes into the cytosol, in cluding Cathepsin-B which activates Caspase-1 but not apoptotic Caspase-3. These data highlight the clear po tential of MILH for the eradication of tumors overexpressing reœptors.
1. Introduction
Cancer is a leading cause of death with millions of new people di agnosed with cancer every year. One major reason that limits outcome and drug response of anti cancer therapies is multidrug resistance (1). However, reœnt studies have shown that cancer cells resistant to tra ditional therapies can be sensitive to agents which induce lysosomal cell death through lysosome membrane pa-meabilization (LMP) (2). In fact, LMP can be triggered by a wide variety of stimuli including death ligands, oxidative stress and treatment by lysosomotropic agents (3). In
some circumstances (i.e. treatment by lysosomotropic agents), LMP
appears to be an early event triggering apoptosis whereas in others (i.e. treatment by death ligands), LMP results from the activation of apop tosis signaling pathways and contributes to the amplification of death signais.
Alternatively to these above agents, we (4) and others (5,6) have reœntly proposed that Magnetic Intra Lysosomal Hyperthermia (termed MILH), induced by application of a high frequency altemating magnetic field (AMF) to cells containing magnetic nanoparticles (MNPs) in their lysosomes, is an effective way to specifically trigger
lysosomal cell death in cancer cells (7). This is the result of the heat released by MNPs when exposed to AMF. Moreover, MNPs offer the potential to be driven into lysosomes of tumor cells by grafting them with ligands or antibodies that recognize receptors overexpressed in tumors. Subsequently to their activation, receptors are intemalized together with ligand grafted MNPs and traffic to lysosomes [ 4,5). Using this strategy, we showed that minute amounts of iron oxide MNPs targeting gastrin reœptors (CCK2R), overexpressed in most endocrine tumors, caused the death of cancer cells upon AMF exposure, making this appro ach an attractive therapeutic option [ 4,8). Strikingly, in this study, as in others, no perceptible temperature rise in the cell medium occurred during AMF exposure [ 4 6). Thus, MILH differs from standard magnetic hyperthermia whereby tumor eradication is achieved with large doses of MNPs which cause a temperature elevation of the whole tumor (9). However, it cannot be excluded that MILH also contributes to cell death during standard magnetic hypa-thermia experiments since small amounts of MNP injected intra tumourously could be intemalized by cancer cells. In MILH, it is expected that MNPs, even oflow heating power (Specific Absorption Rate), generate a local temperature rise causing LMP (4 6,10). However, this appealing hypothesis has never • Correspondlng author at: INSERM l!RL1226, 1 Avenue du Professeur Jean Poulhes, F-31432 Toulouse, France.
E-mail ad<Fess: veronique.gigoux@insermfr (V. Gigoux). https:/ /doi.org/10.1016/j.jconrel.2017.11.050
overnight and incubated with Gastrin MNPs (16μg Fe/ml) for 24 h at 37 °C in medium buffered with 10 mM HEPES buffer pH 7.4 containing 0.5% FBS and 100 IU/ml penicillin streptomycin to allow Gastrin MNPs internalization and accumulation in lysosomes. Incubation medium was withdrawn and cells were rinsed twice with incubation medium and then incubated with 5 mM NAC, 1 mM DFO, 1 nM BafA1, 20μM ART, 10μM CA 074 Me, 2.5 μM Caspase 1 inhibitor or 10 μM Caspase 3 in hibitor for 1 h or 120μM FeCl3for 4 h and exposed to AMF (275 kHz, 40 mT) for 2 h using a commercial magnetic inductor (Fives Celes, Lautenbach, France) as previously described[4]. The temperature of the Cellview dish was maintained at 37.0 ± 0.2 °C and controlled using a thermal probe (Reflex, Neoptix, Canada) placed in the incuba tion medium of the cells. At the end of the experiments, cells were placed in a humidified atmosphere at 5% CO2 and 37 °C. Different biological effects were analyzed following AMF exposure and sum marized in Supplementary Table 1.
2.4. Determination of cell death
The effects of AMF treatment were investigated as follows: first, cell survival was determined 24 h post AMF treatment using a MTT viability assay. Secondly, dead cells labeled with AnnexinV iFluor488 and pro pidium iodide (excitation: 488 and 540 nm respectively, AAT Bioquest) were counted 4 h after the end of AMF exposure as described before[4]. To analyze cell death in INR1G9 CCK2R overexpressing GFP CathB or Casp1 fusion protein, INR1G9 CCK2R cells were seeded at a density of 25 × 103cells/cm2cells onto 35 mm dishes and transfected with 3μg of pCathB eGFP, pCathB C29A eGFP (given by Klaudia Brix, Jacobs Uni versity Bremen, Germany) or pMSCV2.2 IRES GFP Caspase 1 C284A (given by Dr. Petr Broz, University of Basel, Switzerland) using Lipo fectamine 2000 reagent (Life technologies). 4 h post transfection, cells were seeded onto 4 compartment Cellview dishes (Greiner Bio One) at a density of 25 × 103cells/cm2, grown overnight and incubated with Gastrin MNPs (16μg Fe/ml) for 24 h at 37 °C in medium buffered with 10 mM HEPES buffer pH 7.4 containing 0.5% FBS and 100 IU/ml pe nicillin streptomycin. Cells were rinsed twice with incubation medium, exposed to AMF for 2 h, labeled with AnnexinV iFluor555 (excitation: 540 nm, AAT Bioquest) 4 h after the end of AMF exposure and counted. Counting of labeled cells was carried out by analyzing confocal mi croscopy images (LSM510 confocal microscope, Zeiss) representing populations of 2000 3000 cells/experiment using ImageJ software. 2.5. Analysis of ROS production
INR1G9 CCK2R cells were seeded 24 h before the experiments onto 4 compartment Cellview dishes (Greiner Bio One) at a density of 25 to 50 × 103cells/cm2and incubated with Gastrin MNPs (16μg Fe/ml) for 24 h. Cells were rinsed twice with incubation medium and incubated with 5 mM NAC, 1 mM DFO, 1 nM BafA1, 20μM ART for 1 h or 120 μM FeCl3 for 4 h. For total ROS production analysis, cells were exposed to AMF for 2 h, rinsed with incubation medium, incubated with CellROX Green reagent (Molecular probes, Excitation wavelegnth: 488 nm), immediately after AMF exposure, in incubation medium according to manufacturer's instructions and quantification of ROS production was performed by analyzing the intensity of CellROX Green reagent labeling of confocal microscopy images (LSM780 confocal microscope, Zeiss) using Image J software. 2000 3000 cells/experiments were analyzed in at least 4 independent experiments. For initial ROS production analysis, cells having or not internalized Gastrin MNPs were incubated in the presence or absence of 1 mM DFO, 1 nM BafA1, 20μM ART or 120 μM FeCl3 and then with CellROX Green reagent (Molecular probes, Excitation: 488 nm) in incubation medium according to manufacturer's instructions, exposed to AMF for 30 min, rinsed with incubation medium and ROS production was analyzed using confocal microscopy (LSM780 confocal microscope, Zeiss) immediately after AMF exposure. Initial ROS production was quantified by fluorescence intensity ratio of been directly proven experimentally. Moreover, the precise mechan
isms leading to cell death by MILH remains largely unknown. Insight into these mechanisms is essential to optimize this approach in a therapeutic perspective.
To date, molecular mechanisms of lysosomal cell death of epithelial cells were mainly elucidated using lysosomotropic agents or death li gands which do not exclusively target lysosomes of cancer cells [11 13]. Lysosomal cell death through apoptosis was demonstrated to involve the release of lysosomal hydrolases into the cytosol, especially Cathepsin D and Cathepsin B (CathB) which digest apoptosis regulated proteins, leading to mitochondrial outer membrane permeabilization (MOMP) and apoptotic caspases activation [3,14].
The aim of this study was to elucidate the cellular and molecular mechanisms involved in cancer cell death induced by MILH. Here, we report that, under an AMF, lysosome accumulated MNPs increase the temperature very locally and enhance reactive oxygen species (ROS) production through the Fenton reaction within lysosomes. This causes lipid peroxidation of lysosome membrane, LMP and subsequent cell death by a non conventional mechanism which is dependent on Caspase 1 and CathB but independent of apoptotic Caspase 3. These major advances in the understanding of the cell death mechanism oc curring during MILH will facilitate optimization of the strategy in a therapeutic perspective.
2. Material and methods 2.1. Nanoparticles functionalization
The synthesis method and characterization of the magnetic nano platform used in the present article have been previously described [4]. The nanoplatform (Gastrin MNP) is composed of commercial iron oxide magnetic nanoparticles (MNPs) coated with PEG Amine (Gecco Dots, Sweden) and decorated with 100 molecules of a synthetic replicate of gastrin (Covalab) and 20 molecules of the fluorescent label NHS DY647 PEG1 (Dyomics GmbH, Jena, Germany). The size of the mag netic core determined by transmission electron microscopy was 8.7 ± 1.6 nm. The specific absorption rate of these MNPs is 13 W/g Fe at 275 kHz and 40 mT. N acetyl cystein (NAC), Desferroxamine (DFO), Bafilomycine A (BafA1), Artesunate (ART) and FeCl3 were purchased from Sigma Aldrich. CA 074 Me and Caspase 3 inhibitors were from ApexBio. Caspase 1 inhibitor was from Santa Cruz Biotechnologies. 2.2. Cell lines
The glucagon producing Hamster tumoral cell line INR1G9 stably expressing CCK2R (INR1G9 CCK2R) obtained as previously described [15] and the Thp1 human macrophage/monocyte cell line were cul tured in RPMI1640 medium containing 10% fetal bovine serum (FBS) and 100 IU/ml penicillin/streptomycin (Life technologies). The HEK293 cells (Flp In system, Invitrogen) stably expressing the CCK2R, named HEK CCK2R, and the clone B13 of AR4 2J cells (kindly provided by Pr Timo Otonkoski, University of Helsinki, Finland, with the per mission of Dr. Itaru Kojima, Gunma University, Maebashi, Japan) were cultured in DMEM medium containing 10% fetal bovine serum (FBS) and 100 IU/ml penicillin/streptomycin (Life technologies). The AGS gastric adenocarcinoma cell line was permanently transfected with CCK2R (AGS CCK2R) driven by the EF1 α promoter under puromycin selection and grown in DMEM/F 12 medium supplemented with 10% FBS and 100 IU/ml penicillin/streptomycin [16]. The cells were grown in a humidified atmosphere at 95% air and 5% CO2 at 37 °C.
2.3. Cell treatment by alternating magnetic field
Cell treatment by alternating magnetic field (AMF) was performed as follows. Cells were seeded into 4 compartment Cellview dishes (Greiner Bio One) at a density of 25 to 50 × 103 cells/cm2, grown
a
Gaatrin. DY647 MNP intemalizationb
10 C O 8�
:,-.,-e:
s
a. .. 1/) .0 0,; ': � 4..
-:a
� 2 0 DFO*
■
FeCl3**
O BafA1,...,..*
;,;;*
....,--. �
C ART**
0 �����***
Gastrin-MNP -AMF ··+++++d
Gastrfn-MNP AMF + +AMF + + 4h post-AMF 24h post-AMF 40 .;***
***
>�
30 ;il ::::-High frequencyalternating magnetic field
';i _g u C 200
8
(275 kHz, 40 mT) 1 1 Il 1 1 1 1 1 1 Il 1 1 1 1 1 1 1 1 1'''''''
,,,,,,,
,.,.,. ♦ ���
0 Gastrin-MNP • + • + AMF ·+ ·+++ sP!
10� :l: .5 0L sosome membrane rmeabilization Cell death
C
o. z � u, .!: 0 !:"'
..
a: Cl.,
u �100 u "' 75e
0 50 :, ; 25.,
. . . 1 • . . • . : . .�
�
�
�
�
.�••••••
i
0 ' ' '�
e
-40 "; 35"'
..
� 30 u � 25-i
C 20.,
_Ë 15 � 10 C.,
:il
5.,
� 0u::
-5.
.
�
.
3 2 0 ODFO■
FeCl3 0 BafA1 CART 1 Gastrin-MNP + + + + + + - AMF ;__....;_ __ +�AM�F-..;.__-" •··•··· YFP-Lamp ·AMF ···•··· Dy549 •AMF -YFP-L.amp + AMF --+--Dy549+AMF 0 2 3 4 5 6 7 8 Time (Minutes) AMF***
9 10 11 52 49�
46 ";.;i
43; a. E 40 � 37 34 12CellROX Green reagent to Gastrin MNP labeling of confocal microscopy images (LSM780 confocal microscope, Zeiss) using Image J software. 20 30 cells/experiment were analyzed from at least 4 independent experiments.
2.6. Local heat quantification using molecular thermometers
INR1G9 CCK2R cells were seeded at a density of 25 × 103cells/cm2
onto 35 mm dishes and transfected with 0.1μg of YFP Lamp1
(Addgene, plasmid #1816) and 2.9μg of pcDNA3 using Lipofectamine 2000 reagent (Life technologies). 24 h post transfection, cells were in cubated with Gastrin MNP DY549 (16μg Fe/ml) for 24 h, included in 0.5% agarose gel. For these experiments, the AMF was produced by a miniaturized home made electromagnet placed in a CELLView dish and covered with RPMI containing 0.5% FBS, as previously described[17]. This permits to follow in real time the evolution of thefluorescence of the MNPs under the application of AMF and thus to have an access to the local temperature. For these experiments, different positions were marked inside and outside the gap. Cells were exposed to the AMF (53 mT, 300 kHz). Before and during AMF application, fluorescence intensities of DY549 (excitation: 540 nm) and YFP Lamp1 (excitation: 510 nm) were measured from confocal microscopy images LSM780 confocal microscope, Zeiss) using ImageJ software. 20 30 cells/ex periment were analyzed from 4 independent experiments.
2.7. CathB leakage from lysosome
INR1G9 CCK2R cells were seeded at a density of 25 × 103cells/cm2
onto 35 mm dishes and transfected with 0.1μg of RFP Lamp1
(Addgene, plasmid#1816), pCathB eGFP (given by Klaudia Brix, Jacobs
University Bremen, Germany) and 2.9μg of pcDNA3 using
Lipofectamine 2000 reagent (Life technologies). 4 h post transfection, cells were seeded onto 4 compartment Cellview dishes (Greiner Bio One) at a density of 25 × 103cells/cm2, grown overnight and in cubated with Gastrin MNPs (16μg Fe/ml) for 24 h, rinsed twice with incubation medium and exposed to AMF for 2 h. CathB leakage from lysosome was analyzed by measuring the colocalization between the GFP CathB and RFP Lamp1 proteins and thefluorescence intensity ratio of GFP CathB to RFP Lamp1 labelings (excitation: 488 and 540 nm re spectively) of confocal microscopy images (LSM780 confocal micro scope, Zeiss, ImageJ software) immediately after AMF exposure. 20 30 cells/experiment were analyzed from 4 independent experiments.
For real time analysis of CathB leakage, INR1G9 CCK2R cells were seeded at a density of 25 × 103cells/cm2 onto 35 mm dishes and transfected with 0.1μg of pCathB eGFP (given by Klaudia Brix, Jacobs
University Bremen, Germany), 0.1μg RFP Lamp1 (Addgene, plasmid #1817) and 2.8μg of pcDNA3 using Lipofectamine 2000 reagent (Life technologies). 24 h post transfection, cells were incubated with Gastrin MNPs (16μg Fe/ml) for 24 h. INR1G9 CCK2R cells expressing or not GFP CathB and having or not internalized Gastrin MNP were included in 0.5% agarose gel, poured into the electromagnet placed in a CELLView dish and covered with RPMI containing 0.5% FBS, as pre viously described [17]. Different positions were marked inside and outside the gap. Cells were exposed to the AMF (53 mT, 300 kHz) for 60 min. Before and during AMF application, CathB leakage from lyso some was analyzed by measuring the colocalization between the GFP CathB and RFP Lamp1 proteins labeling from confocal microscopy images of the marked positions by measuring the % of green pixels (GFP CathB) colocalized with red pixels (RFP Lamp1) (ImageJ soft ware). 20 30 cells/experiment were analyzed from 4 independent ex periments.
2.8. Analysis of Caspase 1 and 3 activation
Cells were seeded 24 h before the experiments onto 4 compartments Cellview dishes (Greiner Bio One) at a density of 25 to 50 × 103cells/ cm2and incubated with Gastrin MNPs (16μg Fe/ml) for 24 h and ex posed to AMF for 2 h. Immediately, 3 or 17 h after AMF exposure, cells were incubated with Fluorochrome Labeled Inhibitors of Caspase 1 (FLICA, FAM YVAD FMK, excitation: 488 nm) or Caspase 3 (FLICA, FAM DEVD FMK, excitation: 488 nm) reagent (Immunochemistry technologies) for 1 h according to manufacturer's instructions. As a positive control for Caspase 3 activation, INR1G9 CCK2R cells were incubated with 1μM staurosporine for 4 h. In some experiments, cells were pretreated with 2.5μM Caspase 1 inhibitor, 10 μM Caspase 3 in hibitor or 10μM CA 074 Me CathB inhibitor for 1 h. Inhibitors were washed from the cells before adding FLICA. Next, cells were washed and analyzed by confocal micrsocopy (LSM510 confocal microscope, Zeiss). After Caspase 1 staining, cells were labeled with AnnexinV iFluor555 according to manufacturer's instruction (AAT Bioquest). Counting of labeled cells was carried out by analyzing confocal mi croscopy images representing populations of 2000 3000 cells/experi ment using ImageJ software.
2.9. Statistical analysis
Results are expressed as the mean ± SEM of at least three in dependent experiments. Statistical analysis was performed using ANOVA test. Differences were considered significant when p < 0.05. Fig. 1. Magnetic Intra-Lysosomal Hyperthermia (MILH) induces ROS generation.
a) Schematic representation of MILH approach. Gastrin-MNPs are specifically internalized through a CCK2R-dependent physiological process, and are then trafficked to lysosomes where they accumulated. Upon AMF exposure, Gastrin-MNPs cause LMP and the leakage of lysosomal enzymes into the cytosol including Cathepsins which trigger cell death. Subsequently, 19.9 ± 1.5% or 32.3 ± 2.7% of INR1G9-CCK2R cells were labeled by AnnV and PI or killed 4 h and 24 h after AMF exposure.b) Top panel: hypothesis of initiating event triggered by MILH. AMF application to cells containing MNPs would generate a local temperature elevation and enhance ROS production within lysosomes. Lysosomes are well-known major sites of ROS production through the Fenton reaction which catalyzes the transformation of hydrogen peroxide to hydroxyl radicals. Bottom panel: INR1G9-CCK2R cells having or not internalized Gastrin-MNPs were incubated in the presence or absence of 1 mM DFO, 120μM FeCl3, 1 nM BafA1 or 20μM ART, exposed or not to AMF and incubated with CellROX reagent.
Quantification of ROS production was performed by analyzing the fluorescence intensity from confocal microscopy images and expressed as fold change of fluorescence intensity over control cells (in absence of Gastrin-MNP and AMF). Significant difference compared to the control condition corresponding to cells devoid of Gastrin-MNP in absence of AMF exposure was indicated above histogram bar. Statistical significances between other conditions are also indicated by lines/brackets. 2000–3000 cells/experiments were analyzed and results are the mean ± SEM of 4 separate experiments.c) INR1G9-CCK2R cells having or not internalized Gastrin-MNPs were incubated in the presence or absence of 1 mM DFO, 120μM FeCl3, 1 nM
BafA1 or 20μM ART and incubated with CellROX reagent during the 30-min of AMF exposure. Top panel: confocal microscopy images illustrating ROS production, Gastrin-MNP labelings and line scan offluorescence intensity. Bottom panel: Quantification of ROS production colocalizing with Gastrin-MNP was performed by analyzing the % of relative fluorescence intensities of ROS production over MNP from confocal microscopy images. Significant difference compared to the control condition corresponding to cells containing Gastrin-MNP in absence of AMF exposure was indicated above histogram bar. Statistical significances between other conditions are also indicated. 30–50 lysosomes of 20–30 cells/experiments were analyzed and results are the mean ± SEM of 4 separate experiments.d) INR1G9-CCK2R cells were incubated with Gastrin-MNPs and exposed or not to AMF. Fe contained in superparamagnetic MNPs was measured by particle electron paramagnetic resonance.e) INR1G9-CCK2R cells transiently expressing YFP-Lamp1 were incubated with Gastrin-MNP-DY549. AMF was applied using a miniaturized electromagnet. Temperature at MNPs surface and lysosome membrane was analyzed respectively using the molecular thermometers DY549 (red line) and YFP-Lamp1 (green line) by measuring the decrease of theirfluorescence intensity. Significant difference was analyzed comparatively to t = 0 for each fluorophores. 20–30 cells/experiments were analyzed and results are the mean ± SEM of 5 separate experiments. As a control, no significant changes of the MNP surface (red dotted line) or lysosome membrane (green dotted line) temperatures were observed in cells not exposed to AMF. (For interpretation of the references to colour in thisfigure legend, the reader is referred to the web version of this article.)
and pharmacological agents were carried out. Firstly, analysis of con focal microscopy images indicated thatfluorescent ROS sensor co lo calized with Gastrin MNPs in lysosomes after 30 min of AMF exposure (Fig. 1c). Quantification of lysosomal ROS images showed that MILH enhanced ROS level by 2.0 ± 0.2 fold in the vicinity of Gastrin MNPs
within lysosomes (% of relative fluorescence Gastrin MNP/ROS:
48.5 ± 3.9% vs 24.8 ± 1.1%). Moreover, addition of FeCl3 aug mented MILH induced lysosomal ROS production by 1.3 ± 0.1 fold (%
of relative fluorescence Gastrin MNP/ROS: 60.7 ± 6.1% vs
48.5 ± 3.9%), wheareas DFO inhibited it (37.8 ± 5.8%). Variation of lysosomal pH also modified lysosmal ROS production. Indeed, while ART treatment increased MILH induced lysosomal ROS production by
1.7 ± 0.1 fold (% of relative fluorescence Gastrin MNP/ROS:
80.9 ± 8.5% vs 48.5 ± 3.9%), BafA1 inhibited it (24.7 ± 4.2%). Together, these results demonstrate that MILH initially generates ROS through the Fenton reaction within lysosomes where Gastrin MNPs are accumulated.
However, as the ROS production can occur in other subcellular sites, we also determined whether MILH also generates ROS by activating, for instance, the mitochondrial respiratory chain complex or NADPH oxi dases which are transmembrane proteins mostly present at the plasma membrane, in endosomes and in endoplasmic reticulum[23]. We found that rotenone, an inhibitor of the mitochondrial respiratory chain complex, did not modify cellular ROS generation by MILH, whereas diphenyleneiodonium (DPI), an inhibitor of NADPH oxidases, de creased it (5.9 ± 1.8 and 3.8 ± 1.3 fold over basal value in the presence of rotenone or DPI, respectively versus 5.7 ± 1.5 fold) (Fig. S2). Hence, MILH initially triggers ROS production through the Fenton reaction within lysosomes and, likely secondary, through NADPH oxi dases. Of note, no significant variation in ROS level was observed be tween the different conditions in the absence of AMF exposure (Fig. S1a, S2).
We further investigated the mechanism whereby MILH enhanced the Fenton reaction in lysosomes. Firstly, we examined the possibility that Fe ions, participating in the Fenton reaction, could originate from MNPs dissolution in lysosomes during AMF exposure. Indeed, it has been reported that iron oxide MNPs, in the absence of AMF application, are degraded through a lysosomal acidic and enzymatic lysis in the endo lysosome compartment[24,25]. On the other hand, another study performed at neutral pH, attributed ROS production to the catalytic reaction at the surface of MNPs rather than to being caused by dissolved iron from MNPs[26]. Using particle electron paramagnetic resonance (pEPR) to determine the quantity of iron contained in the cells under the form of MNPs, we found that internalized Gastrin MNPs were not degraded following AMF application (0.94 ± 0.06 vs 0.92 ± 0.03 pg magnetic Fe/cell) (Fig. 1d). However, we cannot exclude that iron could have been released from Gastrin MNPs during their 24 h traf ficking in the endo lysosome compartment prior to magnetic field ap plication. Consequently, these results indicate that MILH induced ROS production was the result of enhanced Fenton reaction catalysis using cellular lysosomal iron or possibly iron from MNPs, dissolved most likely before AMF application.
Secondly, we evaluated the temperature rise during MILH experi ments. So far, our experimental data indicate that the death of cancer cells in MILH occurs without any perceptible rise in the global tem perature of the medium. The hypothesis that local heating occurs at proximity of MNPs has been supported by several experimental reports [27], but direct data accounting for such a phenomenon in MILH were still lacking. In particular, no intracellular or intra lysosomal tem perature measurement under magnetic hyperthermia experiments has been reported so far in the literature. We therefore conducted such experiments, using fluorescent molecular thermometers and the pre viously described miniaturized high frequency electromagnet which enables confocal fluorescence imaging of cells during MILH experi ments[17]. Molecular thermometers were composed of thefluorescent moieties DY549 attached to MNPs via PolyEthyleneGlycol of 7 nm 2.10. Lipid peroxidation, mitochondrial membrane potential assay, DNA
fragmentation, Il 1β secretion, Western blotting, analysis of lysosomal acidity
See Supplementary information and Supplementary Table 1. 3. Results
3.1. Magnetic Intra Lysosomal Hyperthermia (MILH) enhances ROS production through the Fenton reaction within lysosomes
Over expression of hormone receptors is a hallmark of neuroendo crine tumors which thus represent a perfect model for the experi mentation of tumor cell targeting with ligand grafted MNPs. We pre viously showed that Gastrin grafted iron oxide MNPs (termed Gastrin MNP) are internalized specifically by the pancreatic endocrine tumoral cells INR1G9 overexpressing the CCK2R (INR1G9 CCK2R cells) through a CCK2R dependent physiological process, and are then trafficked to lysosomes where they accumulated (Fig. 1a). Of note, Gastrin MNPs exist under nano objects containing nanoparticles and serum adsorbed proteins whose distribution slightly increased from a size around 37 to 50 nm after 24 h of incubation in cell culture medium (data not shown). Upon AMF exposure, Gastrin MNPs killed 32.3 ± 2.7% of INR1G9 CCK2R cells by a phenomenon that we termed “Magnetic Intra Lyso somal Hyperthermia” (MILH) [4] (Fig. 1a). 4 h after MILH treatment, the rate of cell damage reached 19.9 ± 1.5% (i.e. 3.5 ± 0.3 fold basal) as indicated by AnnexinV and propidium iodide (AnnV/PI) la belings (Fig. 1a). Both AnnV and PI labelings, which constitute early features of MILH cell death, were thus used throughout our study to appreciate cell death.
So far, our current knowledge on the mechanism of cancer cell death caused by MILH treatment is still elusive, although we and others identified cellular ROS production and lysosome leakage as biological events accompanying cell death [4,5,17]. To gain insight into cell death mechanisms, we hypothesized that AMF application to cells containing MNPs would generate a local temperature elevation and, inasmuch as MNPs are concentrated into lysosomes, heating of lysosome content would trigger a death signaling cascade initiated by the enhancement of ROS production within lysosomes. Indeed, in addition to being a major digestive compartment, lysosomes are well known major sites of ROS
production through the Fenton reaction (Fe2+ + H
2O2 → Fe3+ + OH + OH%) which catalyzes the transformation of hydrogen peroxide to hydroxyl radicals. This reaction is dependent on low mo lecular weight iron derived from degraded iron containing proteins, lysosomal lumen acidity and temperature [18 20]. It is also known that high levels of ROS cause lysosome membrane permeabilization (LMP) whereby lysosomal cathepsins, as well as other hydrolytic enzymes, are released from the lysosomal lumen to the cytosol and trigger cell death (Fig. 1a b) [21]. In INR1G9 CCK2R cells, MILH increased ROS levels by 5.7 ± 1.5 fold over the basal value (Fig. 1b, S1a). Such effect is po tentiated by the addition of FeCl3 which increased ROS levels to 7.5 ± 0.7 fold. In contrast, intralysosomal chelation of iron by Des ferrioxamine (DFO) [22] prevented MILH increased cellular ROS pro duction which returned nearly to the basal value (2.0 ± 0.5 fold over basal). Also, the inhibition of the vacuolar H+ ATPase pump by Bafi lomicyne A (BafA1) treatment which caused intralysosomal pH rise (Fig. S1b) decreased MILH induced cellular ROS level to 2.7 ± 0.4 fold over basal value (Fig. 1b, S1a). Conversely, treatment of cells by Artesunate (ART), an activator of vacuolar H+ ATPase pump de creasing intralysosomal pH (Fig.S1b) [20], increased MILH enhanced cellular ROS production from 5.7 ± 1.5 to 8.3 ± 0.3 fold over basal value (Fig. 1b, S1a).
We previously showed that ROS production was significantly de tectable after 30 min of AMF exposure [17]. To precisely identify subcellular site(s) of ROS which are initially produced in MILH condi tion, a series of experiments combining confocal microscopy imaging
a
C 0 o. -z1ii :. . 3! )( C 0:s
"'m ..,
�
Q. <., ë. ::;.,
u 100.,
&!~
75 ! )(j
E so - -;!. -� - 25.,
IC 0b
C 0,8 ;c .r::tii
;;; "ü 0,78:;:
- Il
g 8
Q. C 0,6 E 5!..
�
...
-
.,
�!!:.os,. .
0 Gastrln-MNP NAC -AMF AMF - + 2 0***
+ + - ++AMF +AMF/DFO +AMF/BafA1
2 0 1 2 0 2
PoslUon (1Im)
CathB / Lamp1 : +AMF
**
■
u[]
** ** + + - +Œ]
■
u[]
+ + + + - + 0 1 2 PoslUon (µm ) 100 ,..o.0
DFO== z
"':.
0
BafA1 C • Il C 75ë•c:
·- 1ii.,
..
!!Q Il C U O 50 U)•-.,
,.
� :2 ::, )(;::: e
'ô 8_ 25 � :2 .. a. IC::; 0 Gastrln-MNP + -AMF 100 75 50 80 25 0 100 ji' 60 i» u 75f
C.,
50 Cl u:l )(
25c
0!Ï
Ê
40 ;'if. 0 100 �.,_
:0i
75 ïi 20 50 -;!. IC 25 3 0!
0 100 Gastrln-MNP 75 NAC 50 25 0C
- AMF +AMFd
m
.c Q.-
e
�j o. d. U-U CJ IC C 0 ] 80B
Rë
8
ë 600.. 8
�
l
40 ai êii (.) 20 0 0 15 30 Tlme (minute) ---AMF �+AUF 45 60 5 D Ann■
Ann/PI■
Pl 4 0 Gastrln- MNP NAC DFO FeCl3 BafA1 ART +**
+ + +**
*** + + + +AMF + AMF***
****
+ + + + + AMF + + + + + + + + + + + +length or the Yellow Fluorescent Protein (YFP) linked to Lysosome Associated Membrane Protein 1 (Lamp1)[4]. Intensity offluorescence emission of the two probes was previously shown to depend on tem perature[28]. This relationship was confirmed by the calibration curve showing linearity of fluorescence intensity decrease as a function of temperature increase (Fig. S3). Quantitativefluorescence imaging was then carried out on cells exposed to AMF for a limited duration (˂10 min) and incubated with ROS scavenger NAC in order to preserve ly sosome integrity and avoid possible chemical quenching of thefluor escent molecular thermometers by ROS. As shown onFig. 1e,fluores cence intensity of DY549 grafted to MNPs declined with the time of AMF exposure. According to the calibration curve (Fig. S3), the per centage of decrease offluorescence intensity observed after ~7 min of treatment corresponds to a temperature increase of 14.1 ± 1.4 °C, indicating that the temperature actually reached 51 °C at 7 nm distance from the MNP core. However,fluorescence intensity of YFP Lamp1 did not significantly change during MILH experiments (Fig. 1e). These re sults strongly support that AMF exposure to MNPs that have been ac cumulated in lysosomes causes a significant temperature increase at the immediate vicinity of the MNPs since it is not detected at the outer surface of lysosomes.
3.2. MILH enhanced ROS production within lysosomes causes lysosomal membrane permeabilization and cell death
We further assessed the relationship between ROS generation within lysosomes and cell damage. ROS can destabilize and permeabilize ly sosome membranes through lipid and protein peroxidation [3]. We performed experiments combining confocal microscopy imaging and pharmacological agents to analyze whether MILH induces the perox idation of lysosomal lipids (Fig. 2a). Analysis of confocal microscopy images indicated that MILH enhanced the level of lipid peroxidation which was detectable from 30 min of AMF application, and co localized
with Gastrin MNPs (% of relative fluorescence: 74.4 ± 2.7% vs
41.5 ± 5.6%). Moreover, intralysosomal chelation of iron by DFO or BafA1 treatment decreased MILH induced lysosomal lipid peroxidation (54.4 ± 3.1% and 48.7 ± 15.1%). Together, these results demon strate that MILH induces lysosomal lipid peroxidation concomitantly with lysosomal ROS production.
Since MILH stimulates lysosomal ROS production and lipid perox ydation, it appeared likely that LMP subsequently occurs. Previously, we documented that, in MILH experiments, lysosomal integrity was
affected as suggested by the decrease of lysosome labeling by
LysoTracker. However, the criterium of LysoTracker labeling is
insufficient to characterize LMP since it may account for leaking of low molecular weight components and not lysosomal enzymes which are key actors in lysosome functions. Herein, we determined whether ROS production in lysosomes truly triggered LMP. The decrease of CathB content in lysosomes (labeled with RFP Lamp1) was chosen to re present lysosomal enzyme leakage (Fig. 2b). In absence of AMF appli cation, INR1G9 CCK2R cells having internalized Gastrin MNPs pre sented a high level of GFP CathB/RFP Lamp1 colocalization which was reduced by the application of AMF (Pearson coefficient: 0.54 ± 0.03 vs 0.69 ± 0.02 in presence vs absence of AMF). The effect of MILH on GFP CathB/RFP Lamp1 colocalization was cancelled in the presence of the NAC scavenger (Pearson coefficient: 0.74 ± 0.03, Fig. 2b, S4). Moreover, quantification of fluorescence intensity showed that MILH decreased lysosomal CathB levels by 19.2 ± 3.7% (% of relative fluorescence: 30.7 ± 3.9% vs 50.5 ± 3.8%), whereas addition of NAC prevented it (50.3 ± 5.8%). These results demonstrate that lysosomal leakage was entirely related to MILH enhanced ROS production.
We then determined whether the leakage of CathB from lysosomes constituted an early event in the signaling cascade leading to cell death. During MILH experiments performed using the miniaturized electro magnet[17], we evaluated in real time the decrease of the colocaliza tion of GFP CathB with RFP Lamp1, a protein resident of lysosome membrane (Fig. 2c). Before or after AMF exposure, INR1G9 CCK2R cells having internalized Gastrin MNPs presented a high level of GFP CathB/RFP Lamp1 colocalization (Pearson coefficient > 0.70). How
ever, the lysosomal CathB level decreased significantly by
25.4 ± 4.7% and 43.9 ± 6.3% after 30 and 60 min of MILH treat ment respectively, demonstrating that leakage of lysosome content is an early event occurring concomitantly with the generation of lysosomal ROS. Of note, RFP Lamp1 and GFP CathBfluorescence intensities, other
LMP markers [29], decreased respectively by 20 ± 2.4% and
16.5 ± 6.6% from 30 min of AMF exposure (Fig. S7), strongly sug gesting that the changes in RFP Lamp1 and GFP CathB fluorescence represent respectively lysosomal rupture and CathB leakage from ly sosome into the cytosol and that both events occur early in the signaling cascade leading to cell death.
Finally, we wished to establish the relationship between ROS gen eration within lysosomes and cell death MILH experiments. We found that the addition of FeCl3or ART, which enhance ROS production in the cell medium, augmented cell death induced by MILH (4.0 ± 0.3 and 4.1 ± 0.4 fold over basal value respectively vs 2.6 ± 0.2 fold in presence of Gastrin MNP alone,Fig. 2d, S5). In contrast, NAC, DFO and BafA1 treatments which trapped ROS or inhibited their formation, prevented MILH induced cell death (0.8 ± 0.1, 1.4 ± 0.1 and Fig. 2. MILH-induced ROS generation causes lysosome lipid peroxydation, lysosome membrane permeabilization and cell death.
a) INR1G9-CCK2R cells having or not internalized Gastrin-MNPs were incubated in the presence or absence of DFO or BafA1 and incubated with Image-IT® lipid peroxidation reagent during the 30-min of AMF exposure. Left panel: confocal microscopy images illustrating lipid peroxidation in vesicles containing Gastrin-MNP labelings and line scans offluorescence corresponding to peroxidized lipids colocalizing with Gastrin-MNPs. Right panel: Quantification was performed by measuring the % of fluorescence intensity of lipid peroxidation over that of Gastrin-MNP from confocal microscopy images. Significant difference compared to the control condition corresponding to cells containing Gastrin-MNPs in absence of AMF exposure was indicated above histogram bar. Statistical significances between other conditions are also indicated. 30–50 lysosomes of 20–30 cells/experiments were analyzed and results are the mean ± SEM of 3 separate experiments.b) INR1G9-CCK2R transiently expressing GFP-CathB and RFP-Lamp1 were incubated with Gastrin-MNPs and exposed to AMF in the presence or not of NAC. Left panel: LMP was evaluated by analyzing the colocalization between GFP-CathB and RFP-Lamp1 on confocal microscopy images using Pearson's coefficient. Significant difference compared to the control condition corresponding to cells devoid of Gastrin-MNP in absence of AMF exposure was indicated above histogram bar. Statistical significances between other conditions are also indicated. Middle panel: confocal microscopy images illustrating GFP-CathB in lysosome labeled by RFP-lamp1 and line scans of fluorescence corresponding to GFP-CathB colocalizing with Lamp1. Right panel: LMP was quantified by measuring the % of fluorescence intensity of GFP-CathB over that of RFP-Lamp1 from confocal microscopy images. Significant difference compared to the control condition corresponding to cells devoid of Gastrin-MNP and exposed to AMF was indicated above histogram bar. Statistical significances between other conditions are also indicated. 30–50 lysosomes of 20–30 cells/experiments were analyzed and results are the mean ± SEM of 4 separate experiments.c) INR1G9-CCK2R transiently expressing GFP-CathB and RFP-Lamp1 were incubated with Gastrin-MNPs and exposed or not to AMF. Different positions were marked inside (+ AMF) and outside ( AMF) the gap of the electromagnet allowing to visualize the effects of AMF under a confocal microscope. Top panel: Confocal microscopy images illustrating the lysosome integrity in cells before and 60-min after AMF exposure (53 mT, 300 kHz). Bottom panel: Before and during AMF application, LMP was analyzed by measuring the % of green pixels (GFP-CathB) colocalized with red pixels (RFP-Lamp1) (ImageJ software). Results are expressed as % of CathB/Lamp1 colocalization over control cells (in absence of Gastrin-MNP and AMF). Significant difference was analyzed comparatively to t = 0. 20–30 cells/experiments were analyzed and results are the mean ± SEM of 5 separate experiments. d) INR1G9-CCK2R cells were incubated with Gastrin-MNPs, exposed to AMF in presence or not of different agents. Dead cells were counted 4 h after AMF exposure by confocal microscopy analysis of cells labeled with AnnV/PI. Results are expressed as fold change of death rate over control cells (in absence of Gastrin-MNP and AMF). The % of dead cells are indicated above the histogram. Significant difference compared to the control condition corresponding to cells devoid of Gastrin-MNP in absence of AMF exposure was indicated above histogram bar. Statistical significances between other conditions are also indicated. 2000–3000 cells/experiments were analyzed and results are the mean ± SEM of 4 separate ex-periments. (For interpretation of the references to colour in thisfigure legend, the reader is referred to the web version of this article.)
a
AnnexinV / Propidium iodide -AMF +AMF 3**
D Ann 18.6■
Ann/PI■
Pl 2 .c .. ai=
ai QI IL "O -QI "O 8.5 - ai<
+-
QI ai"'
(.) JJ "O 0 Gastrin-MNP + + + + CA-074-M e + + + +b
GFP-CathB-C29A / AnnexinV -AMF +AMF 4**
**
IL**
:!: QI 20.0<
3�
=
ai QIi
QI "O 2 "O -= ig QI ai (.) JJ "O IL ;g_ 1 :!:<
+ 0 Gastrin-MNP + + + + GFP-CathB-C29A + + + +C
GFP-Ca1hB-WT / AnnexinV -AMF +AMF5 IL 4 :!:
i'
<
�
-s-;
3 (Il 41 41 'tJ 'tJ -- (Il ai UJ 2 0� 'tJ IL -1 + 0 Gastrin-MNP + + + + GFP-CathB-WT + + + +1.3 ± 0.1 fold over basal value respectively) (Fig. 2d, S4 S5). More over, MILH induced cell death was not inhibited by rotenone or DPI (Fig. S6), indicating that neither the mitochondria respiratory chain complex nor NADPH oxidases were involved in cell death, further supporting the idea that ROS generated by NADPH oxidases are sec ondary to lysosomal stress caused by MILH treatment. All together, these results demonstrate that lysosomal ROS production, which is enhanced by MILH through the Fenton reaction, is at the origin of cancer cell death.
3.3. Cancer cell death induced by MILH is dependent on CathB activity In a previous study, we showed that MILH induced cell death de pends on lysosomal cysteine cathepsins which include cathepsins B, C, H, K, L, S and X[4]. Herein, we performed experiments to more pre cisely identify the enzyme(s) involved. A likely candidate is CathB which is involved in lysosomal cell death, abundant in lysosomes, overexpressed in cancers and maintains its activity at neutral pH [30 32]. MILH experiments were performed in the presence of the se lective inhibitor of CathB CA 074 Me [33] or by overexpressing the enzymatically inactive mutant GFP CathB C29A. As shown inFig. 3a b, both the inhibitor CA 074 Me and the inactive mutant GFP CathB C29A prevented MILH induced cell death (1.2 ± 0.1 and 1.5 ± 0.1 fold over basal value vs 2.5 ± 0.1 fold). In contrast, overexpression of wild type CathB (GFP CathB WT) augmented the efficiency of MILH to era dicate cancer cells (4.1 ± 0.2 vs 3.0 ± 0.3 fold over basal, Fig. 3c) reaching 34.8% of dead cells comparatively to 17.3% of dead cells in the absence of CathB WT overexpression. These results indicate that cell death induced by MILH is dependent on CathB activity.
3.4. MILH induces cell death through a Caspase 1 dependent but Caspase 3 independent mechanism
So far, in most circumstances, partial LMP induce cell death through an apoptotic pathway, by triggering a cascade of regulated molecular events leading to activation of the effector apoptotic enzyme Caspase 3 [3,14]. We therefore investigated whether MILH also induces cell death through an apoptotic pathway. Surprisingly, the Caspase 3 inhibitor did not inhibit MILH induced cell death (2.7 ± 0.2% vs 2.8 ± 0.2 fold over basal) whereas it prevented cell death induced by staurosporine used as a reference agent to stimulate apoptosis (Fig. 4a). Moreover, Caspase 3 activation was not detected neither by confocal microscopy using afluorescent substrate (Fig. 4b), nor by western blot as shown by the absence of Pro Caspase 3 cleavage (Fig. S8). We also showed that MILH did not modify mitochondrial outer membrane permeabilization (MOMP), which critically relies on apoptotic cell death, as demon strated with staurosporine treatment (Fig. 4c, S9), 4 h or 24 h after AMF exposure[34]. Hence, cell death induced by MILH does not involve an apoptotic pathway.
In some non epithelial cells, especially in macrophages exposed to infectious agents, the release of lysosomal hydrolases such as CathB induced after LMP was shown to activate a non apoptotic cell death pathway involving Caspase 1 activation [35]. We therefore verified Caspase 1 expression in INR1G9 CCK2R cells (Fig. S10) and determined whether Caspase 1 was involved in MILH induced tumor cell death.
Incubation of INR1G9 CCK2R cells with Caspase 1 inhibitor prevented cell death induced by MILH (1.6 ± 0.2 vs 2.8 ± 0.2 fold over basal, Fig. 4d). Likewise, overexpression of Caspase 1 C284A inactive mutant inhibited cell death (1.5 ± 0.2 vs 3.0 ± 0.2 fold over basal,Fig. 4e). It was also noticed that overexpression of Caspase 1 C284A inactive mutant lowered basal rate of cell death (amount of dead cells: 1.2 ± 0.4% vs 6.5 ± 0.9%). Moreover, MILH increased Caspase 1 activation (3.5 ± 0.4, 9.0 ± 1.3 and 12.5 ± 2.4 fold over basal 1 h, 4 h and 18 h after AMF exposure) and this activation was inhibited by CathB inhibitor CA 074 Me (Fig. 4f, S11). It is also important to note that 84.5 ± 2.3% of cells presenting an upregulated Caspase 1 activity were labeled with AnnexinV (Fig. 4g). Taken together, these results demonstrate that cell death induced by MILH does not involve an apoptotic pathway, but requires Caspase 1 and Cath B activities.
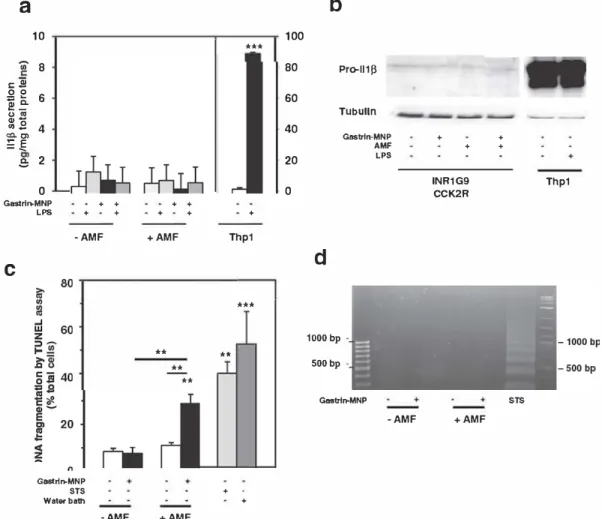
An important function of Caspase 1 consists to process the precursor of the inflammatory cytokines, interleukine 1β (Il1β) and interleukine 18 (Il 18) into their active forms [36]. Furthermore, activation of Caspase 1 in cells is a hallmark of pyroptosis, which is a form of regulated cell death, usually defined by several additional biochemical features such as independence of apoptotic caspases, Ann/PI positive labeling, DNA fragmentation[37]. The current study demonstrates that MILH induced cell death is dependent on Caspase 1 activation and featured by Ann/PI labeling. Owing to functions of Caspase 1 in im mune cells, wefirst investigated whether MILH induced Caspase 1 ac tivation was associated with Il1β secretion (Fig. 5a). Our results show that, in INR1G9 CCK2R cells which were LPS primed or not, MILH did not increase Il1β secretion relative to control cells. In contrast, in LPS primed Thp1 macrophages, which were used as reference cells for Il1β processing and secretion, levels of Il1β secretion were increased by 27.7 ± 3.2 fold over basal value. The levels of Il1β secretion by INR1G9 CCK2R cells were very low (< 2 pg/mg of cell proteins) as was that of Pro Il1β expression, comparatively to macrophages cells (Fig. 5b). Hence, MILH induces Caspase 1 dependent cell death without activating the Caspase 1 pro inflammatory response in the endocrine tumoral INR1G9 CCK2R cells. However, we could not exclude that pro inflammatory response could be activated by MILH in cancer cells ex pressing higher level of Pro Il1β.
Then, we characterized DNA fragmentation caused by MILH using TUNEL assay which consists in the incorporation offluorescent dUTP (deoxyuridine triphosphate) into free 3′ hydroxyl termini generated by genomic DNA fragmentation (Fig. 5c). Results indicate that, after 6 h of AMF exposure, DNA fragmentation increased by 3.4 ± 0.5 fold re lative to control cells (22.9 ± 3.8% vs 8.5 ± 1.4% of positive cells). Of note, DNA fragmentation induced by MILH was less abundant than that caused by staurosporine or by 42 °C water bath (40.1 ± 4.9% or 52.6 ± 14.0% of positive cells, respectively). Secondly, we char acterized the type of DNA fragmentation caused by MILH (Fig. 5d). In contrast to staurosporine treatment which provoked regular inter nu cleosomic DNA fragmentation characterized by DNA ladder[37], MILH did not induce the formation of the characteristic laddering pattern associated with apoptosis. In conclusion, our results show that MILH induced a non apoptotic Caspase 1 dependent cell death related to pyroptosis which occurred without Il1β secretion and which was characterized by the formation of TUNEL positive cells without ex hibiting a laddering pattern[37,38].
Fig. 3. Cell death induced by MILH is dependent on CathB activity.
a) INR1G9-CCK2R cells having or not internalized Gastrin-MNPs were incubated with or without 10μM CA-074-Me and exposed or not to AMF. Dead cells were counted 4 h after the end of AMF exposure by confocal microscopy analysis of cells labeled with AnnV/PI. Results are expressed as fold change of death rate over control cells (in absence of Gastrin-MNP and AMF). The % of dead cells are indicated above the histograms.b–c) INR1G9-CCK2R transiently expressing GFP-CathB-C29A inactive mutant (b) or GFP-CathB wild-type enzyme (c) were incubated with Gastrin-MNPs and exposed or not to AMF. Dead cells were counted 4 h after the end of AMF exposure by confocal microscopy analysis and expressed as the % of cells labeled with AnnV (red) among transfected (green cells) and non-transfected cells. Results are expressed as fold change of death rate over control cells (in absence of Gastrin-MNP and AMF). The % of dead cells are indicated above the histograms. Significant difference compared to the control condition corresponding to cells devoid of Gastrin-MNP in absence of AMF exposure was indicated above histogram bar. Statistical significances between other conditions are also indicated. 2000–3000 cells/experiments were analyzed and results are the mean ± SEM of at least 4 separate experiments. (For interpretation of the references to colour in thisfigure legend, the reader is referred to the web version of this article.)
a
4 0 Ann -AMF■
Ann/PI■
Pl 0 Gastrin-MNP Casp3inh + • + + +C
IL ::E <( +e
IL ::E <(.,
3.
�-
r
tii m., ,,
'O--
..
IL�!
::E.
!
'
<( + ' 0 +AMF��
**
18.7 • + • + + +***
***
24.4 2.7 • ..;;....;t.STS
-AMF +AMF40
:§°35
!
fl30
C Q) !il25 ! D. 0 � ;ê20 ::E-g
�15C>10
0
u 5:::?.
0--***
Gaatrln-MNP - + - + STSf
-AMF +AMF***
***
19.3 6.9 Gastrin-MNP- + -
+ + • + Casp1-C284A- - +
+ • + + 10 8 6 4 2 0 IL ::E <( +d
IL ::E <( +b
,S!
men
� =;
40 30 u u � ]i 20 ' 0i�
U 10 0 Gastrin-MNP Casp3inh C0
50 40 � :§' 30 ; 1l u u <(--
; � 20..
a.l
..
0 10 0 Gaatrln-MNP Caap1 lnh CA074-Me -AMF + +• +
4 +AMF + + • + -AMF 0 Ann■
Ann/PI■
Pl**
***
• +
STS
+AMF*** ***
r-"\ f"'T""""
18.7 0 Gaatrln-MNP + • + + + + • + + + caap1 lnh + + + • + • •• + -AMF**
**
**
• + + +.
• + •.
• + +AMFg
Activated Casp1/AnnV
Il.
i
+
Fig. 4. Cell death lnduced by MILH 1s medlated tbrough a non..apoptotlc Caspase-1 slgnallng pa thway whlch 1s dependent on CathB actlvlty.
INRlG9-ccK2R œlls havlng or not lntemallzed Gastrin-MNPs were exposed or not to AMF ln the presence or ln absence ofCaspase-3 or Caspase-1 lnhibitor. As positive and negatlve controls of apoptosls, INR1G9-0CK2R cens were stlmulated wlth 1 µM staurœporine ln the absence or ln the presence of Caspase-3 lnhlbitor. a) Dead cells were counted 4 h after the end of AMF exposure by confocal mlcroscopy analysls of cells labeled wlth AnnV /Pl. Results are expressed as fold change of death rate over control cells (ln absence of Gastrin-MNP and AMF). The% of dead cells 1s lndlcated above the histogram b) 4 h after AMF exposure or staurosporine treatment, Caspase-3 activation was analyzed by confocal mlcroscopy of cells labeled wlth FAM-PLICA-Casp3. Results are expressed as the% of total cells labeled wlth fluorescent Caspase substrate c) 4 h after AMF exposure or staurœpcrin e treatment, cells were lncubated wlth JC-10 reagent and were analyzed by confocal mlcroscopy. Quantification of MOMP was performed by anal)'2ing the JC-10 green/red fluorescence ratio from confocal mlcroscopy Images. d) Dead cens were counted 4 h after the end of AMF exposure by con focal mlcroscopy anal ysls cf cells labeled with Ann V/Pl. Results are expressed as fold change of death rate over control cells (ln the absence of Gastrin-MNP and AMF). The% of dead œlls 1s lndlcated above the histogram e) INR1G9-CCK2R translentiy expresslng GFP-Casp l-C284A enzymatlcally Inactive mutant were lncubated wlth Gastrin-MNPs and exposed or not to AMF. Dead cells were counted 4 h after AMF exposure by confocal mlcroscopy analysls of cells labeled wlth Ann V. Results are expressed as fold change of death rate over control cells (ln absence of Gastrin-MNP and AMF). The% of dead cells 1s lndlcated above the hlstogram. 1) 4 h after AMP exposure, Caspase-1 activation was analy?Jed by confocal mlcroscopy of cells labeled wlth FAM-PLICA-Caspl. Results are expressed ln% of total cells labeled wlth fluorescent Caspase substrate. g) 4 h after AMF application cells were labeled wlth FAM-FUCA-Caspl, then wlth AnnV (red) and observed by confocal mlcroscopy. Signiflcantdifference compared to the control condition correspondlng to cells devoid ci Gastrin-MNP ln absence of AMF exposure was lndlcated above histogram bar. Statlstical signiflcances between other conditions are also lndlcated. 2000-3000 cells/experiments were analyzed and results are the mean ± SEM of at least 4 separate experiments. (For lnterpretation of the references to entour ln this figure legend, the reader 1s referred to the web version of this article.)
3.5.
Gastrin
grafted MNPs mduces the death of cells expressing the CCK2RbyMILH
The preceding experiments analyzed the effects and mechanisms of
MilRapplied to the pancreatic endocrine tumor œlls INR1G9 CCK2R.
Herein, we extended the experiments to two other tumor œll lines, the
a
10.,
8es
g[
e_
6"
..
..
-., .s
4 aie,=
.e
2e
0 Gastrln-MNP + +C
LPS + + ·AMF Gastrln-MNP STS Wator balh -AMF + + + + +AMF ** ** ** +AMF *** + Thp1 *** ** + • + 100 80 60 40 20 0Fig. S. M1LH lriggers a non..apoptotlc cell death mechanism related to pyroptosls.
gastric cell line AGS CCK2R and the pancreatic cell line AR4 2.J, which
express the CCK2R at low levels (-100 fmol/10
6cells)
(39). Cell sur
vival data show that, 24 h after AMF exposure,
MilR has eradicated22.0 ± 4.5% of AGS CCK2R œlls and 23.1 ± 1.3% of AR4 2 J œlls
presenting Gastrin MNPs mainly in their lysosomes
(F
ig
.
6a, S12). In
the same conditions, 56.6 ± 4.0%> and 42.7 ± 6.4% of HEK CCK2R
b
Pro-11113 Tubulln Gastrtn-MNPd
1000 bp 500bp Gastrtn-MNP AMF LPS •AMF + + + + INR1G9 CCK2R +AMF Thp1 STSa-b) INRl G9-ccK2R cells were treated or not wlth 500 ng/ml of LPS, Gastrin-MNPs and exposed or not to AMF. As a positive control, Thpl macrophages were treated wlth 500 ng/ml LPS. lll-11 release ln culture supernatant was assayed wlth an l!LISA klt (a). Pro-llljl expression was analyzed by Western blot of total cell lyzates (b). Representative lmmunoblot ci 3 separate experiments. c-d) INRlG9-ccK2R cells havlng or not lntemallzed Gastrin-MNPs were exposed or not to AMF. As controls of apoptotis and necrosls, cells were respectively treated wlth 1 µM of staurœpcrine (6 h) or lncubated at 42 •c ln a water-bath (30-mln). DNA fragmentation was detected by TIJNl!L assay, 6 h after AMF exposure. 2000-3000 cells/ experiments were counted by confocal mlcroscopy analysls and expressed as% of total cells labeled wlth fluorescent dUTP (deoxyuridlne triphosphate) which is lncorporated lnto free 3'· hydroxyl termlni generated by g,enomlc DNA fragmentation (c). DNA fragmentation was detected uslng the DNA ladder approach (d). Results are the mean ± SEM of at leastS separate experiments. Signiflcant dlfference compared to the control condition correspondlng to cens devoid of Gastrin-MNP ln absence of AMP exposure was lndlcated above histogram bar. Statlstlcal slgniflcances between other conditions are also lndlcated.
a
-AMF 40 35 'ii 30a!-=-
25=2
�ë
2008
c�.g-
15 10 5 0 Gastrin-MNP - +-
+ - + o, IC IC (!J N (/)Na:
15
C,l.: <(u
:!,Uu
C
6*
5-==-
4i'ii
-u C: -0 Cl) U IL 3 C: C) 0 Cl.-= -
2 0 Gastrln-MNP + + "'a:: c:, "' 1ë"'�8
e
High trequency arternating magnetic field__ ..,
__
..
__
..
--•
--..
--..
--..
...,
'l'.,.
IC <(***
- + o, ICc,,-,
-l.: IC U :!,U +AMF-
+ IC(/)!:!
c,u
<u
- +...,
'l'.,.
IC <(□□
Total Fe■
Superparamagnetlc Fe**
+ + + + Il)l'i
�8
�
�
•
Lysosome Cytosol (3b
-AMF 4 D Ann■
Ann/PI■
Pl 0 Gastrin-MNP .:....!:....:
:....!. o, IC IC...,
�!:!
(/)N 'l' (!J l.:.,.
IC U c(U IC:!:u
u
<(d
-AMF 40 C: 0 -.;:::-30!\!.!!!
• G>U t,<-
... CIi d, o 20.,-8.l
u
10 0 Gastrln-MNP----
+ +.
:';l'i
-:,,:�8
Il) c:,:,,: <(l'i
8
cl•
a:: <( LMP CathB leakage (3--•
Casp1
�
Casp3
:....:
.:....! :....!. o, IC IC CJ,-,(/)!:!
'l'a:
15
c,u
<u
.,.
IC :!,U <( +AMF**
+.
+.
+.
+a:: Il)
l'i
�
a::"' c:,:,,:
...
z"'
<(