HAL Id: hal-00316176
https://hal.archives-ouvertes.fr/hal-00316176
Submitted on 1 Jan 1997
HAL is a multi-disciplinary open access
archive for the deposit and dissemination of sci-entific research documents, whether they are pub-lished or not. The documents may come from teaching and research institutions in France or abroad, or from public or private research centers.
L’archive ouverte pluridisciplinaire HAL, est destinée au dépôt et à la diffusion de documents scientifiques de niveau recherche, publiés ou non, émanant des établissements d’enseignement et de recherche français ou étrangers, des laboratoires publics ou privés.
SABRE observations of Pi2 pulsations: case studies
E. G. Bradshaw, M. Lester
To cite this version:
E. G. Bradshaw, M. Lester. SABRE observations of Pi2 pulsations: case studies. Annales Geophysi-cae, European Geosciences Union, 1997, 15 (1), pp.40-53. �hal-00316176�
Ann. Geophysicae 15, 40—53 (1997) ( EGS — Springer-Verlag 1997
SABRE observations of Pi2 pulsations: case studies
E. G. Bradshaw, M. LesterRadio and Space Plasma Physics Group, Department of Physics and Astronomy, University of Leicester, Leicester, LE1 7RH Received: 14 December 1994/Revised: 26 June 1996/Accepted: 22 July 1996
Abstract. The characteristics of substorm-associated Pi2 pulsations observed by the SABRE coherent radar system during three separate case studies are presented. The SABRE field of view is well positioned to observe the differences between the auroral zone pulsation signature and that observed at mid-latitudes. During the first case study the SABRE field of view is initially in the eastward electrojet, equatorward and to the west of the substorm-enhanced electrojet current. As the interval progresses, the western, upward field-aligned current of the substorm current wedge moves westward across the longitudes of the radar field of view. The westward motion of the wedge is apparent in the spatial and temporal signatures of the associated Pi2 pulsation spectra and polarisation sense. During the second case study, the complex field-aligned and ionospheric currents associated with the pulsation generation region move equatorward into the SABRE field of view and then poleward out of it again after the third pulsation in the series. The spectral content of the four pulsations during the interval indicate dif-ferent auroral zone and mid-latitude signatures. The final case study is from a period of low magnetic activity when SABRE observes a Pi2 pulsation signature from regions equatorward of the enhanced substorm currents. There is an apparent mode change between the signature observed by SABRE in the ionosphere and that on the ground by magnetometers at latitudes slightly equa-torward of the radar field of view. The observations are discussed in terms of published theories of the generation mechanisms for this type of pulsation. Dif-ferent signatures are observed by SABRE depending on the level of magnetic activity and the position of the SABRE field of view relative to the pulsation tion region. A twin source model for Pi2 pulsation genera-tion provides the clearest explanagenera-tion of the signatures observed.
Correspondence to: E.G. Bradshaw
1 Introduction
Pi2 pulsations occur simultaneously with substorm ex-pansion phase onset and subsequent intensifications. The primary generation of these waves, however, is believed to be on field lines that thread the auroral zone substorm break-up region. At substorm expansion phase onset, a section of the cross-tail current is diverted into the auroral ionosphere by the field-aligned currents (FAC) forming the substorm current wedge (McPherron et al., 1973). This change in magnetosphere-ionosphere coupling is effected by the launching of Alfve´n wave transients which redistribute this excess current (Southwood and Hughes, 1985), leading to the reconfiguration of the aur-oral zone geomagnetic field, the ionospheric electric field and auroral zone conductivities. This is observed in the ionosphere as the substorm enhanced westward electrojet. The transverse mode Alfve´n wave is subsequently reflec-ted from the conjugate ionosphere and bounces back and forth reducing in amplitude with each reflection due to ionospheric absorption. The Pi2 waveform at high-lati-tudes appears, however, broadband and ill-defined, unlike the mid-latitude signature which consists of damped, quasi-sinusoidal oscillations occurring at the start of a magnetic bay (Rostoker, 1967; Stuart, 1972). Although the mid-latitude Pi2 signature is well defined, there has been much debate on the generation mechanism. South-wood and Stuart (1980) have reviewed the observational evidence and the three proposals for this generation mech-anism: a field line resonance, a surface wave on the plasmapause and a cavity mode resonance, all of which have been illustrated schematically by Yeoman and Orr (1989, their Fig. 1).
The substorm FAC, upward at the western edge of the wedge and downward at the eastern end, produce signa-tures in mid-latitude magnetometer records that enable identification of the position of the wedge with data from a longitudinal chain of magnetometer stations (Lester
Table 1.
BGS Magnetometer Geographic latitude Geographic longitude Geomagnetic latitude Geomagnetic longitude
Station (°N) (°E) (°N) (°E)
Tromsø (TR) 69.6 19.0 66.4 104.2 Nordli (NI) 64.5 13.5 61.6 96.1 Faroes (FA) 62.0 !7.0 61.3 78.9 Lerwick (LE) 60.1 !1.2 58.5 82.2 Wick (WI) 58.4 !3.1 56.9 79.8 Table 2.
EISCAT cross Geographic latitude Geographic longitude Geomagnetic latitude Geomagnetic longitude
Magnetometer station (°N) (°E) (°N) (°E)
Sørøya (SOR) 70.5 22.2 67.3 107.9 Alta (ALT) 69.9 23.0 66.6 107.8 Kautokeino (KAU) 69.0 23.1 65.8 107.2 Muonio (MUO) 68.0 23.5 64.7 106.7 Pello (PEL) 66.9 24.1 63.6 106.0 Sodankyla (SOD) 67.4 26.6 63.6 108.5 Kilpisjarvi (KIL) 69.1 20.7 66.0 105.5 Kevo (KEV) 69.8 27.0 66.2 110.6
positive within the wedge and negative outside while the D-component perturbation is asymmetrical with respect to the wedge, being positive to the west of centre of the wedge and negative to the east of centre. The position where the D-component perturbation is zero marks the centre of the wedge.
Recently, the observation of Pi2 pulsations by the STARE radar has been reported (Sutcliffe and Nielsen, 1990, 1992). The derived pulsation electric field distribu-tions contained regions of radial and linear electric field which were considered compatible with those produced by an Alfve´n wave incident on a strip of enhanced iono-spheric conductivity (Southwood and Hughes, 1985). However, these observed features did not persist through-out the whole Pi2 pulsation. Furthermore, Sutcliffe and Nielsen (1990, 1992) concluded that the most significant Pi2 signature observed by STARE in the ionospheric electron flow occurred poleward of the centre of the aur-oral break-up region. Pi2 pulsations have also been ob-served in data from the Wick component alone of the Sweden and Britain Radar-aurora Experiment (SABRE) coherent radar system (Nielsen et al., 1983) in association with the SAMNET magnetometer array (Yeoman et al., 1991). Yeoman et al. (1991) examined the polarisation, propagation and wave modes of Pi2 pulsations. These authors concluded that the sub-auroral latitudes are a transitional zone between the auroral zone Alfve´n wave and mid-latitude compressional mode signatures of Pi2 pulsations. Hence, SABRE is ideally located to investigate the transition signatures of the pulsations.
In the present study, three substorm intervals contain-ing Pi2 pulsations observed by SABRE are presented. A description of the experimental arrangement employed in this study is given elsewhere (Bradshaw et al., 1994). Data from the British Geological Survey (BGS)
magneto-meter array (Table 1) were employed to identify the Pi2 pulsations. In addition, data are also available for the three specific intervals of interest from the stations of the EISCAT magnetometer cross (Table 2) operated by the University of Braunschweig (Lu¨hr et al., 1984). A sche-matic map of northern Europe with the positions of the two magnetometer arrays relative to the SABRE field of view is presented in Fig. 1. The radar field of view covers the geographic range between 64° and 68°N and 0° and 12°E, equivalent to 60.5° to 66.9°N and 85.2° to 98.1°E geomagnetic.
The three substorm intervals were chosen from differ-ent levels of magnetic activity and at differdiffer-ent local times to investigate the ionospheric Pi2 signatures at different positions relative to the substorm current wedge and the transition zone between auroral zone Alfve´n and mid-latitude compressional pulsation signatures previously identified by Yeoman et al. (1991). The SABRE field of view can be located at the perfect latitude to observe the different time series, spatial and spectral signatures of the Pi2 pulsations in the auroral zone and those at mid-latitudes. The purpose of this study is to demonstrate the complexity of the electric field signatures associated with the Pi2 pulsations in this transition zone.
2 Case interval 1: eastward electrojet Pi2 pulsations
2.1 SABRE and magnetometer pulsation signatures
The first case study to be considered consists of two Pi2 pulsations, at 17:36 UT and 17:48 UT (Fig. 2). The H-component (north-south) measured at Nordli (NI), the Faroes (FA) and Wick (WI) (Fig. 2a, top three panels) indicates a positive bay at Nordli for both events but only
Fig. 1. A schematic diagram to illustrate the location in geo-graphic latitude and longitude of the SABRE field of view, the position of the BGS mag-netometers (C) and the stations of the EISCAT magnetometer cross (#)
for the second event at the Faroes and Wick. The D-components (east-west) for the same three magnetometer stations (Fig. 2b, top three panels) indicate positive bays at all three stations for the first event but weakly negative at Nordli for the second. In each case the overall change in field magnitude is calculated as the difference between the component value after the pulsation and that at onset (Lester et al., 1983). Identification of the location of the FAC of the substorm current wedge from mid-latitude magnetograms can lead to an overestimation of the width of the current wedge (Lester et al., 1989; Sergeev et al., 1996). Thus, the upward FAC for event 1 is placed to the east of the Faroes, whilst for the second event it is placed at or near the Faroes. The centre of the wedge on the other hand is well determined from mid-latitude magnetograms (Lester et al., 1989), and moves from east of Nordli for event 1 to west of Nordli for event 2, although the D com-ponent bay at Nordli for the second event is only weakly negative.
The EISCAT magnetometer cross data, although up to an hour east of SABRE, can provide useful information on the electrojet currents when the pulsations occur. At 17:30 UT, in the EISCAT cross magnetometer data (not shown), there is a negative X-component (north-south) bay at ALT and positive X-component bays at KAU, MUO, PEL and SOD. At these latter stations these bays become negative at \17:43 UT. The Z-component bays are negative at ALT, KAU and MUO at 17:30 UT, whilst at PEL and SOD they are initially weakly positive and then negative at \17:43 UT. These data indicate that initially a westward electrojet is centred poleward of ALT and an eastward electrojet is centred near SOD. The westward electrojet eventually dominates the whole
array following 17:43 UT, but is still centred poleward of ALT.
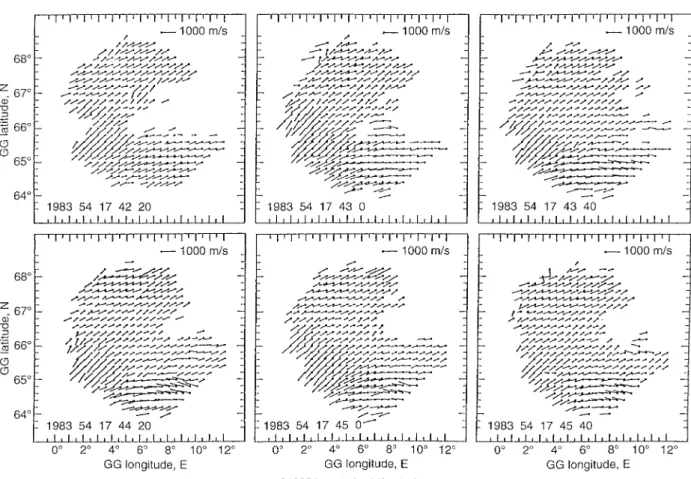
The westward component of the drift velocity meas-ured by SABRE in the prescribed latitude and longitude cell during both intervals (Fig. 2a, bottom panel) implies this part of the radar field of view is in the eastward electrojet at the time of these pulsations. Furthermore, the irregularity drift velocity increases in magnitude in the westward direction following the second event, indicating an enhancement of the eastward electrojet at the latitude illustrated in Fig. 2a and the local time of SABRE. Spatial plots of the velocity (Fig. 3) illustrate that, throughout the first pulsation, the background ionospheric velocity was mostly westward as would be expected for a background eastward electrojet. The magnitude of the velocity in the equatorward part of the field of view, below 65.0°N, is stronger than the velocity poleward of 65.0°N, indicative of a boundary between the two regions of flow. The magnetometer records from Nordli and Faroes suggest that the SABRE field of view is at longitudes which encompass the substorm current wedge. It is concluded, therefore, that for both the Pi2 pulsations the enhanced westward electrojet associated with the substorm current wedge is located poleward of the SABRE field of view during this interval. This is consistent with the EISCAT cross data for the first Pi2 event.
There is some evidence in both the ground mag-netometer and SABRE east-west velocity component data of further Pi2 pulsation activity between 17:58 UT and 18:04 UT and from 18:16 UT to 18:20 UT (Fig. 2a). These pulsations did not form a detailed part of this invest-igation, however, as they occurred when the SABRE field of view was observing characteristic signatures of
ionospheric flow associated with the WTS (Bradshaw
et al., 1994).
2.2 Spectral analysis
Maximum entropy (ME) spectral analysis of the two pul-sations under investigation was performed and the domi-nant wave periods are given in Table 3. The domidomi-nant period in the SABRE east-west velocity component and the ground magnetometer records compare favourably although in some cases no spectral peaks were identified in the Pi2 pulsation band in the magnetometer data. It is noted, however, that there is a non-trivial uncertainty involved in measuring the peaks of the maximum entropy spectra. Such uncertainty may account for instances where the dominant periods in magnetometer and radar data differ slightly but large differences observed by the radar and ground magnetometers are most likely to be due to a geophysical reason.
The spatial variation of the wave spectral power at the dominant pulsation period over the full SABRE field of view is summarised in Table 4 for the two separate velo-city components. During the first pulsation the wave power in the east-west component is strongly localised to an elliptical region in the south-eastern part of the field of view below 65°N. At the time of the second pulsation, the area of peak power in the east-west component expanded in longitude but contracted in latitude, and moved west-wards while remaining centred at the same latitude. The wave spectral power in the north-south component is of lesser strength and, for the first event, is centred around a single cell, 65.6—65.8°N, 7.5—8.0°E. For the second event, however, the wave spectral power exhibits a double struc-ture, both of which are equatorward of the peak power in the first event. The wave spectral power at the dominant frequency for the second pulsation is localised in the high velocity region mentioned earlier.
2.3 Polarisation analysis
Polarisation hodograms for the two pulsations were con-structed from the raw east-west and north-south velocity components in the regions of the SABRE field of view where the wave spectral power at the dominant pulsation period was high. This is equivalent to examining the two orthogonal components of the ionospheric electric field associated with the Pi2 pulsation. As the velocity is merely rotated 90° clockwise and scaled according to 1000 m s~1, equivalent to an electric field of 50 mV m~1, the polarisation sense of the hodograms is unaffected by $&&&&&&&&&&&&&&&&&&&&&&&&
Fig. 2. a Unfiltered ground magnetometer H-component data from Nordli, Faroes and Wick compared with SABRE east-west velocity component data (positive east) averaged over a small region of the field of view, 64.6° to 64.8°N and 6° to 8°E. Dashed lines delineate the onset times of the two Pi2 pulsations at 17:36 UT and 17:49 UT; b the same time series data as a but for ground magnetometer D-component data compared with the SABRE north-south velocity component data (positive north).
Fig. 3. A sequence of SABRE spatial velocity plots starting just at the end of the first pulsation (17:42:20 UT) and in the interval between the two pulsations. The region of enhanced velocity appears
about 17:43 UT toward the equatorward edge of the field of view and remains until after the end of the second pulsation
Table 3.
Period (s) ME Pi2 Pulsation: 17:36—17:42 UT
Magnetometer H D
Faroes (FA) 111 No peak
Nordli (NI) 111 111
Wick (WI) No peak No peak
SABRE 107 Pi2 Pulsation: 17:48—17:55 UT Magnetometer H D Faroes (FA) 91 91 Nordli (NI) 91 100 Wick (WI) 100 100 SABRE 95
this transformation. For the first pulsation, at 17:36 UT, two regions of different polarisation are found, anti-clock-wise (ACW) in the west and clockanti-clock-wise (CW) in the east. In addition to the longitudinal separation, with the bound-ary at around 4.5°E, there is also a latitudinal demarca-tion between the two regions at around 65.6°N. The
polarisation sense in these two regions remains the same throughout the first pulsation. Outside these two regions the wave spectral power at the dominant pulsation period is low and it is not meaningful to construct polarisation hodograms. Throughout the second pulsation, at 17:48 UT, the polarisation sense is everywhere CW at positions in the SABRE field of view exhibiting high wave spectral power at the dominant pulsation period. There is no change in the polarisation sense during the second pulsation.
2.4 Summary of case study 1
During this first case study, the westward velocities (east-ward electrojet) observed in the SABRE field of view, taken in conjunction with the EISCAT-X magnetometer data, indicate that the SABRE field of view is located equatorward of the substorm-enhanced westward elec-trojet. The Nordli and Faroes magnetometer data posi-tion the field of view at longitudes which encompass the substorm current wedge. In particular, the upward FAC at the western end of the wedge and the wedge centre are demonstrated to have moved westwards across the longi-tudes of the SABRE field of view between the two pulsa-tions. The spectral and spatial characteristics of the two
Table 4.
Event 1 Event 2
Spectral power east-west 64.6—65.0°N 64.6—64.8°N
component 8.5—10.0°E 6.0—9.0°E
north-south 65.6—65.8°N 64.2—65.0°N, 65.4—65.6°N
component 7.5—8.0°E 6.0—8.0°E 3.0—5.0°E
Spatial velocity Mostly uniform Enhanced flow
Westward 64.2—65.0°N
Velocity magnitude Uniform Shear\65.0°N
Polarisation 2 regions CW everywhere
ACW'65.6°N, (5.0°E CW(65.6°N, '4.0°E
Pi2 pulsations observed within the SABRE field of view during the first substorm interval are summarised in Table 4. These changing pulsation characteristics are ob-served at latitudes equatorward of the substorm enhanced westward electrojet, and therefore the auroral break-up, but within the longitude range of the substorm current wedge. When examining the spatial velocity patterns at substorm onset it has been observed that, in the majority of cases, the background velocity is westward rather than the expected eastward velocity associated with the sub-storm enhanced westward electrojet when the mag-netometer data position the radar field of view within the substorm current wedge (Yeoman et al., 1991; Bradshaw
et al., 1994). These authors suggested that the wedge may
have a more complicated velocity structure than just an enhanced eastward velocity. In this case study there was a pronounced enhancement in westward velocity during the second event which is spatially identified with the region of peak wave spectral power at the dominant pulsation frequency.
Further evidence for the westward movement of the onset region may be obtained by considering the four-quadrant, multi-region polarisation pattern derived from magnetometer data ordered by the substorm centred co-ordinates (Pashin et al., 1982; Samson and Harrold, 1983; Samson and Rostoker, 1983). Based upon this model, the change from ACW to CW polarisation sense when going from higher to lower latitudes observed by SABRE places the radar field of view at the western edge of the substorm onset region for the first pulsation. The CW polarisation for the second pulsation would place the SABRE field of view even closer in longitude to the centre of the onset region but still below the onset latitude, implying a west-ward movement of this region from event 1 to event 2. This is consistent with the substorm current wedge loca-tions determined earlier. The model of Pashin et al. (1982) predicts an enlargement and westward movement of this region of enhanced current. The region of peak wave spectral power at the dominant pulsation period observed by SABRE also moves to the west and enlarges in longitu-dinal extent between the two pulsations. The complete polarisation pattern is not observed in this study because the regions of peak wave spectral power are relatively small and the width of the field of view (12°) is too small to observe the total current system, typically 40° of longitude (Samson and Harrold, 1983).
Field-line resonance theory predicts an amplitude max-imum and a latitudinal change in polarisation sense about the latitude of the resonance region (Southwood, 1974; Chen and Hasegawa, 1974). Such a latitudinal reversal in Pi2 polarisation sense has been observed previously in ground magnetometer data (Bjo¨rnsson et al., 1971; Fukunishi, 1975). A latitudinal change in polarisation sense is only observed for the first pulsation. There are no FFT derived amplitude and phase measurements across the SABRE field of view available for this interval because of the short period and duration of the pulsations. Thus, it is not possible to state definitively that either or both of the pulsations arise from a field line resonance mecha-nism.
Yeoman et al. (1990) propose a twin source Pi2 pulsa-tion generapulsa-tion model which has two main regions of different polarisation sense. The two areas of differing polarisation in event 1 have the opposite sense to those suggested by Yeoman et al. (1990) in their twin source Pi2 pulsation generation model. There is only a single region of CW polarisation in the SABRE field of view for the second pulsation. In the Yeoman et al. (1990) model such a polarisation sense implies the radar was in the region dominated by the auroral zone source.
In summary, the pulsations in this case study are best described by models featuring the interaction of field-aligned and ionospheric currents with the SABRE field of view situated equatorward and to the west of the region of onset initially but becoming closer for the second pulsation.
3 Case interval 2: SABRE auroral zone signatures associated with Pi2 pulsations
3.1 SABRE and magnetometer signatures
During the interval 23:30 UT on day 355, 1982 to 00:20 UT on day 356, 1982 four Pi2 pulsations occurred, all of which are well resolved by SABRE (Fig. 4). Mag-netometer data are only available from the mid-latitude BGS station at Wick and from the stations of the EISCAT cross for this interval. The Wick magnetogram indicates pulsations at 23:40 UT, 23:49 UT, 23:54 UT and 00:14 UT. The unfiltered magnetogram from Wick at the time of the first three pulsations displays features which are similar to
Fig. 4. Time series data for the event on day 355/356 1982. From top
to bottom of the figure, unfiltered and filtered ground magnetometer
data from the only operational BGS station at this time (Wick) are presented together with filtered SABRE east-west and north-south velocity component data
those caused by the passage overhead or slightly poleward of a WTS (Kisabeth and Rostoker, 1973). There is a sharp decrease in the already negative H-component, a pro-nounced positive onset in the D-component and an initial positive Z-component bay which turns negative at 00:02 UT. This interval is very disturbed in the EISCAT cross data and the magnetometer data are difficult to interpret. The main feature is a clear negative X-compon-ent bay at 00:00 UT which is largest at MUO and SOD indicating that the westward electrojet is centred close to these stations. The EISCAT magnetometer cross Z-com-ponent data indicate that all available stations are situ-ated to the north of centre of the westward electrojet during the first three pulsations. As the lowest latitude station SOD is at 67.4°N geographic, the centre of the westward electrojet must be equatorward of this and, therefore, at a similar latitude to the centre of the SABRE field of view.
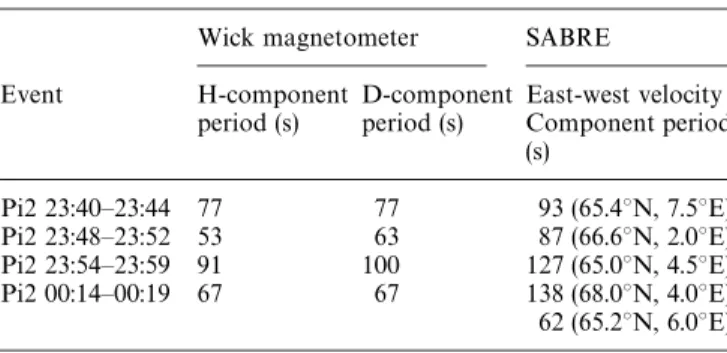
Table 5.
Wick magnetometer SABRE
Event H-component D-component East-west velocity period (s) period (s) Component period
(s) Pi2 23:40—23:44 77 77 93 (65.4°N, 7.5°E) Pi2 23:48—23:52 53 63 87 (66.6°N, 2.0°E) Pi2 23:54—23:59 91 100 127 (65.0°N, 4.5°E) Pi2 00:14—00:19 67 67 138 (68.0°N, 4.0°E) 62 (65.2°N, 6.0°E) 3.2 Spectral analysis
The results of a comparative ME spectral analysis of the Wick magnetometer and SABRE data are given in Table 5. The majority of the wave spectral power is found in the east-west velocity component of the SABRE data. The dominant period at Wick is considerably lower than that in the SABRE data for all four pulsations. The spec-trum at SABRE of the last pulsation does have a second-ary peak (62 s) with only slightly less spectral power than the dominant period which is close to the dominant period at Wick (67 s). The differences in pulsation period may result from the complex system of FAC and ionos-pheric currents present at the time of the pulsation (see later) which suggest that the SABRE field of view is located close to the generation region of the pulsations whereas Wick is equatorward and observes the single resonant pulsation period normally seen at lower latit-udes.
The spatial distribution of the wave spectral power at the dominant pulsation period was also investigated for each of the four Pi2 pulsations during this interval. In each case the peak wave spectral power is concentrated in a single cell in the SABRE field of view (Table 5). In the case of the fourth pulsation there are two regions of peak wave spectral power apparent, corresponding to the two pulsation periods present. There is no consistent motion of the position of the peak wave spectral power from event to event. In five of twenty-two intervals of multiple pulsa-tion onsets, Bradshaw (1989) observed that the posipulsa-tion in the SABRE field of view of the cell exhibiting peak wave spectral power oscillates to the east and west in an appar-ently random manner. Similar observations were present-ed by Gelpi et al. (1985) in a study of eleven substorm intervals at mid-latitudes. Due to the highly localised regions of spectral power it has not been possible to conduct a polarisation analysis over even a limited part of the radar field of view.
3.3 SABRE spatial velocity patterns
The SABRE spatial velocity patterns observed during this sequence of Pi2 pulsations are typical of those ob-served at and following substorm-expansion phase onset (Bradshaw et al., 1994). The background velocity is ini-tially eastward throughout the field of view but at the
Fig. 5. A sequence of 20 s resolution SABRE spatial velocity plots from day 355, 1982 at the time of the second Pi2 pulsation where a region of strongly eastward velocity replaces the south-eastward
velocity that had been present. The two separate regions then move apart, the shear and gap between the two perhaps indicating the presence of a sheet of field-aligned current
onset of the first Pi2 pulsation at 23:40 UT, a region of south-eastward velocity appears in the north-east of the field of view and moves equatorward through the field of view until only this band of north-west to south-east oriented south-eastward velocity is in the field of view. This pattern remains until 23:49 UT, just after the onset of the second Pi2, when the velocity turns sharply equator-ward for 40 seconds (Bradshaw et al., 1994, Fig. 5) before returning to a south-eastward direction for a minute. Towards the end of the second pulsation at 23:50:40 UT, however, a different, more complex, feature is observed in the spatial velocity pattern. The poleward half of the region of south-eastward velocity rotates to point strongly eastward while the equatorward half remains as it was (Fig. 5). These two regions then move apart slightly as time progresses. The gaps between the different regions and a shear in the ionospheric spatial velocity pattern suggest the presence of FAC sheets (Waldock et al., 1988), the enhanced conductivity having shorted-out the ionos-pheric electric field.
The electric field distribution associated with the sub-storm ionospheric and FAC at\23:51 UT (Fig. 5) during the time of the second pulsation can be obtained by rotating the velocity vectors clockwise through 90°. In the westward electrojet (eastward velocities) the electric field is directed toward the gap in the spatial velocity patterns
from the poleward side and away from the gap on the equatorward side. This implies that an upward FAC sheet is located poleward of a downward FAC sheet in agree-ment with the distribution of substorm FAC modelled by Baumjohann et al. (1981) at the time of a local auroral break-up.
These electric field structures are similar to those pro-posed by Southwood and Hughes (1983, Fig. 9) to give rise to a spatially localized transverse magnetic perturba-tion on the ground. In their simplest case a pair of upward and downward FAC are closed by Pedersen currents in the ionosphere. Southwood and Hughes (1983, Fig. 12) also present a similar pair of FAC and ionospheric electric field configuration resulting from a change in ionospheric conductivity and the launching of an Alfve´n wave impulse at substorm onset. The SABRE electric field vectors, how-ever, are not parallel on either side of the gap as suggested by the simple schematic of Southwood and Hughes (1983) but this could be caused by a non-uniform conductivity distribution in the ionosphere.
A final possible explanation is that the observed elec-tric field configuration may represent that suggested by Southwood and Hughes (1985) in their travelling wave model for Pi2 pulsations. However, the ‘highly conducting strip’ envisaged in this model would have to be very narrow to explain the observations presented here.
Conversely however, Bradshaw (1989) found that the wave spectral power at the dominant Pi2 pulsation period in the SABRE data was normally very localised to only one or two cells in the SABRE field of view. In this case the cells are not coincident with the highly conducting strip (Fig. 5 and Table 5).
A similar highly structured velocity pattern was present at the onset time of the third pulsation (23:54 UT). The two distinct regions of velocity above have each rotated ACW by \45°. The equatorward region of south-east-ward velocity is now eastsouth-east-ward directed while the polesouth-east-ward region of eastward velocity is now north and north-east-ward directed. The changed orientation of the two separ-ate regions of velocity between the second and third Pi2 pulsations may have arisen from changes in the non-uni-form ionospheric conductivity distribution and/or electric fields. This configuration remains until 23:55 UT at which time the two regions of velocity move poleward out of the field of view to be replaced by purely eastward velocity throughout the field of view by 23:56 UT.
At the onset of the final Pi2 pulsation in the series, 00:14 UT, a region of poleward velocity is observed in the north-west of the SABRE field of view, accompanied by the disappearance of a large region of backscatter from the east of the field of view. This situation lasts until the end of the pulsation at 00:19 UT, the velocity then return-ing to the steady eastward velocity typical of the westward electrojet. The peak in the wave spectral power at the longer of the two pulsation period components observed by SABRE during this interval was centred on this region of poleward velocity.
3.4 Summary of case interval 2
The SABRE spatial velocity data observed during this case study indicate the complex system of field-aligned and ionospheric currents during the magnetospheric sub-storm, and the manner in which these currents change as the substorm progresses. At the onset of the first pulsa-tion, a region of south-eastward velocity moves equator-ward through the field of view to fill it until the onset of the second pulsation. At this time the velocity turns sharp-ly equatorward for 40 s before returning to a south-east-ward direction. Subsequently, before the end of the second pulsation, the velocity splits into two distinct regions indicating the appearance in the ionosphere of a pair of FAC. This pattern evolves further at the time of the third pulsation with both regions rotating ACW by a similar amount to produce a new configuration of ionospheric and FAC. Towards the end of the pulsation, both regions move poleward out of the field of view leaving purely eastward velocity typical of the westward electrojet. A re-gion of poleward velocity appears in the north-west of the field of view for the duration of the final pulsation before the velocity returns to eastward throughout the field of view once more.
The most interesting feature of the Pi2 pulsations ob-served by SABRE during this case study is the difference in dominant pulsation periods observed by SABRE and the Wick magnetometer. For the first three pulsations, the
SABRE period is always longer. The field-line resonance mechanism would produce a longer period at higher lati-tudes from a broadband, transient magnetospheric source associated with an earthward surge of plasma at substorm onset coupling to the geomagnetic field. Alternatively, the two different periods may result from two separate sour-ces, one a transient Alfve´nic source at high-latitudes, the other from a monochromatic, lower latitude cavity reso-nance source (Yeoman et al., 1990). If this is the case, then the SABRE field of view is in the region of influence of both the transient, high-latitude auroral zone source and the lower latitude cavity resonance source at the time of the final of the four pulsations. The separation in longi-tude as well as in latilongi-tude of the two spectral peaks in the SABRE field of view implies an additional longitudinal separation of the two sources as described in the model (Yeoman et al., 1990).
4 Case interval 3: low magnetic activity signature of SABRE Pi2 pulsations
4.1 Introduction
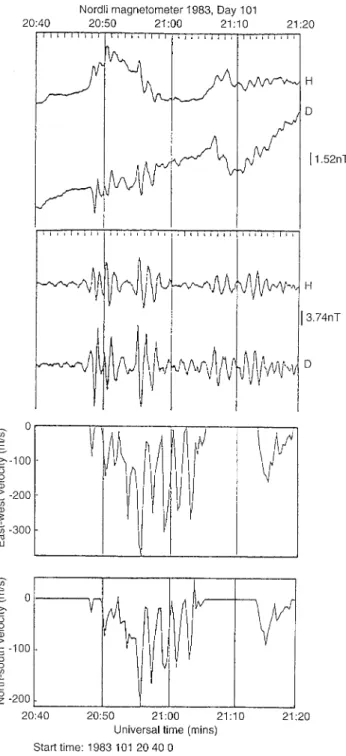
Four Pi2 pulsations occurred in the interval 20:40 UT to 21:20 UT on day 101, 1983 (Fig. 6). The Nordli magneto-gram indicates pulsations at 20:48 UT, 20:54 UT, 21:05 UT and 21:11 UT. Magnetic activity was low at this time (Kp"2-, Lerwick-K"1). The EISCAT cross mag-netometer data (not shown) indicate weak (\50 nT) nega-tive X-component bays at ALT, KAU and MUO starting at 20:47 UT and lasting until 20:55 UT at which time they become positive. At ALT, the Z-component increases by \50 nT between 20:47 and 20:57 UT before decreasing. At KAU, the Z-component decreases initially at 20:47 UT before increasing from 20:50 to 21:00 UT and then de-creasing again. The size of the bays suggest weak sub-storm electrojets at the time of the first two pulsations and indicate a westward electrojet at 20:47 UT centred be-tween KAU and ALT, which changes to an eastward electrojet at\20:57 UT. Furthermore, there is no signifi-cant X-component bay activity at either PEL or SOD. If extended westwards, this eastward electrojet would be at a similar geomagnetic latitude to the location of the pole-ward, continuous velocity region observed within the SABRE field of view which is therefore located equator-ward of the auroral zone generation region for the Pi2 pulsations during this interval.
Backscatter returns are first observed by SABRE dur-ing this interval at the onset of the first pulsation at 20:49 UT and die-out at 21:05 UT (Fig. 6) indicating that the backscatter appears to have been produced by the onset of the first pulsation. There is a small amount of backscatter during the last event. Backscatter does not fill the complete field of view during these two events but is limited to a region between 66.0°N and 68.0°N and can be divided into two regimes. Poleward of 67.0°N a region of backscatter is present throughout the two events. This region moves slowly equatorward during the interval but remains separate from the second, smaller backscatter region which is equatorward of 67.0°N and appears and
Fig. 6. Time series data for the Pi2 pulsations present on day 101, 1983. From top to bottom, unfiltered and filtered ground mag-netometer data from Nordli are presented together with SABRE east-west and north-south velocity component data. The SABRE data were averaged over the small region of backscatter present during the event, from 66° to 67.6°N and 4° at 6°E
disappears during the interval. The SABRE east-west and north-south velocity component time series data present-ed in Fig. 6 were obtainpresent-ed by averaging over all the backscatter present, i.e. between 66° and 67.6°N and 4° to 6°E. Ground magnetometers average over an area of scale size 100 km in the ionosphere so that features of smaller scale size are averaged out of ground mag-netometer data (Hughes, 1974). The smaller equatorward
region of backscatter observed by SABRE during this period has a scale size of this order or less, which may account for some of the differences in the signatures observed.
4.2 SABRE and magnetometer pulsation signatures
The SABRE time series of the two irregularity drift velo-city components differ from those observed by the BGS ground magnetometer at Nordli (Fig. 6). Although the onset of backscatter returns observed by SABRE is coinci-dent with the first pulsation on the ground, SABRE does not observe this pulsation well. The first clear oscillations in the SABRE data appear before the onset of the second pulsation on the ground and continue after the end of the second pulsation in the magnetometer data. The construc-tion of a time series by averaging over the whole region of backscatter observed during the pulsation (Fig. 6, bottom) indicates that the poleward backscatter region produces a bay-like signature on top of which the equatorward on-off backscatter returns superimpose the oscillatory sig-nature of the pulsation. The radar data from the iono-sphere suggest a sequence of two pulsations, the first is of low amplitude, of similar period to, and coincident with, that observed on the ground. There is then a simultaneous phase skip in both data sets at about 20:53:40 UT between the two pulsations indicating the arrival or commence-ment of the second wave packet simultaneously at both the radar and magnetometer sites. The second pulsation however has different characteristics in the ground mag-netometer and radar data as discussed later.
4.3 Spectral analysis
Visual inspection of the respective waveforms indicates that the pulsation periods observed on the ground and in the ionosphere are somewhat different. On the ground, the dominant ME period for the first pulsation is about 60 s and this increases to around 90 s for the second. SABRE does not observe the first pulsation well but the pulsation period appears similar to that on the ground. The domi-nant ME period for the five cycles of the SABRE pulsation starting just before 20:54 UT is 117 s.
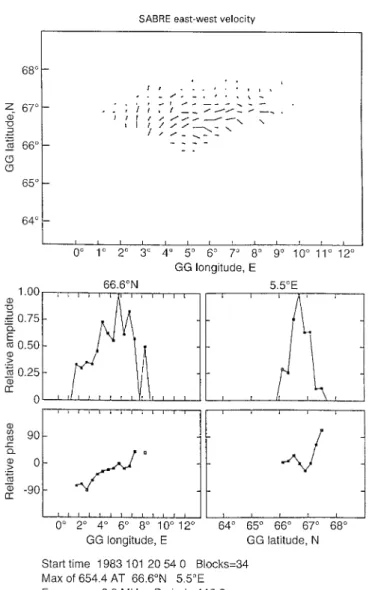
As this pulsation has a longer period in the SABRE data than those considered in the previous intervals and is observed for five cycles, it was also possible to undertake FFT spectral analysis on the SABRE data obtained for this pulsation. The dominant period occurs at 113 s, in agreement with the ME spectral analysis within the res-olution of the SABRE FFT spectrum. The amplitude and phase characteristics of the SABRE east-west velocity component at this dominant period are presented in Fig. 7. The phase variation as a function of latitude is very complicated around the position of the amplitude peak. The longitudinal phase difference of\50° in \3° of longi-tude implies an azimuthal wave number (m value) of\17 and the phase leading in the east indicates a westward propagating wave. The majority of Pi2 pulsations ob-served normally display westward phase motion although
Fig. 7. Amplitude and phase characteristics throughout the SABRE field of view (top) determined from FFT spectral analysis of the SABRE east-west velocity component data on day 101, 1983. The amplitude (middle) and phase (bottom) as a function of latitude are very complicated around the amplitude peak while the longitudinal phase difference of\50° in \3° of longitude implies an m value of \17 and a westward propagating wave
the m-value is normally a lot smaller, typically (4 (Mier Jedrzejowicz and Southwood, 1979; Lester et al., 1983), 8 (Lester et al., 1985) although Sutcliffe and Nielsen (1992) present events where it exceeds 10. The SABRE polarisation, derived from FFT and hodogram analysis, is linear in both cases at the latitude of the amplitude peak. Equator-ward of the peak, the SABRE polarisation is ACW in agreement with the ACW polarisation observed on the ground at Nordli, which is also equatorward of the ampli-tude peak. Mier-Jedrzejowicz and Southwood (1979) found that ACW polarisation was associated with westward phase propagation of the Pi2 pulsation signals on the nightside.
4.4 Discussion of case interval 3
The substorm interval from day 101, 1983, is characterised by a weak westward electrojet at the EISCAT cross but
westward velocities (eastward electrojet) at SABRE. Two Pi2 pulsations present in the magnetometer data have simultaneous signatures in the SABRE data. Initially, both SABRE and the Nordli magnetometer data appear to observe the same type of pulsation for the first event but the second observed by SABRE is totally different from that on the ground and seems to be driven by a separate source. The presence of a phase skip between the first and second pulsations seen simultaneously in both the ground magnetometer and SABRE data implies an impulsive source for this second pulsation (Mier-Jedrzejowicz and Hughes, 1980) with the driving function being switched on at the time of the phase skip. This second SABRE pulsa-tion remains of the same large amplitude in both velocity components, is of longer period than on the ground, and, unlike the ground pulsation which decays, lasts for longer before stopping abruptly, perhaps when the source is switched off. There was also a phase skip apparent before the later pulsations that were not observed by SABRE. The high azimuthal wave number, m, suggested by the FFT analysis implies the presence of a fast mode wave in a relatively localised region of the ionosphere (Lester et al., 1983).
McDiarmid and Allan (1990) modelled the coherent radar signature of a pulsation consisting of transient and cavity resonance driven components. This signature should include an amplitude envelope that is modulated with time and a pulsation period that changes during the course of the pulsation from two periods present at the start to only one towards the end. This occurs as the cavity resonance component period becomes dominant, the transient component having died-out. (Note that McDiarmid and Allan, 1990 do not comment on the ground magnetic signature of the wave.) In addition, there should be a latitudinal dependence of the pulsation period during the time of the transient pulsation, the longer field lines at higher latitudes producing a longer pulsation period. This should be apparent in the coherent radar Range-Time-Intensity (RTI) type data as a change in the slope of the on-off backscatter patch with latitude. When the slopes of the patches are all the same towards the end of the pulsation, the cavity resonance mode is dominant and the transient pulsation has died away. The study of such a pulsation was recently presented by McDiarmid
et al. (1994). In the RTI from Wick for the interval on day
101, 1983 the patches of backscatter observed occur rather irregularly and over a limited latitude range, 66.0—67.6°N. The main poleward region of backscatter moves equator-ward during the interval but there is no phase change with radar range apparent in the backscatter associated with the pulsation, i.e. there is no sloping of the backscatter patches observed.
The FFT-derived amplitude and phase analysis over the SABRE field of view at the dominant pulsation period suggested a fast mode compressional wave with m\17 and westward phase motion observed over the longitudi-nal extent of the field of view. The latitudilongitudi-nal phase vari-ation was complicated at the position of the amplitude peak. The presence of the simultaneous phase skip poses the question of what switches on the second pulsation. Yeoman et al. (1992) observed storm-time Pc5 pulsations
with the Wick radar and these exhibited an m number similar to that recorded for the pulsation under investiga-tion. In addition, the pulsations were strongly attenuated on the ground and had a period equal to the second or third harmonic of that in the Wick radar data. However, in the case of the storm-time Pc5s, the RTI from Wick did exhibit strong equatorward phase propagation with radar range so that they must be a different wave mode to that observed here. Yeoman et al. (1992) suggested that these Pc5 pulsations may be driven by wave-particle interac-tions. That would not seem to be the case for this study. Further insight may be gained by considering the two separate signatures observed simultaneously by SABRE in time series data from different latitudes. The signature poleward of the FFT-derived amplitude peak in the SABRE field of view produces the ‘bay-like’ signature in the SABRE data, while the pulsation electric field pro-duces an oscillatory signature equatorward of the ampli-tude peak. The dual source model for Pi2 pulsations (Yeoman et al., 1990), includes an auroral zone impulsive source and a lower latitude cavity resonance driven source. The modelling of the signatures expected in coher-ent radar data by McDiarmid and Allan (1990) suggests the simultaneous and spatially coincident presence of two waves initially before the impulsive transient wave dies-out and the cavity resonance driven wave becomes domi-nant. This was not apparent in the SABRE data.
A final possibility is that the two signatures which arise in the SABRE data at different latitudes result from a compressional surge of plasma earthward at substorm onset to produce the poleward ‘bay’ signature in the ionosphere which then couples to the density gradient at the plasmapause and produces a field line resonance. This then produces the transient oscillatory signature observed by SABRE at lower latitudes in the field of view. It is not certain how this fits in with the magnetometer signature of two temporally separate pulsations. Changing geophysi-cal conditions e.g. the size of the magnetospheric cavity or a change in the plasma density, might explain the change in period of the waves observed on the ground. A different harmonic of the wave may be excited or the fast mode source may have coupled to a different field line. However, the appearance of a 90 s pulsation after a 60 s pulsation is harder to explain unless a different harmonic of the wave is excited on the geomagnetic field line.
Summarising this interval, the differences between the pulsation signatures observed by SABRE and on the ground by the magnetometer remain to be explained. The Nordli magnetometer is offset slightly in both latitude and longitude from the position in the SABRE field of view displaying the pulsation signatures so that some alteration to the signal may have taken place in travelling to the ground. The high m number recorded for the SABRE pulsation indicates a fairly localised event so that the Nordli magnetometer might not be close enough to ob-serve the same pulsation signature. The ground pulsation signature is affected by changes in conductivity and dur-ing a substorm the height-integrated Hall and Pedersen conductances can change by an order of magnitude on time scales similar to the pulsation period. However, the different spectral characteristics but the same driving force
for the second pulsation suggest a more complicated coupling of wave modes, the exact nature of which re-mains unclear at the present time.
5 Summary and conclusions
Three case studies of substorm intervals containing Pi2 pulsations observed by SABRE under different prevailing magnetic conditions have been presented. The time series signature of the SABRE Pi2 pulsation is highly dependent on the position of the SABRE field of view relative to the substorm current wedge and/or pulsation generation re-gion. This position obviously changes with local time and the level of magnetic activity, the auroral oval moves equatorwards and expands in width as activity increases. In two of the three case studies presented here, the SABRE field of view is situated either in the latitude/longitude sector where the ionospheric and FAC associated with the pulsation generation region move into and across the radar field of view or where the auroral zone signature of the pulsations changes to that observed at mid-latitudes. In the third interval, SABRE is equatorward of the sub-storm associated electrojets.
When magnetic activity is low, as in the third case study, the SABRE field of view is located equatorward of the auroral zone pulsation generation region. The signa-ture in the SABRE time series is unexpectedly complex. The large pulsation amplitude in both components sug-gests the presence of two different wave modes. The results of SABRE FFT spectral analysis indicate that this signa-ture results from a fast mode wave with high m number displaying westward phase propagation. The second pul-sation during the low magnetic activity case study ob-served by SABRE and the ground magnetometers appears to be driven by the same impulsive source as a simulta-neous phase skip is observed by the two instruments. There is however, little decay in amplitude in the SABRE signature before the wave ends abruptly. The exact nature of the driving mechanism for the second pulsation and the coupling involved between the complex ionospheric and classical, damped ground pulsation signatures remains unclear at present.
At times of higher magnetic activity the ionospheric and FAC associated with the substorm current wedge can be observed to move into the SABRE field of view. In the first case study, the substorm current wedge currents move westwards across the longitudes of SABRE field of view and the polarisation and spectral characteristics of the two Pi2 pulsations observed by SABRE at this time could be explained by these changes. During the second case study, the currents move equatorward into the field of view and then poleward out of it over the course of four Pi2 pulsations. Again the observations delimited two sep-arate regions associated with the spectral content of the four Pi2 pulsations observed. A field line resonance gen-eration mechanism may be able to account for these spectral differences.
In all three case studies there is evidence to support a twin source model of Pi2 pulsation generation (Yeoman
polarisation sense were observed separated in latitude and longitude which may be indicative of the twin travelling wave source suggested in the model. The second case study contained pulsations in SABRE from the auroral zone pulsation generation region. These pulsations had periods greater than the corresponding period from the Wick ground magnetometer station at lower latitude. At the time of the final pulsation in the series SABRE ob-served two pulsation signatures separated in both latitude and longitude. In the lower latitude region of the field of view, the pulsation had a period roughly equal to that observed by the ground magnetometer at Wick. At the highest latitudes in the field of view, a pulsation of longer period was observed associated with a region of poleward velocity. As the EISCAT cross magnetometer data indi-cate that the substorm enhanced electrojets and FAC had moved poleward prior to the final pulsation, the longer period pulsation is associated with the auroral zone source while the shorter period pulsation is associated with a lower latitude source. During the third case study, SABRE observed a separate and distinct signature pole-ward of an oscillatory pulsation signature. The pulsation signatures observed were different in the SABRE and ground magnetometer data. Both the magnetometer and SABRE data contained two pulsations during the interval although they displayed different signatures for the second pulsation. The exact relationship between the driven ionospheric and classical, damped ground pulsation sig-natures observed is unclear at present as is the nature of the driving mechanism.
Acknowledgements. SABRE was a joint project between the
Univer-sity of Leicester, the Max Planck Institut fur Aeronomie, Lindau, and the Swedish Institut for Space Physics, Uppsala. The BGS magnetometer network was deployed and maintained by the Geomagnetism Research Group of the British Geological Survey in Edinburgh. EGB acknowledges the receipt of a SERC CASE award with the BGS in Edinburgh and also support from SERC research grant GRH32025. Magnetometer Data from the EISCAT cross array were provided for the intervals of interest to this investigation by H. Lu¨hr, University of Braunschweig. The authors would like to thank the referees for their constructive comments.
The Editor in Chief thanks D. Orr and another referee for their help in evaluating this paper.
References
Baumjohann, W., R. J. Pellinen, H. J. Opgenoorth, and E. Nielsen, Joint two-dimensional observations of ground magnetic and electric fields associated with auroral zone currents 4. Current systems associated with local auroral break-ups, Planet. Space
Sci., 29, 431—447, 1981.
Bjo~ rnsson, A., O. Hillebrand, and H. Voelker, First observational results of geomagnetic Pi2 and Pc5 pulsations on a north-south profile through Europe, Z. Geophys., 37, 1031—1042, 1971. Bradshaw, E. G., SABRE and magnetometer studies of substorm
associated pulsations, Ph.D. Thesis, University of Leicester, Leicester, UK, 1989.
Bradshaw, E. G., M. Lester, and T. B. Jones, SABRE observations of structured ionospheric flows during substorm expansion phase onset, Ann. Geophysicae, 12, 1027—1038, 1994.
Chen, L., and A. Hasegawa, A theory of long period magnetic pulsations. 1. Steady state excitation of a field line resonance,
J. Geophys. Res., 79, 1024—1032, 1974.
Fukinishi, H., Polarisation changes of geomagnetic Pi2 pulsations associated with the plasmapause, J. Geophys. Res., 80, 98—110, 1975.
Gelpi, C., W. J. Hughes, H. J. Singer, and M. Lester, Mid-latitude Pi2 polarisation pattern and synchronous orbit magnetic activ-ity, J. Geophys. Res., 90, 6451—6458, 1985.
Hughes, W. J., The effect of the atmosphere and ionosphere on long period magnetospheric micropulsations, Planet. Space Sci., 22, 1157—1172, 1974.
Kisabeth, J. L., and G. Rostoker, Current flow in auroral loops and surges inferred from ground-based magnetic observations,
J. Geophys. Res., 78, 5573—5584, 1973.
Lester, M., W. J. Hughes, and H. J. Singer, Polarisation patterns of Pi2 magnetic pulsations and the substorm current wedge,
J. Geophys. Res., 88, 7958—7966, 1983.
Lester, M., W. J. Hughes, and H. J. Singer, Longitudinal structure in Pi2 pulsations and the substorm current wedge, J. Geophys. Res., 89, 5489—5494, 1984.
Lester, M., K.-H. Glassmeier, and J. Behrens, Pi2 pulsations and the eastward electrojet: a case study, Planet. Space Sci., 33, 351—364, 1985.
Lester, M., H. J. Singer, D. P. Smits, and W. J. Hughes, Pi2 pulsations and the substorm current wedge: low-latitude polar-ization, J. Geophys. Res., 94, 17133—17141, 1989.
Lu~ hr, H., S. Thu~rey, and N. Klo~cker, The EISCAT magnetometer cross. Operational aspects — first results, Geophys. Surveys, 6, 305-3, 1984.
McDiarmid, D. R., and W. Allan, Simulation and analysis of auroral radar signatures generated by a magnetosphere cavity mode,
J. Geophys. Res., 95, 20,911—20922, 1990.
McDiarmid, D. R., T. K. Yeoman, I. F. Grant, and W. Allan, Simultaneous observations of a travelling vortex structure in the morning sector and a field line resonance in the postnoon sector,
J. Geophys. Res., 99, 8891—8904, 1994.
McPherron, R. L., C. T. Russell, and M. P. Aubry, Satellite studies of magnetospheric substorms on August 15, 1968. 9. Phenom-enological model for substorms, J. Geophys. Res., 78, 3131—3149, 1973.
Mier-Jedrzejowicz, W. A. C., and D. J. Southwood, The east-west structure of mid-latitude geomagnetic pulsations in the 8—25 mHz band, Planet. Space Sci., 27, 617—630, 1979
Mier-Jedrzejowicz, W. A. C., and W. J. Hughes, Phase skipping and packet structure in geomagnetic pulsation signals, J. Geophys.
Res., 85, 6888—6892, 1980.
Nielsen, E., W. Guttler, E. C. Thomas, C. P. Stewart, T. B. Jones, and A. Hedberg, SABRE — a new radar auroral backscatter experi-ment, Nature, 304, 712—714, 1983.
Pashin, A. B., K.-H. Glassmeier, W. Baumjohann, O. M. Raspopov, A. G. Yahnin, H. J. Opgenoorth, and R. J. Pellinen, Pi2 magnetic pulsations, auroral break-ups and the substorm current wedge: a case study, J. Geophys. 51, 223—233, 1982.
Rostoker, G., The polarization characteristics of Pi2 micro-pulsations and their relation to the determination of possible source mechanisms for the production of night-time impul-sive micropulsation activity, Can. J. Phys., 45, 1319—1335, 1967.
Samson, J. C., and B. G. Harrold, Maps of the polarisation of high latitude Pi2’s, J. Geophys. Res., 88, 5736—5744, 1983.
Samson, J. C., and G. Rostoker, Polarisation characteristics of Pi2 pulsations and implications for their source mechanism; influ-ence of the westward travelling surge, Planet. Space Sci., 31, 435—458, 1983.
Sergeev, V. A., L. I. Vagina, R. D. Elphinstone, J. S. Murphree, D. J. Hearn, L. L. Cogger, and M. L. Johnson, Comparison of UV spectral signatures with the substorm current wedge as predicted by an inversion algorithm, J. Geophys. Res., 101, 2615—2627, 1996.
Southwood, D. J., Some features of field line resonances in the magnetosphere, Planet. Space Sci., 22, 483—491, 1974.
Southwood, D. J., and W. F. Stuart, ‘Pulsations at the substorm onset’, in Dynamics of the Magnetosphere (Ed. S.-I. Akasofu, D. Reidel, Dordrecht, Netherlands, 1980.
Southwood, D. J., and W. J. Hughes, Theory of hydromagnetic waves in the magnetosphere, Space Sci. Rev., 35, 301—366, 1983. Southwood, D. J., and W. J. Hughes, Concerning the structure of Pi2
pulsations, J. Geophys. Res., 90, 386—392, 1985.
Stuart, W. F., A special feature of impulsive pulsations (Pi2),
J. Atmos. ¹err. Phys., 34, 829—8, 1972.
Sutcliffe, P. R., and E. Nielsen, STARE observations of Pi2 pulsa-tions, Geophys. Res. ¸ett., 17, 603—606, 1990.
Sutcliffe, P. R., and E. Nielsen, The ionospheric signature of Pi2 pulsations observed by STARE, J. Geophys. Res., 97, 10621—10636, 1992.
Waldock, J. A., D. J. Southwood, M. P. Freeman, and M. Lester, Pulsations observed during high-speed flow in the ionosphere,
J. Geophys. Res., 93, 12883—12891, 1988.
Yeoman, T. K., and D. Orr, Phase and spectral power of mid-latitude Pi2 pulsations: evidence for a plasmaspheric cavity resonance,
Planet. Space Sci., 37, 1367—1383, 1989.
Yeoman, T. K., D. K. Milling, and D. Orr, Pi2 polarisation patterns on the UK Sub-Auroral Magnetometer Network (SAMNET),
Planet. Space Sci., 38, 589—602, 1990.
Yeoman, T. K., M. Lester, D. K. Milling, and D. Orr, Polarisation, propagation and MHD wave modes of Pi2 pulsations: SABRE/SAMNET results, Planet. Space Sci., 39, 983—998, 1991.
Yeoman, T. K., Mao Tian, M. Lester, and T. B. Jones, A study of Pc5 hydromagnetic waves with equatorward phase propagation,