HAL Id: hal-00317676
https://hal.archives-ouvertes.fr/hal-00317676
Submitted on 3 Nov 2004
HAL is a multi-disciplinary open access
archive for the deposit and dissemination of
sci-entific research documents, whether they are
pub-lished or not. The documents may come from
teaching and research institutions in France or
abroad, or from public or private research centers.
L’archive ouverte pluridisciplinaire HAL, est
destinée au dépôt et à la diffusion de documents
scientifiques de niveau recherche, publiés ou non,
émanant des établissements d’enseignement et de
recherche français ou étrangers, des laboratoires
publics ou privés.
Properties of internal planetary-scale inertio gravity
waves in the mesosphere
H. G. Mayr, J. G. Mengel, E. R. Talaat, H. S. Porter, K. L. Chan
To cite this version:
H. G. Mayr, J. G. Mengel, E. R. Talaat, H. S. Porter, K. L. Chan. Properties of internal
planetary-scale inertio gravity waves in the mesosphere. Annales Geophysicae, European Geosciences Union,
2004, 22 (10), pp.3421-3435. �hal-00317676�
Annales Geophysicae (2004) 22: 3421–3435 SRef-ID: 1432-0576/ag/2004-22-3421 © European Geosciences Union 2004
Annales
Geophysicae
Properties of internal planetary-scale inertio gravity waves in the
mesosphere
H. G. Mayr1, J. G. Mengel2, E. R. Talaat3, H. S. Porter4, and K. L. Chan5
1Goddard Space Flight Center, Greenbelt, MD, 20 771, USA 2Science Systems and Applications, Inc., Lanham, MD, USA
3Applied Physics Laboratory, Johns Hopkins University, Laurel, MD, USA 4Furman University, Greenville, SC, USA
5Hong Kong University of Science and Technology, Hong Kong, China
Received: 25 March 2004 – Revised: 16 July 2004 – Accepted: 16 August 2004 – Published: 3 November 2004
Abstract. At high latitudes in the upper mesosphere, hor-izontal wind oscillations have been observed with periods around 10 h. Waves with such a period are generated in our Numerical Spectral Model (NSM), and they are identified as planetary-scale inertio gravity waves (IGW). These IGWs have periods between 9 and 11 h and appear above 60 km in the zonal mean (m=0), as well as in m=1 to 4, propagating eastward and westward. Under the influence of the Corio-lis force, the amplitudes of the waves propagating westward are larger at high latitudes than those propagating eastward. The waves grow in magnitude at least up to about 100 km and have vertical wavelengths around 25 km. Applying a running window of 15 days for spectral analysis, the amplitudes in the wind field are typically between 10 and 20 m/s and can reach 30 m/s in the westward propagating component for m=1 at the poles. In the temperature perturbations, the wave ampli-tudes above 100 km are typically 5 K and as large as 10 K for m=0 at the poles. The IGWs are intermittent but reveal systematic seasonal variations, with the largest amplitudes occurring generally in late winter and spring. Numerical ex-periments show that such waves are also generated without excitation of the migrating tides. The amplitudes and peri-ods then are similar, indicating that the tides are not essen-tial to generate the waves. However, the seasonal variations without tides are significantly different, which leads to the conclusion that non linear interactions between the semidi-urnal tide and planetary waves must contribute to the excita-tion of the IGWs. Directly or indirectly through the plane-tary waves, the IGWs are apparently excited by the instabili-ties that arise in the zonal mean circulation. When the solar heating is turned off for m=0, both the PWs and IGWs essen-tially disappear. That the IGWs and PWs have common roots in their excitation mechanism is also indicated by the strik-ing similarity of their seasonal variations in the lower meso-sphere. Compared to the PWs, however, the planetary-scale
Correspondence to: H. G. Mayr
(hans.mayr@gsfc.nasa.gov)
IGWs propagate zonally with much larger phase speeds. In contrast to the PWs, the IGWs thus are not affected much by interactions with the background zonal winds whose sea-sonal variations drastically change with altitude in the sphere. Since the IGWs can propagate through the meso-sphere without much interaction, except for viscous dissipa-tion, one should then expect that they reach the thermosphere above with significant and measurable amplitudes.
Key words. Meteorology and atmospheric dynamics (gen-eral circulation; middle atmosphere dynamics; waves and tides)
1 Introduction
Distinct oscillations with periods around 10 h have been ob-served with various measurement techniques in the upper mesosphere.
Some of the earliest observations were reported by Man-son et al. (1982) and ManMan-son and Meek (1990), who ana-lyzed MF radar measurements of winds at Saskatoon (52◦N) to study the dynamical components of the upper mesosphere. In addition to the tides and planetary waves that character-ize the region, their analysis revealed persistent oscillations with periods of 9–10 and 16 h, which the authors attributed to non linear coupling between semidiurnal tide and the 2-day wave. The same kind of wave oscillations were also observed by Ruster (1994) based on wind measurements from a VHF radar at 69◦N, and Sivjee et al. (1994) saw the waves at
Eu-reka (80◦N) in Michelson interferometer measurements of temperature.
Hernandez et al. (1992) observed a pronounced westward propagating wave with a period of 10.1 h near the South Pole. The data were derived from Doppler shifting and a broaden-ing of OH emissions at altitudes near 90 km, which yielded winds and temperatures, respectively. Horizontal winds were additionally provided by the medium frequency radar
mea-3422 H. G. Mayr et al.: Planetary-scale inertio gravity waves in the mesosphere
surements from the Scott Base at 78◦S (Fraser, 1984).
Dur-ing the period of observations in August 1991 (austral win-ter), the 10-h wave was apparent in the wind data at both stations. The wave dominated at the South Pole, but at 78◦S the semidiurnal tide was more prominent. Horizontal winds at the pole must have zonal wave number m=1, and the ob-served phase progression revealed that the 10-h wave was propagating westward. The related temperature variations for this wave number should vanish at the pole, and the anal-ysis indeed showed that. Based on the measurements at both stations, Hernandez et al. (1992) concluded from the inferred vertical wavelengths of about 100 km that they probably ob-served an m=1 Lamb wave with meridional wave number two. A 10-h wave in the horizontal winds with m=1 was also observed by Hernandez et al. (1993) during the 1992 southern winter in the Antarctic polar region, but in this case it was accompanied by a westward propagating 12-h wave they called an inertio gravity wave. Forbes et al. (1995) also observed a 12-h wave in radar measurements near the North Pole and interpreted it to be a non-migrating semidiurnal tide. Westward propagating wind oscillations with periods be-tween about 7 and 12 h for m=1 have been observed with meteor radar measurements near the South Pole (88◦S) dur-ing the winter months (Forbes et al., 1999; Portnyagin et al., 2000). The observations were interpreted in terms of ”normal modes” or Lamb waves, but inertio gravity waves, nonlinear coupling between tides and planetary waves, and in-situ exci-tation of short-period waves were also mentioned as possible explanations.
Based on the measurements from an array of instruments at northern high latitudes, Wu et al. (2002) presented compre-hensive observations of a 10-h oscillation in the temperature and wind fields of the mesosphere and lower thermosphere. By comparing the phase of the wave at different stations, a zonal wave number m=5 was inferred, and the vertical wave-length was estimated to be about 53 km. These wave proper-ties led to the conclusion that nonlinear coupling between the semidiurnal tide and the 2-day planetary wave was the likely excitation mechanism.
In a recent paper (Mayr et al., 2003), we reported that our model produces in the upper mesosphere horizontal wind os-cillations with periods around 10 h. The osos-cillations were identified as internal planetary-scale inertio gravity waves (IGW), thought to be generated in the model by instabilities like the planetary waves. It is the purpose of the present paper to: a) describe more fully the IGWs in the temperature and wind fields that are generated by the model and b) amend our earlier interpretation by recognizing that nonlinear coupling between tides and planetary waves is also a likely excitation mechanism.
2 Numerical spectral model
The Numerical spectral model (NSM), introduced by Chan et al. (1994a), has been discussed extensively in the litera-ture with 2-D and 3-D applications to describe the middle
atmosphere dynamics (e.g. Mengel et al., 1995; Mayr et al., 2001, 2003, 2004). Since the present version of the NSM is virtually identical to the one employed in a recent study (Mayr et al., 2004), we summarize the essential features.
Formulated with spherical harmonics, the NSM is trun-cated at zonal wave number m=4 and describes the tides and planetary waves, as well as the Semiannual Oscillation (SAO) and Quasi-biennial Oscillation (QBO) for m=0. The maximum meridional wave numbers retained in the model is n=12 to yield 12 Gaussian points per hemisphere. In the ver-tical, the integration step is 0.5 km (below 120 km), and the time step is typically about 5 min.
In the zonal mean (m=0), the NSM is driven by UV radi-ation absorbed in the mesosphere and stratosphere (Strobel, 1978) and by EUV radiation absorbed in the thermosphere. A heat source is also applied in the troposphere to reproduce qualitatively the observed zonal jets and temperature varia-tions near the tropopause. Separate from =0, the solar heat-ing rates for the thermally driven migratheat-ing tides with m=1 and 2 in the middle atmosphere and troposphere are taken from Forbes and Garrett (1978). The planetary waves (PW), and IGWs discussed here, are solely generated internally, i.e. without explicit excitation sources related to tropospheric convection or flow over topography. Newtonian cooling is applied to describe the radiative loss with a parameterization provided by Zhu (1989).
An important feature of the NSM is that it incorporates the Doppler Spread Parameterization (DSP) for small-scale gravity waves (GW) developed by Hines (1997a,b), which has also been applied successfully in a number of other mod-els (e.g. Akmaev, 2001; Manzini et al., 1997).
3 Model results
3.1 Wave patterns and global survey
In light of the measurements by Hernandez et al. (1992) that were carried out at polar latitudes, we present with Fig. 1 the computed meridional winds a) at 84◦N and b) 77◦N for m=1, covering the altitude range between 80 and 110 km. (Horizontal winds at the poles must have zonal wave num-ber m=1.) The winds are presented for a period of 4 days in March of the third model year, during a time when rel-atively large waves are generated with evident periodicities around 10 h, as illustrated in two cases. With contour in-tervals of a) 10 m/s and b) 6 m/s, the amplitudes are gener-ally well above 20 m/s and grow with height. Although the waves are highly variable, the pattern indicates downward phase propagation with vertical wavelengths of about 20 km. Our analysis shows that the waves at polar latitudes prop-agate primarily westward and thus reproduce an important aspect of the observations by Hernandez et al. (1992), who inferred the same for their 10-h oscillation.
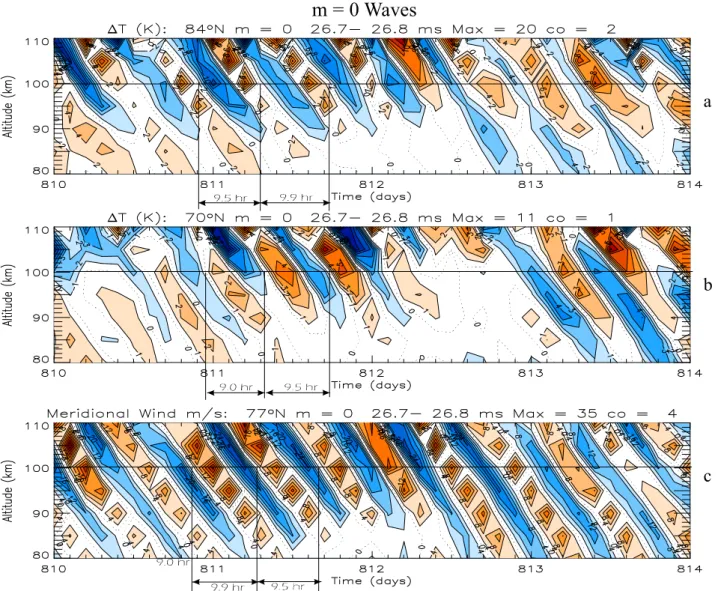
Temperature variations at the poles must have zonal wave number m=0. Analogous to Fig. 1, we present with Fig. 2 the computed temperature perturbations for this wave number at
H. G. Mayr et al.: Planetary-scale inertio gravity waves in the mesosphere 3423 10.7 hr 9.9 hr 9.0 hr 8.8 hr
m = 1 Waves
a
b
Fig. 1. Time-altitude contour plot of meridional winds for zonal wave number m=1 at 84◦N (a) and 77◦N (b), Gaussian points, during March (late northern winter) of the third model year when waves with periods around 10 h are prominent at polar latitudes. The contour intervals are 10 m/s (a) and 6 m/s (b). For illustrative purpose, two examples of wave periods are identified from zero intersections. (To reduce output, the model results are recorded with 5-km altitude intervals, which causes the contours to appear ragged.)
a) 84◦N and b) 70◦N, covering the same altitude range and time span. The displayed wave periods (from zero crossings) are between 9 and 10 h, the vertical wavelengths are typically around 20 km, and the amplitudes often exceed 5 K and tend to grow with altitude.
For m=0, the temperature waves are associated energeti-cally with meridional (irrotational) wind oscillations, which we present in Fig. 2c for a latitude of 77◦N. With a contour interval of 4 m/s, the computed winds have amplitudes ex-ceeding 20 m/s and reveal periods similar to those apparent in the temperature. The vertical wavelengths are again close to 20 km.
The above model results were displayed for selected zonal wave numbers to highlight the oscillations at high latitudes, 84◦N, close to the pole: for m=1 and 0 in the meridional winds and temperature perturbations, respectively. The over-all patterns would not be very different had we displayed in
Figs. 1 and 2 the results for the combined wave numbers m=0 to 4 retained in the model. Away from the pole, however, the variability and maximum amplitudes would be larger.
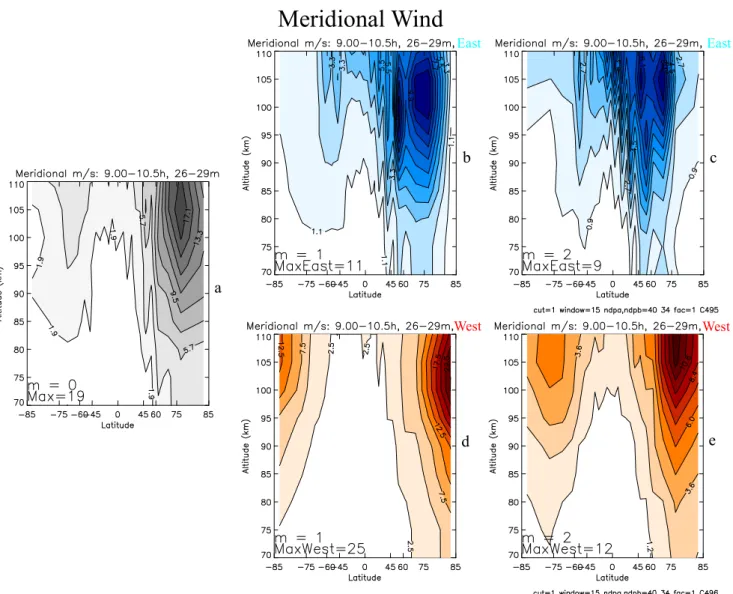
Anticipating results later discussed that reveal distinct sea-sonal variations, we present in Figs. 3 and 4 the merid-ional winds and temperature perturbations, respectively, for the time span 26 to 29 months (March through May). The maximum amplitudes are shown of the stationary wave for m=0 a), and the eastward b,c) and westward d,e) propagating waves for m=1 and 2 with periods between 9 and 10.5 h. For this time span and range of periods analyzed, the m=1 west-ward propagating wave in the meridional winds is largest, with 25 m/s near 100 km, and it peaks in the northern polar region. With a maximum amplitude of 19 m/s near 75◦N, the stationary (non-migrating) wave for m=0 is also prominent as Fig. 2c indicated. The asymmetry between the Northern and Southern Hemispheres, evident in all the wave numbers and
3424 H. G. Mayr et al.: Planetary-scale inertio gravity waves in the mesosphere
a
b
c
m = 0 Waves
Figu
Fig. 2. Similar to Fig. 1 but for m=0 temperature variations at 84◦N (a) and 70◦N (b) and related meridional winds at 77◦N (c). The contour intervals are 2 K (a), 1 K (b) and 4 m/s (c).
in both the eastward as well as westward propagating waves, clearly indicates that the amplitudes are much larger during the late winter months than in summer.
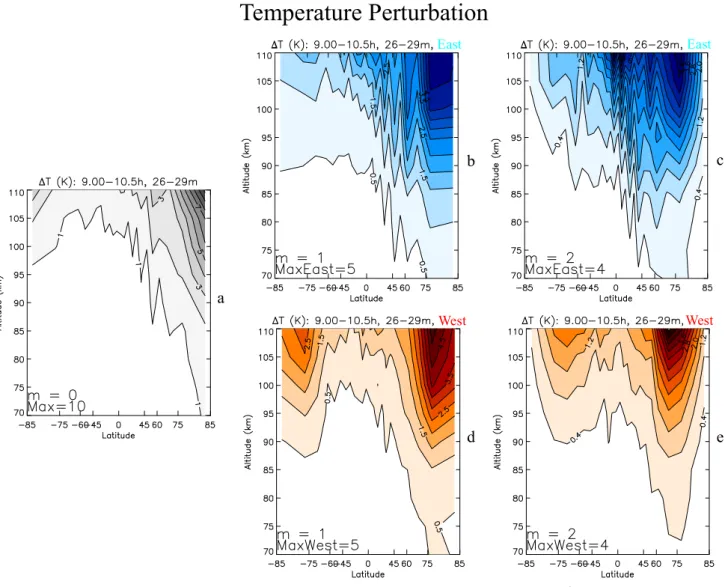
In many respects, as expected, the wave patterns for the temperature perturbations in Fig. 4 are similar to those in the meridional winds just discussed. The difference is that the largest amplitudes occur in the polar region for m=0, which approach 10 K at 110 km in the winter hemisphere. In the other wave numbers, the largest temperature amplitudes are close to 5 K.
The above results describe the maximum amplitudes ex-tracted from a time span of 3 months during the northern win-ter and spring season. With a running window of 15 days ap-plied in the analysis, the recorded amplitudes represent more than 30 cycles for waves with periods around 10 h. This in-dicates that the waves are persistent at times with substantial wind and temperature amplitudes.
3.2 Spectral analysis
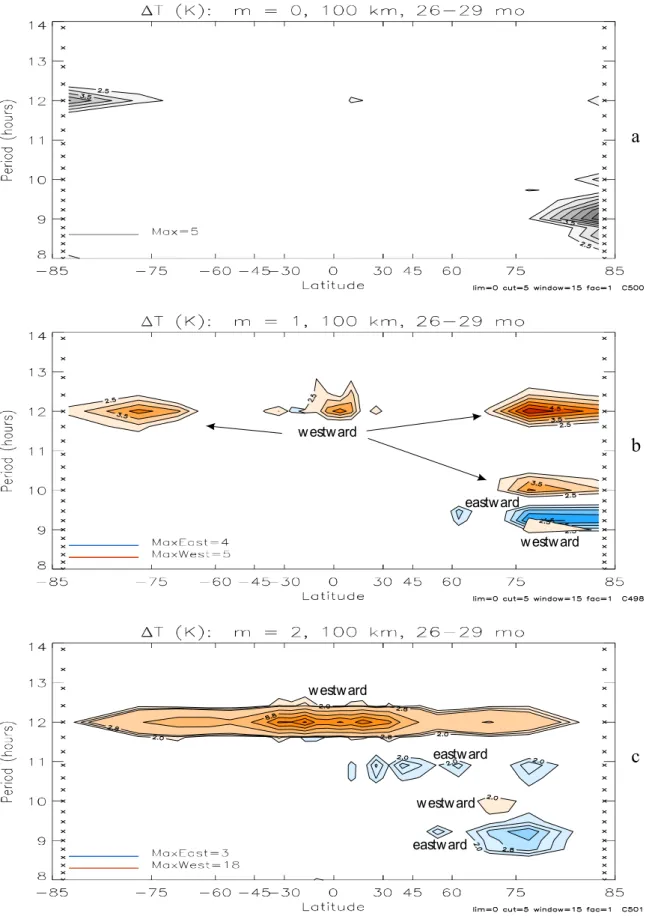
To provide further details about the waves discussed here, we present in Figs. 5 and 6 the amplitude spectra of the merid-ional winds and temperature perturbations. For the wave numbers a) m=0, b) m=1 and c) m=2, the spectra are dis-played at 100 km altitude as functions of latitude, covering periods between 8 and 14 h. The spectra for each of the wave numbers displayed contain several wave periods with promi-nent amplitudes, but the waves are not necessarily excited simultaneously.
The meridional winds for the m=0 waves (Fig. 5a) show a peak with 17 m/s near 75◦N, which has a period close to 9 h. Such a wave also appears in the temperature perturbation (Fig. 6a) that peaks in the Arctic with an amplitude of about 5 K, which is consistent with the results presented earlier in Fig. 2. In the Antarctic temperature (Fig. 6a) there is also a stationary semidiurnal 12-h tide (generated by nonlinear coupling between the migrating tide and planetary waves),
H. G. Mayr et al.: Planetary-scale inertio gravity waves in the mesosphere 3425
Meridional Wind
East West West Easta
b
c
d
e
Fig. 3. Maximum meridional wind amplitudes of stationary m=0 wave (a), and eastward (b, c) and westward (d, e) propagating waves (m=1,
2) for periods from 9 to 10.5 h, computed with a running window of 15 days from the time span of 26 to 29 months (March through May of the third model year). Contour plots are presented versus height and latitude, applying the Mercator projection to expand the regions at high latitudes where the waves are prominent. In each panel, the largest amplitudes from the contours are stated.
but apparently it does not produce a meridional wind oscilla-tion that is large enough to appear in the truncated contours of Fig. 5a.
In Fig. 5b, the non-migrating 12-h tide for m=1 dominates in the polar regions, with a maximum amplitude close to 40 m/s (at 100 km), and it is shown propagating westward. This tide is produced in the NSM with planetary waves, as Forbes et al. (1995) had proposed on the basis of radar mea-surements. The corresponding westward temperature tide (Fig. 6b) reaches amplitudes close to 5 K at high latitudes in the Northern Hemsiphere and amplitudes of about 4 K at equatorial latitudes. For the present paper, the waves of prin-cipal interest appear in the amplitude maxima with periods close to 10 and 9 h, which are shown both in the merid-ional winds (Fig. 5b) and in the temperature perturbations (Fig. 6b). During the 3-month time span, the westward prop-agating 10-h wave in the Northern Hemsiphere is seen to be
weaker than the non-migrating semidiurnal tide, but it still reaches amplitudes close to 24 m/s at 84◦ latitude and even larger values at the pole. For a more limited time span in March of the third model year, we had shown (Mayr et al., 2003) that the amplitude of the 10-h wave was larger than that of the non-migrating semidiurnal tide, which is not a typical situation but it simulates the scenario Heranandez et al. (1992) encountered. Waves with periods close to 9-h are shown in Figs. 5b and 6b, and they propagate eastward. In contrast to the m=1 westward waves that tend to peak at the poles, the much weaker eastward waves do not extend with significant amplitudes into the polar region.
For m=2, Figs. 5c and 6c show the large westward mi-grating 12-h semidiurnal tide that is produced by solar heat-ing, with amplitude maxima close to 50 m/s in the winds and more than 15 K in the temperature variations (variable con-tour intervals are used to describe these features). In the
3426 H. G. Mayr et al.: Planetary-scale inertio gravity waves in the mesosphere
Temperature Perturbation
East West West Easta
b
c
d
e
Fig. 4. Similar to Fig. 3 but for temperature perturbations.
Northern Hemsiphere, a westward propagating wave with periods around 10 h has wind amplitudes close to 10 m/s (Fig. 5c), and the corresponding temperature amplitude is only about 2 K (Fig. 6c). Compared to the westward prop-agating waves, the eastward waves occupy lower latitudes for m=2, as is the case for m=1. The eastward waves for the meridional winds, at low to mid latitudes, have amplitudes approaching 10 m/s with periods close to 9 and 11 h and the related temperature amplitudes are about 3 K.
To reveal the nature of the waves discussed here, we present with Fig. 7 contour plots of snapshots for the east-ward and westeast-ward propagating components. We chose a time span in mid September of the third model year when pronounced waves with 9-h periodicity are generated in the Southern Hemisphere. An analysis was then performed to extract the average wave characteristics, i.e. phase and ampli-tude as functions of altiampli-tude and latiampli-tude, delineating the east-ward and westeast-ward components. The patterns described in Fig. 7 are considered representative of the waves discussed. With a horizontal wavelength of about 40◦ in latitude, the
latitudinal variations of the eastward and westward propagat-ing waves differ significantly, as seen already from Figs. 3 through 6. The vertical wavelength of about 25 km is sim-ilar to that shown in Figs. 1 and 2. The relationship be-tween meridional and vertical wavelengths, revealed in the wave patterns shown, supports our interpretation (Mayr et al., 2003) that we are dealing with internal planetary scale inertio gravity waves (IGW) related to the Class I waves dis-cussed in the classical literature (Longuett-Higgins, 1968). 3.3 Seasonal variations
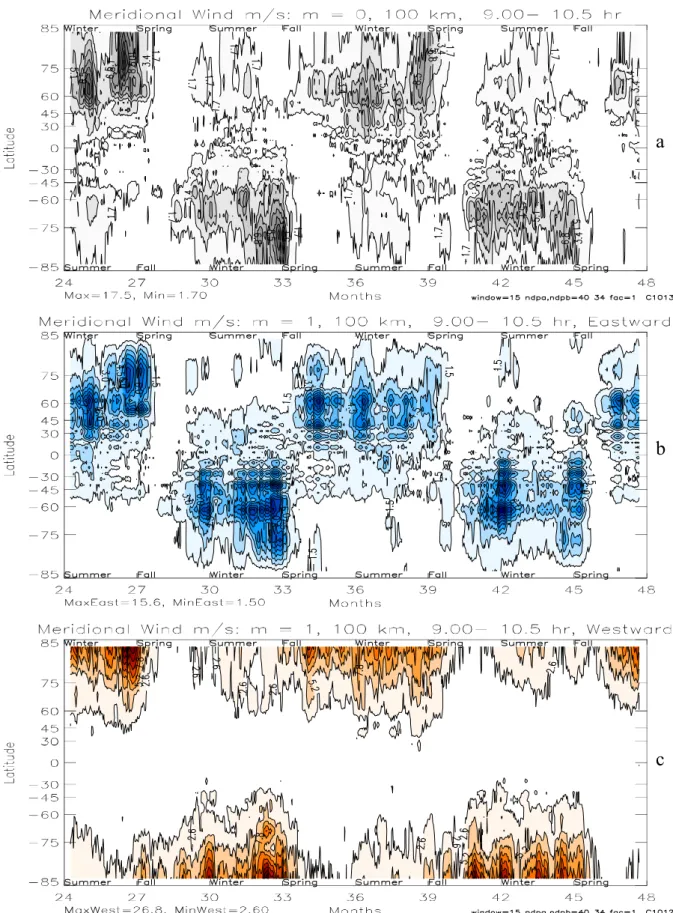
The IGWs presented here exhibit pronounced seasonal vari-ations as shown in Figs. 8 and 9, respectively, for the merid-ional winds and temperature variations at 100 km altitude. The amplitudes for a) m=0 and those for m=1 propagating b) eastward and c) westward are plotted versus latitude and time covering 24 months. In both hemispheres, these wave components tend to be excited preferentially during win-ter months, beginning in late fall and extending into spring.
H. G. Mayr et al.: Planetary-scale inertio gravity waves in the mesosphere 3427
a
b
c
Fig
w estw ard westward westward westward eastward eastward eastwardFig. 5. Maximum amplitude spectra for zonal wave numbers m=0 (a), m=1 (b) and m=2 (c) at 100 km for periods between 8 and 14 h,
computed from the 26 to 29 months time span (March through May) with a running window of 15 days. The gray scale is used for m=0 (no propagation), red for westward, and blue for eastward propagation. In (b) and (c), the contour intervals are variable to describe the large migrating and non-migrating tides. To eliminate clutter, the lowest 40% or 50% of contours are suppressed. The largest amplitudes from the contours are stated in each panel. The x-marks on the vertical axes denote the discrete periods for which the maximum amplitudes are computed to produce the contours.
3428 H. G. Mayr et al.: Planetary-scale inertio gravity waves in the mesosphere
a
b
c
Fig
westward westward westward westward eastward eastward eastwardH. G. Mayr et al.: Planetary-scale inertio gravity waves in the mesosphere 3429 Westward Eastward
T
im
e S
equ
en
ce
Fig. 7. Snapshots of the meridional winds in the Southern Hemisphere near 32.5 months (mid September), when waves are most prominent.
The winds are derived from 3-day time spans to describe the 9-h westward and eastward propagating waves. Plotted with 3-h time intervals, the phase of the waves is shown progressing downwards. (Since the numerical results are recorded with 5-km increments, the contours appear ragged.)
Consistent with the results shown earlier, the westward prop-agating waves for the meridional winds with wave number m=1 (Fig. 8c) are largely confined to high latitudes. The east-ward propagating waves (Fig. 8b), in contrast, do not extend with significant amplitudes into the polar regions but instead extend to low latitudes and across the equator. These patterns are characteristic of the seasonal and latitudinal variations throughout the mesosphere above 50 km.
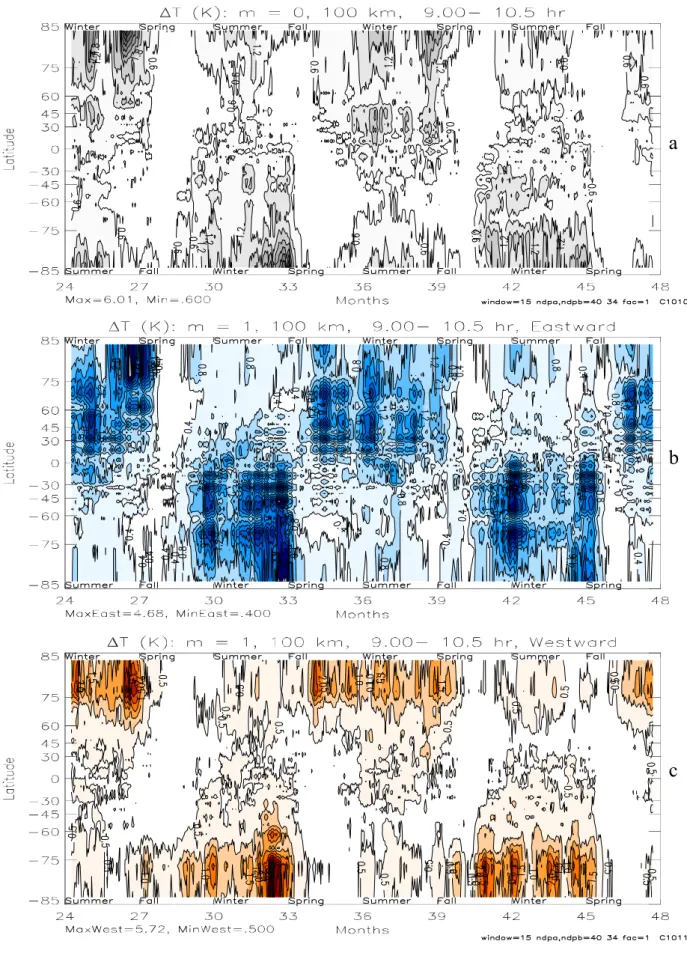
In the temperature variations (Fig. 9), the waves with m=0 a) are largest at polar latitudes. Consistent with the waves in the meridional winds for m=1, the corresponding tempera-ture amplitudes for the westward component are also largest at high latitudes (Fig. 9c), but they vanish at the poles. And the eastward waves (Fig. 9b) extend with substantial ampli-tudes (almost 5 K) towards equatorial latiampli-tudes. The wave patterns for m=2, 3 and 4 (not presented) reveal similar trends in the seasonal variations: i.e. the amplitudes tend to be largest during winter months approaching spring.
We carried out numerical experiments to shed some light on the possible excitation mechanisms for the waves. When the energy sources for the solar migrating diurnal and semidi-urnal tides are turned off, the IGWs are still excited, as shown in Fig. 10 for the meridional winds with m=1. Compared to Figs. 8b,c the amplitudes in Fig. 10 are of comparable mag-nitude (about 24 m/s maximum westward and 11 m/s east-ward). However, without the tidal excitation, the seasonal variations are significantly different. In Fig. 10, the largest amplitudes tend to occur around equinox during the fall and spring seasons, in contrast to the wave patterns seen in Fig. 8 that show the waves to be predominant during the winter and spring seasons. This indicates that the tides come into play in generating the IGWs, and it is reasonable to suggest that nonlinear coupling between semidiurnal tide and m=3 plan-etary waves with periods close to 2 days is the likely excita-tion mechanism, as had been suggested in the literature (e.g. Manson et al., 1982; Manson and Meek, 1990; Ruster, 1994; Sivjee et al., 1994; Portnyagin et al., 2000; Wu et al., 2002).
3430 H. G. Mayr et al.: Planetary-scale inertio gravity waves in the mesosphere
a
b
c
Fi
Fig. 8. To characterize the seasonal and latitudinal variations in the meridional winds at 100 km, wave amplitudes are presented for the
stationary waves with m=0 (a), and the eastward (b) and westward (c) propagating m=1 components. For periods between 9 and 10.5 h, a moving window of 15 days is applied. Maximum (and minimum) amplitudes (m/s) are stated, i.e. 17.5 (a), 15.6 (b) and 26.8 (c).
H. G. Mayr et al.: Planetary-scale inertio gravity waves in the mesosphere 3431
a
b
c
3432 H. G. Mayr et al.: Planetary-scale inertio gravity waves in the mesosphere
a
b
Figure 10
Fig. 10. Similar to Fig. 8 but computed without excitation of the migrating diurnal and semidiurnal tides.
The relationship between IGWs and planetary waves (PW) is also indicated from the resemblance of their seasonal vari-ations. This is demonstrated with Fig. 11, where we show for comparison the PWs that appear in the model at 60 km. For PWs with m=1 and 3 (as well as m=2 and 4, not shown), the seasonal variations in the meridional winds closely resem-ble those seen in the IGWs (Fig. 8). In both hemispheres, at this altitude, the PWs (and IGWs, not shown) are more prevalent during the winter and spring seasons. The simi-larity in the seasonal variations, however, does not extend into the upper mesosphere, where the PWs tend to be larger in summer (Mayr et al., 2004) unlike the IGWs. With their longer oscillation periods, the slower propagating PWs inter-act with the zonal winds that reverse direction above 70 km. The much faster IGWs, in contrast, propagate through the mesosphere virtually unperturbed, except for viscous
dissi-pation. As these waves propagate to higher altitudes and in-crease in amplitude, the pattern in their seasonal variations thus essentially remains unchanged.
Numerical experiments show that the IGWs and PWs es-sentially disappear when the solar heating is turned off which drives the zonal mean (m=0) circulation and related temper-ature and pressure variations. Directly or indirectly through the PWs, the IGWs are likely produced by the instabilities that arise in the zonal mean circulation. Plumb (1983) pro-posed the baroclinic instability for generating the 2-day PWs, and Chan et al. (1994b) suggested that it produced the 4-day wave in their model. In discussing the PWs that are generated in our model (Mayr et al., 2004), the differences between the relative density and pressure variations for m=0 were evalu-ated to produce a measure of baroclinicity. It showed that the relative gradients are largest in winter at 50 and 70 km, but
H. G. Mayr et al.: Planetary-scale inertio gravity waves in the mesosphere 3433
a
b
Figure 11
Fig. 11. Computed seasonal variations of meridional winds at 60 km for planetary waves with zonal wave numbers m=1 and 3. The
resemblance with the seasonal variations of the IGWs in Fig. 8 indicates that both classes of waves have similar roots as discussed in the main text.
are larger in summer at 90 km. This pattern in the seasonal variations related to baroclinicity, including the variations with altitude, resembles the behavior seen in the PWs, which suggests that the baroclinic instability is indeed involved in exciting the waves. For the faster propagating IGWs, the sea-sonal variations would be dictated by the instability condi-tions below 70 km.
4 Discussions and conclusions
As we had pointed out earlier (Mayr et al., 2003), waves of the kind described here have been discussed in the classical literature by Longuett-Higgins (1968), who classified them as Class I waves. These waves have also been referred to as Inertio Gravity Waves (Volland, 1988; Andrews, Holton, and Leovy, 1987), which is appropriate since the Coriolis force
is still important for periods close to 12 h. Except for the ex-citation mechanism, the waves have the properties of atmo-spheric diurnal tides. Due to the action of the Coriolis force, the eastward and westward propagating components differ significantly. For the m=1 waves in Longuett-Higgins (1968) specifically, the westward wave thus peaks at the poles while the eastward wave tends to peak at mid latitudes – which is consistent with the numerical results earlier presented. Since the waves discussed here have zonal wave numbers m=0 to 4, we refer to them as planetary-scale inertio gravity waves (IGW). This distinction is justified in light of the inertio grav-ity waves observed in the middle atmosphere that have much shorter horizontal wavelengths (e.g. Fritts, 1984).
As seen from the numerical results presented, and in par-ticular from Figs. 8 and 9, the IGWs reveal persistent sea-sonal variations. Throughout the years, the IGWs tend to be
3434 H. G. Mayr et al.: Planetary-scale inertio gravity waves in the mesosphere
strongest in winter and spring, and they are decidedly weaker during summer months. Although not shown, this pattern in the seasonal variations of the IGWs is prevalent throughout the mesosphere. Such a pattern is also seen in the plane-tary waves (PWs) at altitudes around 60 km (Fig. 11), and the apparent similarity suggests that both classes of waves have similar roots.
We have shown with Fig. 10 that the IGWs still appear in the model when the migrating tides are not excited. The periods and amplitudes then are similar, which demonstrates that the tides are not essential to generate the IGWs, in prin-cipal. The waves under this condition, however, are differ-ent, especially their seasonal variations – and this indicates that the tides also do come into play. As pointed out earlier, nonlinear coupling between the semidiurnal tide and 2-day planetary waves for m=3 has been proposed in the literature as a mechanism to excite IGWs with periods of about 10 and 16 h. A prominent candidate for such interaction is the filter-ing of small-scale gravity waves (GW), parameterized in the NSM, which has been shown to produce nonlinear coupling between PWs and migrating tides to generate non-migrating tides. In light of the differences obtained with tidal excitation (Fig. 8) and without (Fig. 10), we are therefore amending our earlier interpretation (Mayr et al., 2003) by concluding that tide-PW interactions must additionally be involved to fully explain the seasonal variations of the IGWs.
When we turn off the solar heating that drives the m=0 temperature, pressure and wind fields, the IGW disappear, like the PWs. (Presently, there is no explicit source in the model to generate PWs or IGWs due to tropospheric con-vection or flow over topography, for example.) The IGWs are completely generated internally by the instabilities that can develop in the zonal mean circulation, and the baro-clinic instability is a prominent candidate. Our results sug-gest that instabilities excite the IGWs directly and also indi-rectly through the PWs that interact with tides.
Although the IGWs and PWs appear to have similar roots in the way they are produced, their propagation character-istics in the mesosphere are significantly different. With their low oscillation periods and large planetary-scale wave-lengths, the fast IGWs can propagate through the atmosphere without encountering critical levels. Except for viscous dis-sipation, the waves thus propagate virtually without attenua-tion to reach thermospheric altitudes. In contrast, the slower PWs can interact with the zonal circulation. The result is that the oscillation periods of the PWs are modified, and the character of the waves undergoes drastic changes, affecting the propagation direction and seasonal variations. This is ap-parent, for example, in the modeled PWs shown in Fig. 11 that prevail at 60 km in the winter hemisphere, but are more prevalent at 90 km in the summer hemisphere (not shown).
The fast planetary-scale IGWs discussed also differ from the inertio gravity waves with much lower phase speeds ear-lier mentioned, which make up the long period component of the saturated gravity wave spectrum in the middle atmo-sphere (Fritts, 1984). Such inertio gravity waves have been observed with radars (e.g. Fritts et al., 1984; Muraoka et al.,
1988, 1994; Tsuda et al., 1989), and they have horizontal wavelengths between 500 and 3000 km and periods between 5 and 11 h. These waves propagate with phase speeds that are close to the background zonal wind velocities, so that they are subject to critical level absorption and dissipation, which is evident from the observed altitude invariance of their am-plitudes.
Without tidal excitation and in certain seasons, the NSM produces IGWs with a spectrum that contributes significantly to the 12-h periodicity, so that semidiurnal tides are effec-tively generated. These pseudo-tides will be discussed in a separate paper.1
Acknowledgements. The authors are indebted to two anonymous
referees for valuable comments, which greatly contributed to im-prove the paper.
Topical Editor U.-P. Hoppe thanks two referees for their help in evaluating this paper.
References
Akmaev, R. A.: Simulation of large-scale dynamics in the meso-sphere and lower thermomeso-sphere with the Doppler-spread param-eterization of gravity waves: 1. Implementation and zonal mean climatologies, J. Geophys. Res., 106, 1193–1204, 2001. Andrews, D. G., Holton, J. R., and Leovy, C. B.: Middle
Atmo-sphere Dynamics, Academic Press, Orlando, 1987.
Chan, K. L., Mayr, H. G., Mengel, J. G., and Harris, I.: A “strat-ified” spectral model for stable and convective atmospheres, J. Comp. Phys., 113, 165–176, 1994a.
Chan, K. L., Mayr, H. G., Mengel, J. G., and Harris, I.: A spectral approach for studying middle and upper atmospheric phenom-ena, J. Atm. Terr. Phys., 56, 1399–1419, 1994b.
Forbes, J. M. and Garrett, H. B.: Thermal excitation of atmospheric tides due to insolation absorption by O3and H2O, Geophys. Res. Lett., 5, 1013–1016, 1978.
Forbes, J. M., Makarov, N. A., and Portnyagin, Y. I.: First results from the meteor radar at South Pole: A large 12-h oscillation with zonal wave number one, Geophys. Res. Lett., 22, 3247– 3250, 1995.
Forbes, J. M., Palo, S. E., Zhang, X., Portnyagin, Y. I., Makarov, N. A., and Merzlyakov, E. G.: Lamb waves in the lower ther-mosphere: Observational evidence and global consequences, J. Geophys. Res., 104, 17 107–17 115, 1999.
Fraser, G. J.: Summer circulation in the Antarctic middle atmo-sphere, J. Atm. Terr. Phys., 46, 143–146, 1984.
Fritts, D. C.: Gravity wave saturation in the middle atmosphere: A review of theory and observations, Rev. Geophys. Space Phys., 22, 275–308, 1984.
Fritts, D. C., Balsley, B. B., and Ecklund, W. L.: VHF echoes from the arctic mesosphere and lower thermosphere, Part II: Inter-pretations, in Dynamics of the Middle Atmosphere, Eds., J. R. Holton and T. Matsuno, 97–115, 1984.
Hernandez, G., Smith, R. W., Fraser, G. J., and Jones, W. L.: Large-scale waves in the upper mesosphere at antarctic high-latitudes, Geophys. Res. Lett., 19, 1347–1350, 1992.
Hernandez, G., Fraser, R. W., and Smith, G. J.: Mesospheric 12-h oscillation near south pole antarctica, Geophys. Res. Lett., 20, 1787–1790, 1993.
H. G. Mayr et al.: Planetary-scale inertio gravity waves in the mesosphere 3435
Hines, C. O.: Doppler-spread parameterization of gravity-wave mo-mentum deposition in the middle atmosphere, 1, Basic formula-tion, J. Atmos. Solar Terr. Phys., 59, 371–386, 1997a.
Hines, C. O.: Doppler-spread parameterization of gravity-wave mo-mentum deposition in the middle atmosphere, 2, Broad and quasi monochromatic spectra, and implementation, J. Atmos. Solar Terr. Phys., 59, 387–400, 1997b.
Longuett-Higgins, M. S.: The eigenfunctions of Laplace’s tidal equations over a sphere, Phi. Trans. Roy. Soc. London, A262, 511–607, 1968.
Manson, A. H., Meek, C. E., Gregory, J. B., and Chakrabarty, D. K.: Fluctuations in the tidal (24, 12 h) characteristics and oscillations (8h–5d) in the mesosphere and lower thermosphere (70–110 km): Saskatoon (52◦N, 107◦W), Planet. Space Sci., 30, 1283–1294, 1982.
Manson, A. H. and Meek, C. E.: Long period (8–20 h) wind oscil-lations in the middle atmosphere at Saskatoon (52◦N): Evidence for nonlinear tidal effects, Planet. Space Sci., 38, 1431–1441, 1990.
Manzini, E., McFarlane, N. A., and McLandress, C.: Impact of the Doppler spread parameterization the simulation of the middle at-mosphere circulation using the MA/ECHAM4 general circula-tion model, J. Geophys. Res., 102, 25 751–25 762, 1997. Mayr, H. G., Mengel, J. G., Chan, K. L., and Porter, H. S.:
Meso-sphere dynamics with gravity forcing: Part II, Planetary waves, J. Atm. Solar-Terr. Phys., 63, 1865–1881, 2001.
Mayr, H. G., Mengel, J. G., Talaat, E. R., Porter, H. S., and Chan, K. L.: Planetary-scale inertio gravity waves in the mesosphere, Geophys. Res. Lett., 30 (23), Art.-No. 2228, 2003.
Mayr, H. G., Mengel, J. G., Talaat, E. R., Porter, H. S., and Chan, K. L.: Modeling study of mesospheric planetary waves: Genesis and characteristics, Ann. Geophys., 22 (6), 1885–1902, 2004. Mengel, J. G., Mayr, H. G., Chan, K. L., Hines, C. O., Reddy, C.
A., Arnold, N. F., Porter, H. S.: Equatorial oscillations in the middle atmosphere generated by small-scale gravity waves, Geo-phys. Res. Lett., 22 , 3027–3030, 1995.
Muraoka, Y, Sugyama, T., and Kawahira, K.: Cause of a monochro-matic inertio-gravity wave breaking observed by the MU radar, Geophys. Res. Lett., 15 , 1349–1352, 1988.
Muraoka, Y, Fukao, S., Sugyama, T., Yamamoto, M., Nakamuro, T., Tsuda, T., and Kato, S.: Features of a mesospheric inertio-gravity wave observed with the MU radar, J. Atm. Terr. Phys., 56, 1163–1171, 1994.
Plumb, R. A.: Baroclinic instability of the summer mesosphere: A mechanism for the quasi-2-day wave?, J. Atmos. Sci., 40, 262– 270, 1983.
Portnyagin Y. I., Forbes, J. M., Merzlyakov, E. G., Makarov N. A., and Palo, S. E: Intra-diurnal wind variations observed in the lower thermosphere over the South Pole, Ann. Geophys., 18, 547–554, 2000.
Ruster, R.: VHF radar observations of nonlinear interactions in the summer polar mesosphere, J. Atm. Terr. Phys., 56, 1289–1299, 1994.
Sivjee, G. G., Walterscheid, R. L., and McEwen, D. J.: Planetary wave disturbances in the Arctic winter mesopause over Eureka (80◦N), Planet. Space Sci., 42, 973–986, 1994.
Strobel, D. F.: Parameterization of atmospheric heating from 15 to 120 km due to O2 and O3 absorption of solar radiation, J. Geo-phys. Res., 83, 6225–6230, 1978.
Tsuda, T., Inoue, T., Fritts, D. C., VanZandt, T. E., Kato, S., Sato, T., and Fukao, S.: MST radar observations of a saturated gravity wave spectrum, J. Atm. Sci., 46, 2440–2447, 1989.
Volland, H.: Atmospheric Tidal and Planetary Waves, Kluwer Aca-demic Publ., Boston, MA, 1988.
Wu, Q., Killeen, T. T., McEwen, D., Solomon, S. C., Guo, W., Siv-jee, G. G., and Reeves, J. M.: Observation of the mesospheric and lower thermospheric 10-h wave in the northern polar region, J. Geophys. Res., 107, Art. No. 1082, 2002.
Zhu, X: Radiative cooling calculated by random band models with S-1-beta tailed distribution, J. Atmos. Sci., 46, 511–520, 1989.