HAL Id: hal-00329235
https://hal.archives-ouvertes.fr/hal-00329235
Submitted on 1 Jan 2002
HAL is a multi-disciplinary open access
archive for the deposit and dissemination of
sci-entific research documents, whether they are
pub-lished or not. The documents may come from
teaching and research institutions in France or
abroad, or from public or private research centers.
L’archive ouverte pluridisciplinaire HAL, est
destinée au dépôt et à la diffusion de documents
scientifiques de niveau recherche, publiés ou non,
émanant des établissements d’enseignement et de
recherche français ou étrangers, des laboratoires
publics ou privés.
The relationship between the Sahelian and previous 2nd
Guinean rainy seasons: a monsoon regulation by soil
wetness?
N. Philippon, B. Fontaine
To cite this version:
N. Philippon, B. Fontaine. The relationship between the Sahelian and previous 2nd Guinean rainy
seasons: a monsoon regulation by soil wetness?. Annales Geophysicae, European Geosciences Union,
2002, 20 (4), pp.575-582. �hal-00329235�
Annales
Geophysicae
The relationship between the Sahelian and previous 2nd Guinean
rainy seasons: a monsoon regulation by soil wetness?
N. Philippon and B. Fontaine
Centre de Recherches de Climatologie, UMR 5080 CNRS, Universit´e de Bourgogne, 6 blvd. Gabriel, BP 138, 21000 Dijon, France
Received: 23 April 2001 – Revised: 19 September 2001 – Accepted: 29 October 2001
Abstract. The correlation of 0.61 found between observed
July–September Sahelian rainfall in year 0 and September– November Guinean rainfall in year −1, led us to explore the statistical relationships between precipitation, soil mois-ture and near surface Moist Static Energy (MSE) gradients in West Africa. These analyses were performed over suc-cessive 30-year periods and specifically, the most recent pe-riod between 1968–1998. It is shown from observations, Na-tional Centers for Environmental Predictions and NaNa-tional Center for Atmospheric Research (NCEP/NCAR) reanalyses and from the Global Soil Wetness Project (GSWP) database, that wet Sahelian rainy seasons are preceded by abnormally wet soils over the Sudan-Guinean belt during northern win-ter. Such moisture anomalies tend to hold during the dry season, then generate increasing MSE gradients just above the continent by March–April. These gradients have been shown to be of prime importance for monsoon dynamics and associated rainfall.
Key words. Hydrology (soil moisture) – Meteorology and
atmospheric dynamics (climatology)
1 Introduction
The long-term rainfall variability over West Africa and more particularly over the Sahel has been associated for a long time with specific Sea Surface Temperature (SST) anomaly patterns over the Atlantic Ocean (Lamb, 1978a, b), the global Tropics (Palmer, 1986; Wolter, 1989), and changes in land surface properties (Charney, 1975; Charney et al., 1977; Walker and Rowntree, 1977). However, despite the very sig-nificant improvements in observations, climate models, and computer technology, the predictability of west African rain-fall is not yet well assessed. Forecasting studies are still ex-perimental, and the robustness and skills of the results ob-tained through the use of long-term SST, for example, are Correspondence to: N. Philippon
(nphilipp@u-bourgogne.fr)
quite low. Indeed, the interannual variability observed over the last 30 years is not well reproduced.
Consequently, the potential role of surface properties on Sahelian rainfall variability must be further investigated. Re-cent studies pointed out the importance of the zonal and meridional gradients in the atmospheric boundary layer over the Gulf of Guinea – West Africa region. While Zheng and Eltahir (1998) demonstrated that alterations in vegetative cover along the Guinean coast have a significant impact on the monsoon circulation via changes in the Moist Static En-ergy (MSE) gradients, Fontaine and Philippon (2000) under-lined the importance of spring to summer evolution of such gradients over land for the Sahelian monsoon rainfall. Their recent hindcasts (forecasts performed during model training period) of seasonal amounts show a gain of ∼ 20% explained variance when the atmospheric forcing due to continental surfaces is taken into account (Philippon and Fontaine 1999, 2000). At the same time, in the framework of the Global Soil Wetness Project (GSWP), Douville and Chauvin (2000) have improved their dynamical predictions by considering more realistic soil moisture values over West Africa. In this study, we propose to explore the intraannual and interannual evolutions of the relationships linking continental rainfall, soil moisture and moist static energy gradients near the sur-face. For this purpose, in view of the sparseness of observed data for soil wetness and atmospheric moisture, this analy-sis uses 3 independent databases and is structured as follows: Sect. 2 investigates the relationships between West African rainy seasons through observations only; Sect. 3 presents the links between Sahelian rainfall and soil wetness evolution during the previous months, using a combination of obser-vations, NCEP/NCAR model outputs and GSWP database. These features are further illustrated using the years 1987 and 1988, which provide a strong contrast regarding West African rainfall. Section 4 shows the possible connection between spring soil wetness and the time evolution of MSE fields. Finally, Sect. 5 discusses the above results in terms of physical mechanisms.
576 N. Philippon and B. Fontaine: The relationship between the Sahelian and previous 2nd Guinean rainy seasons
JA JAS SON AMJ MJ
−0.3
−0.2
−0.1
0
0.1
0.2
0.3
0.4
0.5
0.6
0.7
season
corr. coef.
year (−1) year (0)
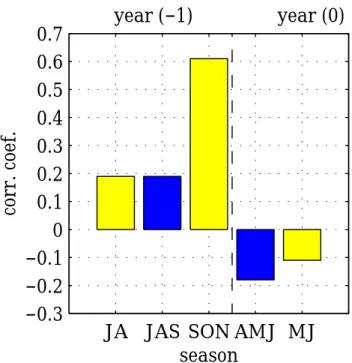
Fig. 1. Linear correlation coefficients over the period of 1968–
1998 between the Sahelian July–September rainy season (JAS 0) and the West African rainy seasons of previous months; light shaded bars: correlation with previous Guinean rainy seasons; dark shaded bars: correlation with previous Sahelian rainy seasons. Data source: Hulme database.
2 Statistical relationships between Sahelian summer
rainfall and previous West African rainy seasons
The rainfall data used in this study come from the CRU (Climatic Research Unit) database, which consists of, on a monthly basis, gridded (2.5◦ × 3.75◦) observed rain-fall data, at a global scale, from 1900 to 1998 (Hulme and Jones, 1993). We computed for both the Sahelian (12.5◦−17.5◦N/18.75◦W−18.75◦E) and Guinean (5◦−
7.5◦N/7.5◦W−7.5◦E) regions, several seasonal rainfall in-dexes over the period of 1968–1998: the April–June and July–September ones for the Sahel, the May–June, July– August and September–November ones for Guinea. These indexes refer to the rainfall amounts averaged over the do-mains mentioned above and are expressed in standardised anomalies (means set to zero, standard deviations set to one). They provide the time-evolution of the main rainy seasons over West Africa.
The statistical relationships between the JAS Sahelian sea-son, which records 80% of the annual rainfall amount, and the other previous rainy seasons, are documented using lin-ear correlation coefficients (Fig. 1). Interestingly, over the period of 1968–1998, rainfall anomalies observed over the Sahel in summer (JAS 0) are not significantly associated with any other preceding season, except the second Guinean rainy season (SON −1): r = 0.61, a value that exceeds the 99% level of significance for a series with 15◦of freedom (our se-ries have 16◦of freedom). This statistical relationship does
not depend on the data set since similar results can be re-trieved using, for example, the CRC (Centre de Recherches de Climatologie) database (not shown). The temporal stabil-ity of this correlation is documented in Figs. 2 and 3. Fig-ure 2 displays the raw times series over the 49-year period of 1950–1998: their correlation coefficient (r = 0.63) is still significant at the 99% statistical level. When the series are detrended (by removing the linear trend), the correlation slightly decreases (r = 0.5). This seems to be primarily due to the negative trend that is more marked before 1968. This particularly appears in Fig. 3, which provides correlation co-efficients between the detrended series over 30-year sliding windows. If we compare the values at the beginning and the end of the 1950–1998 period, we note a clear increase (by a factor 2) of the correlation coefficients. The key point is that over the most recent period characterised by a strong inter-annual variability, the second Guinean rainy season (SON) explains 40% of the following JAS Sahelian rainfall variabil-ity.
Albeit this correlation cannot be solely considered as a direct measure of causality, two key questions arise: what are the basic mechanisms that are able to explain such an 8-month delay (November–July) over the continent? What are the involved-in variables?
3 Soil wetness evolution before the Sahelian summer
rainfall
We suppose that such a delay could pass through land proper-ties sensible to soil wetness, such as vegetation cover, evap-oration, precipitation recycling. Since long-term in situ ob-servations spatially well distributed over West Africa do not exist currently for these variables, a first step is to check whether or not this hypothesis is verified through climate model outputs like those of the NCEP/NCAR. We chose to consider the precipitation rate (expressed in Kg/m2/s) that we converted in rainfall amounts (in mm) and Deep Soil Wet-ness (hereafter DSW); the latter provides the soil water con-tent between a 10 and 200 cm depth. These two variables are available over the period of 1958–1998 on a Gaussian grid and are used on a monthly scale. The reliability of the NCEP/NCAR reanalysed variables depends on the degree to which their values are determined by the model. According to the 4 confidence ranks proposed by Kalnay et al. (1996), precipitation and DSW are “class C” where classes range from “A” (for high reliable variables mainly influenced by observations) to “C” (for less reliable variables determined by the model); class “D” contains fields obtained from cli-matological values. However, DSW and the precipitation rate are well linked to monsoon dynamics over the region (Kalnay et al., 1996). Concerning rainfall data, Poccard et al. (2000) noticed important shifts before 1967; this point, along with the weaker correlations found between the rain-fall indexes during the 1950–1970’s (Fig. 3), explain why the next results will refer to the period of 1968–1998.
50 53 56 59 62 65 68 71 74 77 80 83 86 89 92 95 98 −3 −2 −1 0 1 2 3 year std. value
r=0.63 (0.5) Fig. 2. Standardised series of
rain-fall anomalies over the period of 1950– 1998; bars: in JAS 0 in Sahel; line: in SON −1 in Guinea. The values at the top right-hand corner present the corre-lation coefficients obtained between the two raw (r = 0.63) and two detrended series (r = 0.5, in brackets). Data source: Hulme database.
65 67 69 71 73 75 77 79 81 83 0.3 0.35 0.4 0.45 0.5 0.55 0.6 0.65 0.7
centre year of 30−year sliding window
95%
corr. coef.
Fig. 3. Linear correlation coefficients between the July–September
Sahelian rainfall (JAS 0) and the previous September-November Guinean rainy season (SON −1) computed on detrended series with successive 30-year sliding windows (1950–1998). Thin line: signif-icance level at 95%. Data source: Hulme database.
We first derived from the model outputs a JAS Sahelian rainfall index (referring to the same area as in the previ-ous section), and a Guinean-Sudanese DSW index. This in-dex covers both the Guinean as well as the Sudanese region (5◦−12◦N/15◦W−15◦E) in order to consider all the regions concerned by the withdrawal of the Inter-Tropical Conver-gence Zone during autumn. Then we computed lag correla-tion coefficients between the indexes. The results (Fig. 4a) agree well with our hypothesis: in model outputs, Sahelian rainfall in July–September is significantly and positively as-sociated to Guinean-Sudanese DSW monthly values during the preceding fall and winter. The statistical relationship is persistent and peaks in March.
Since this statistical persistence is well reproduced in the model outputs, the second step is to investigate the robust-ness of the results using completely independent data: ob-served rainfall and modelled DSW. Correlation coefficients have been computed between Guinean-Sudanese DSW and observed Sahelian rainfall (Fig. 4b). Although these values are globally weaker, their annual evolution is rather similar, except for June 0. We then focused on the spatial distribution of deep soil wetness before the wettest (69-70-71-74-75-78-88-89-94-95-98) and driest (68-72-73-77-79-82-83-84-87-90-97) Sahelian rainy seasons, thanks to a composite analysis (Fig. 5). The wet (dry) years refer to JAS rainfall anoma-lies greater than 0.5 std (lower than −0.5 std). The wettest seasons in Sahel (JAS 0) are characterised by positive
val-ues of DSW over the Guinean region during the previous fall (September/November −1): this signal is significant accord-ing to the Student t-test and agrees with the previous results. From January to March significant statistical signals appear over the 9 N–14 N/7 E–18 E region surrounding Lake Chad. These signals are due to the particularly weak soil moisture interannual variance recorded over the region during the dry season. The month of April (March in the model) marks a weakening of DSW values before a reversal towards nega-tive values in June 0. This is consistent with the neganega-tive correlation found between Guinean-Sudanese DSW and ob-served Sahelian rainfall in June in Fig. 4b. Similar results are obtained using the surface soil wetness (not shown).
Since NCEP/NCAR DSW data are model-dependent, we conducted similar investigations using soil moisture quanti-ties from the Global Soil Wetness Project. Indeed, GSWP provides land surface data sets of high quality and consis-tency on a 1◦×1◦regular and global grid (Drimeyer et al. 1999). Soil wetness data (units in cm) are available at 3 lay-ers. We selected the deepest one which represents a deep recharge zone extending from about a 40 to 100 cm depth. Water content values are in the range of 0–2 cm. Currently restricted to 1987 and 1988, these data are however of par-ticular interest for West Africa: as shown in Fig. 2, these two years were characterised in Guinea and Sahel by strong rainfall anomalies of opposite sign. Moreover, the anomalies in the two regions agree well with the positive correlation linking the two rainy seasons. The soil wetness differences between the two years (1988 minus 1987) are presented in Fig. 6. As a result of a better SON Guinean rainy season, soil wetness content during the 1988 winter was higher than in 1987 and the Sahelian rainy season was wetter during the 1988 summer (with respect to the year 1987). One noticed that the spatial patterns and time evolutions derived from the GSWP data set are quite similar to the composite maps shown in Fig. 5 which were issued from the NCEP/NCAR outputs. In particular, the sign of the Wet – Dry and of the 1988–1987 differences reverses by April.
4 Monsoon energetics
How could soil wetness favour Sahelian rainfall through monsoon energetics? To answer this question, we have to consider directly the atmospheric energy over the mon-soon region. We chose to focus on the moist static
en-578 N. Philippon and B. Fontaine: The relationship between the Sahelian and previous 2nd Guinean rainy seasons J A S O N D J F M A M J 0 0.1 0.2 0.3 0.4 0.5 0.6 0.7 month corr. coef year (−1) year (0) J A S O N D J F M A M J −0.2 −0.1 0 0.1 0.2 0.3 0.4 0.5 month corr. coef year (−1) year (0) (a) (b)
Fig. 4. Lag correlation coefficients over
the period of 1968–1998 between July– September rainfall in the Sahel and the previous monthly values (July −1 to June 0) of a deep soil wetness in-dex covering the area 5 N–12 N/15 W– 15 E, (a) rainfall index computed using NCEP/NCAR outputs; (b) rainfall in-dex computed using Hulme database.
ergy content because this variable accounts for the transfor-mation of enthalpy and latent energy available in the low troposphere into geopotential energy in the upper levels, a transformation which signs the convection (Polcher 1995). Moreover, at larger scale, MSE content drives the mon-soon circulation through the arrangement of horizontal gra-dients (Emanuel 1995) and partly explains Sahelian rainfall variability (Eltahir and Gong 1996, Fontaine and Philippon 2000). MSE content (for a unit-mass) over an isobaric level is written:
MSE = gZ + CpT + LQ,
where g, Cp and L are quasi-constants, and the computation of the MSE field from the NCEP/NCAR database requires only the selection of the geopotential height (Z), the tem-perature (T ), and the specific humidity (Q). As opposed to precipitation or soil wetness data, these fields belong to class A and B. We selected the monthly values of grid points cov-ering the 0 − 20◦N/17.5◦W−17.5◦E area. In order to better focus on the lowest levels of the boundary layer, all the fig-ures and results discussed hereafter refer to the first isobaric level available in atmospheric outputs (the 1000 hPa level).
Correlations between the MSE field over West Africa and the index of deep soil wetness previously used are shown in Fig. 7. In the NCEP/NCAR model, variations in spring soil wetness precede those in horizontal MSE gradients over the continent. The synchronous values (Fig. 7a) indicate that ab-normally wet soils in Sudan and Guinea in March, tend to reinforce MSE gradients in the Guinean region: indeed, the correlation coefficients are negative (positive) south (north) of 7◦N. The lag correlation coefficients (Fig. 7b) reveal that more energy is then recorded in summer over the Sahel, when the northward shift and the intensity of the monsoon are at maximum. This agrees with studies of Fontaine and Philip-pon (2000), Thorncroft and Haile (1995) and Taylor and Lebel (1998). The former have shown that the wettest Sa-helian rainy seasons are concordant with stronger MSE gra-dients over the continent in spring; the second and latter have noticed, at smaller time and spatial scales, an increase in the amount of energy just before wet spells, and a positive feed-back between the soil moisture patterns and deep convection, respectively.
5 Discussion
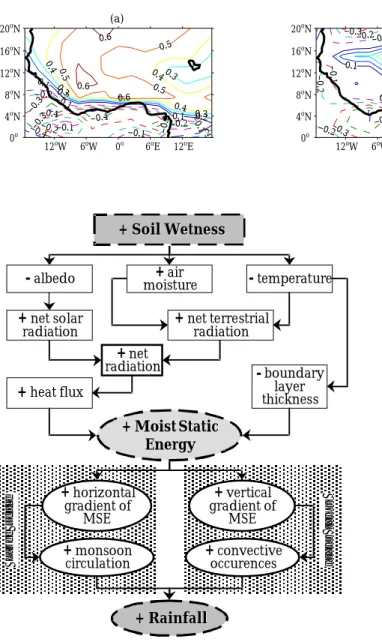
The above results show evidence of significant statistical relationships between autumn-winter soil wetness, spring MSE contents and summer rainfall. They can be interpreted through basic physical and thermodynamical mechanisms linking soil wetness to rainfall via MSE content in the bound-ary layer, following the scheme, first proposed by Emmanuel (1995), Eltahir and Gong (1996), Zheng and Eltahir (1998) and adapted in Fig. 8 in an elementary way: as a consequence of heavy SON rainfall, soils over Guinea are wetter than nor-mal throughout the entire dry season. In March, when the solar forcing starts to increase over West Africa, these soil wetness positive anomalies could decrease surface albedo, which reinforces locally the net solar radiation, but also in-creases air moisture and dein-creases air temperature near the surface. This diminishes the upward terrestrial radiation and the boundary layer thickness. As a result, the net surface radiation strengthens and therefore the surface-atmosphere heat flux. The MSE content driven by this heat flux can then increase in the lowest levels of the boundary layer, mainly over the wet Guinean region. This is sufficient to cause an in-tensification of the horizontal MSE gradients which normally takes place between the dry Sahara and the humid Guinean coast: the monsoon circulation is enhanced and is thus able to penetrate deeper into the continent. The development of convective systems is also directly enhanced since any local positive soil wetness anomalies strengthen the vertical MSE gradients (right bottom in Fig. 8) and thus the vertical insta-bility between the low and middle troposphere: in the West African monsoon region, where strong vertical and horizon-tal wind shears already exist, this is a very efficient condition for producing rain systems.
These positive feedbacks should be able to increase both the link between monsoon dynamics and land surface prop-erties at regional scale, and more locally, the water recycling in the atmospheric column when soil is close to saturation. Biophysical processes and vegetation dynamics which limit runoff and direct evaporation can also contribute to the shift in the maximum of the positive feedback within the dry sea-son (decrease in albedo, increase in surface roughness, air moisture and low level convergence). This could explain why a significant relationship can be observed between the SON-1 and JAS 0 rainfall.
July (−1) 16oW 8oW 0o 8oE 16oE 4oN 8oN 12oN 16oN August (−1) 16oW 8oW 0o 8oE 16oE 4oN 8oN 12oN 16oN September (−1) 16oW 8oW 0o 8oE 16oE 4oN 8oN 12oN 16oN October (−1) 16oW 8oW 0o 8oE 16oE 4oN 8oN 12oN 16oN November (−1) 16oW 8oW 0o 8oE 16oE 4oN 8oN 12oN 16oN December (−1) 16oW 8oW 0o 8oE 16oE 4oN 8oN 12oN 16oN January (0) 16oW 8oW 0o 8oE 16oE 4oN 8oN 12oN 16oN February (0) 16oW 8oW 0o 8oE 16oE 4oN 8oN 12oN 16oN March (0) 16oW 8oW 0o 8oE 16oE 4oN 8oN 12oN 16oN April (0) 16oW 8oW 0o 8oE 16oE 4oN 8oN 12oN 16oN May (0) 16oW 8oW 0o 8oE 16oE 4oN 8oN 12oN 16oN June (0) 16oW 8oW 0o 8oE 16oE 4oN 8oN 12oN 16oN
Fig. 5. Monthly composite maps of volumetric deep soil wetness with respect to wet minus dry years (JAS 0) in the Sahel, from July −1 (top
left corner), to June 0 (bottom right corner). Positive (negative) differences exceeding an absolute value of 0.125 ∗ 10−2are displayed in dark (light) shading, these values ranging from −0.021 to 0.031. The black squares define grid points where differences in means are significant at the 95% confidence level from a Student t-test. Data source: NCEP/NCAR.
6 Conclusion
The main objective of this study was to verify a basic hy-pothesis: the very particular intraseasonal and interannual rainfall variability observed recently in West Africa could be partly controlled by land-atmosphere feedback involv-ing soil moisture, MSE content, monsoon circulation and
convection. Several interesting points regarding the statisti-cal relationships between these variables and processes have been pointed out, starting from a statistical paradox: the interannual variability of the Sahelian summer (JAS) rain-fall is not significantly linked to the rainrain-fall amounts occur-ring the year before over that region (JAS −1) or even
else-580 N. Philippon and B. Fontaine: The relationship between the Sahelian and previous 2nd Guinean rainy seasons Jan. (88 minus 87) 16oW 8oW 0o 8oE 16oE 3oN 6oN 9oN 12oN 15oN 18oN Feb. (88 minus 87) 16oW 8oW 0o 8oE 16oE 3oN 6oN 9oN 12oN 15oN 18oN Mar. (88 minus 87) 16oW 8oW 0o 8oE 16oE 3oN 6oN 9oN 12oN 15oN 18oN Apr. (88 minus 87) 16oW 8oW 0o 8oE 16oE 3oN 6oN 9oN 12oN 15oN 18oN May. (88 minus 87) 16oW 8oW 0o 8oE 16oE 3oN 6oN 9oN 12oN 15oN 18oN Jun. (88 minus 87) 16oW 8oW 0o 8oE 16oE 3oN 6oN 9oN 12oN 15oN 18oN Jul. (88 minus 87) 16oW 8oW 0o 8oE 16oE 3oN 6oN 9oN 12oN 15oN 18oN Aug. (88 minus 87) 16oW 8oW 0o 8oE 16oE 3oN 6oN 9oN 12oN 15oN 18oN Sep. (88 minus 87) 16oW 8oW 0o 8oE 16oE 3oN 6oN 9oN 12oN 15oN 18oN Oct. (88 minus 87) 16oW 8oW 0o 8oE 16oE 3oN 6oN 9oN 12oN 15oN 18oN Nov. (88 minus 87) 16oW 8oW 0o 8oE 16oE 3oN 6oN 9oN 12oN 15oN 18oN Dec. (88 minus 87) 16oW 8oW 0o 8oE 16oE 3oN 6oN 9oN 12oN 15oN 18oN
Fig. 6. 1988 minus 1987 maps of monthly deep soil wetness. Positive (negative) differences exceeding an absolute value of 0.1 cm are
displayed in dark (light) shading, these values ranging from −0.59 to 0.38 cm. Data source: GSWP.
where during the preceding months (AMJ & MJ 0), but to the previous 2nd Guinean rainy season (SON −1). This as-sumes that the existence of a multi-month memory during the dry season is able to exert a significant forcing on mon-soon circulation, deep convection and rainfall. Such events have been viewed to be associated with soil wetness reser-voirs and subsequent changes in the evolution of the
hori-zontal MSE gradients near the surface just before (or at the very beginning of) the northward excursion of the rainbelt into the continent (March–April). Since these MSE anomaly fields in low levels are directly linked to monsoon circula-tion and rainfall, this result could be taken into account in the current predictive schemes to increase the Sahelian rain-fall forecast lead, which is currently ∼1–2 months
(Philip-(b) −0.4 −0.4 −0.4 −0.3 −0.3 −0.3 −0.2 −0.2 −0.2 −0.2 −0.2 −0.1 −0.1 −0.1 −0.1 −0.1 0.1 0.1 0.1 0.1 0.2 0.2 0.2 0.3 0.3 0.3 0.3 0.4 0.4 0.4 0.5 0.5 0.5 0.70.6 12oW 6oW 0o 6oE 12oE 0o 4oN 8oN 12oN 16oN 20oN (a) −0.4 −0.4 −0.4 −0.3 −0.3 −0.3 −0.2 −0.2 −0.2 −0.1 −0.1 −0.1 −0.1 0.1 0.1 .2 0.2 0.2 0.3 0.3 0.3 0.4 0.4 0.4 0.5 0.5 0.5 0.6 0.6 0.6 12oW 6oW 0o 6oE 12oE 0o 4oN 8oN 12oN 16oN 20oN
Fig. 7. Linear correlation coefficients
between March values of the DSW in-dex used in Fig. 4 and moist static en-ergy fields at 1000 hPa in March (a) and August (b) over the period of 1968– 1998. Data source: NCEP/NCAR.
La rg e sc al e Lo ca l sc al e +
+ Moist MoistStaticStatic Energy Energy + + vertical vertical gradient of gradient of MSE MSE + + horizontal horizontal gradient of gradient of MSE MSE + + monsoon monsoon circulation
circulation ++occurencesoccurences convective convective
+ Rainfall + Rainfall + +net solar radiation
--albedo moisture++ air --temperature
+ + net radiation + +net terrestrial radiation + Soil Wetness + Soil Wetness + +heat flux -- boundary layer thickness
Fig. 8. Schematic diagram of the basic soil moisture – rainfall
feed-back in the boundary layer (adapted from Emanuel (1995), Eltahir and Gong (1996), Zheng and Eltahir (1998), and our results).
pon and Fontaine 2000). In addition, these results corrobo-rate and complement, in particular, the works of Douville and Chauvin (2000) and in general of the whole GSWP commu-nity. The impending availability of updated version of the GSWP database on a full 10-year period will allow us to ad-dress the still unanswered questions: how to explain such an increase in the relationship between the 2nd Guinean and the Sahelian rainy seasons over the last 3 decades? Is it re-lated to a direct continental signal (i.e. significant changes in vegetative cover), or an indirect signal (i.e. changes in SST anomalies)? What is the specificity of the March–April period for soil wetness anomalies and monsoon energetics? These questions are currently being investigated at CRC. Acknowledgements. The authors thank the two anonymous
review-ers for their interesting comments and the CRU, the NCEP/NCAR
and GSWP for providing the data used. This study has been sup-ported by INSU-CNRS fundings for the PNEDC and PNRH French programs.
Topical Editor J.-P. Duvel thanks O. de Felice and B. N. Goswami for their help in evaluating this paper.
References
Charney, J. G.: Dynamics of desert and drought in the Sahel, Quart. J. Roy. Meteor. Soc., 101, 193–202, 1975.
Charney, J. G., Quirk, W. J., Chow, S. H., and Kornfield, D. J.: A comparative study of the effects of albedo change on drought in semi-arid regions, J. Atmos. Sci., 34, 1366–1385, 1977. Douville, H. and Chauvin, F.: Relevance of soil moisture for
sea-sonal climate predictions: a preliminary study, Climate Dyn., 16, 719–736, 2000.
Drimeyer, P. A., Dolman, A. J., and Sato, N.: The Global Soil Wet-ness Project: a pilot project for global land surface modeling and validation., Bull. Amer. Meteor. Soc., 80, 851–878, 1999. Eltahir, E. A. B. and Gong, C.: Dynamics of wet and dry years in
West Africa, J. Climate, 9, 1030–1042, 1996.
Emanuel, K. A.: On thermally direct circulations in moist atmo-spheres, J. Atmos. Sci., 52, 1529–1534, 1995.
Fontaine, B. and Philippon, N.: Seasonal evolution of bound-ary layer heat content in the West African monsoon from the NCEP/NCAR reanalysis (1968–1998), Int. J. Climatol., 20, 1777–1790, 2000.
Hulme, M. and Jones, P. D.: A historical monthly precipitation data set for global land areas: application for climate monitoring and climate model evaluation. Analysis Methods of Precipitation on a Global Scale, WMO, TD-No 558, A/14–A/17, 1993.
Kalnay, E., et al.: The NCEP-NCAR 40 year Reanalyses Project, Bull. Amer. Meteor. Soc., 77, 437–471, 1996.
Lamb, P. J.: Case studies of tropical Atlantic surface circulation patterns during recent sub-Saharan weather anomalies: 1967 and 1968, Mon. Wea. Rev., 106, 482–491, 1978a.
Lamb, P. J.: Large-scale tropical Atlantic surface circulation pat-terns associated with sub-saharan weather anomalies, Tellus, 30, 240–251, 1978b.
Palmer, T. N.: The influence of the Atlantic, Pacific and Indian Oceans on Sahel rainfall, Nature, 322, 251–253, 1986.
Philippon, N. and Fontaine, B.: A new statistical predictabil-ity scheme for July–September Sahel rainfall (1968–1994), Comptes Rendus de l’Acad´emie des Sciences, 329, 1–6, 1999. Philippon, N. and Fontaine, B.: West African June–September
rainfall: experimental statistical forecasts based on April val-ues of regional predictors, Exp. Long-lead Forecast Bull., 9, http://grads.iges.org/ellfb/Jun00/philipp.6.00.htm, 2000.
582 N. Philippon and B. Fontaine: The relationship between the Sahelian and previous 2nd Guinean rainy seasons
Poccard, I., Janicot, S., and Camberlin, P.: Comparison of rainfall structures between NCEP/NCAR reanalyses and observed data over tropical Africa, Climate Dyn., 16, 897–915, 2000. Polcher, J.: Sensivity of tropical convection to land surface
pro-cesses, J. Atmos. Sci., 52, 3143–3161, 1995.
Taylor, C. M. and Lebel, T.: Observational evidence of persistent convective-scale rainfall patterns, Mon. Wea. Rev., 126, 1597– 1607, 1998.
Thorncroft, C. D. and Haile, M.: The mean dynamic and thermo-dynamic fields for July 1989 over tropical North Africa and their
relationship to convective strom activity, Mon. Wea. Rev., 123, 3016–3031, 1995.
Walker, J. and Rowntree, P. R.: Effects of soil moisture and rain-fall in a tropical model, Quart. J. Roy. Meteor. Soc., 103, 29–46, 1977.
Wolter, K.: Modes of tropical circulation, Southern Oscillation, and Sahel rainfall anomalies, J. Climate, 2, 149–172, 1989.
Zheng, X. and Eltahir, E. A. B.: The role of vegetation in the dy-namics of West African monsoons, J. Climate, 11, 2078–2096, 1998.