HAL Id: hal-01067155
https://hal.archives-ouvertes.fr/hal-01067155
Submitted on 4 Aug 2020
HAL is a multi-disciplinary open access
archive for the deposit and dissemination of
sci-entific research documents, whether they are
pub-lished or not. The documents may come from
teaching and research institutions in France or
abroad, or from public or private research centers.
L’archive ouverte pluridisciplinaire HAL, est
destinée au dépôt et à la diffusion de documents
scientifiques de niveau recherche, publiés ou non,
émanant des établissements d’enseignement et de
recherche français ou étrangers, des laboratoires
publics ou privés.
Distributed under a Creative Commons Attribution| 4.0 International License
Sulfur dioxide emissions from Papandayan and Bromo,
two Indonesian volcanoes
Philipson Bani, M. Surono, M. Hendrasto, H. Gunawan, S. Primulyana
To cite this version:
Philipson Bani, M. Surono, M. Hendrasto, H. Gunawan, S. Primulyana. Sulfur dioxide emissions from
Papandayan and Bromo, two Indonesian volcanoes. Natural Hazards and Earth System Sciences,
Eu-ropean Geosciences Union, 2013, 13 (10), pp.2399-2407. �10.5194/nhess-13-2399-2013�. �hal-01067155�
Nat. Hazards Earth Syst. Sci., 13, 2399–2407, 2013 www.nat-hazards-earth-syst-sci.net/13/2399/2013/ doi:10.5194/nhess-13-2399-2013
© Author(s) 2013. CC Attribution 3.0 License.
Natural Hazards
and Earth System
Sciences
Open Access
Sulfur dioxide emissions from Papandayan and Bromo, two
Indonesian volcanoes
P. Bani1,2,3,4, Surono4, M. Hendrasto4, H. Gunawan4, and S. Primulyana4
1Clermont Université, Université Blaise Pascal, Observatoire de Physique du Globe de Clermont-Ferrand (OPGC),
Laboratoire Magmas et Volcans, BP 10448, 63000 Clermont-Ferrand, France
2LMV, CNRS, UMR6524, 63038 Clermont-Ferrand, France 3LMV, IRD, R 163, 63038 Clermont-Ferrand, France
4Center for Volcanology and Geological Hazard Mitigation, Jl Diponegoro No. 57, Bandung, Indonesia
Correspondence to: P. Bani (philipson.bani@ird.fr)
Received: 6 April 2013 – Published in Nat. Hazards Earth Syst. Sci. Discuss.: 14 May 2013 Revised: 14 August 2013 – Accepted: 1 September 2013 – Published: 2 October 2013
Abstract. Indonesia hosts 79 active volcanoes,
represent-ing 14 % of all active volcanoes worldwide. However, little is known about their SO2contribution into the atmosphere,
due to isolation and access difficulties. Existing SO2
emis-sion budgets for the Indonesian archipelago are based on ex-trapolations and inferences as there is a considerable lack of field assessments of degassing. Here, we present the first SO2
flux measurements using differential optical absorption spec-troscopy (DOAS) for Papandayan and Bromo, two of the most active volcanoes in Indonesia. Results indicate mean SO2emission rates of 1.4 t d−1 from the fumarolic activity
of Papandayan and more than 22–32 t d−1 of SO2 released
by Bromo during a declining eruptive phase. These DOAS results are very encouraging and pave the way for a better evaluation of Indonesian volcanic emissions.
1 Introduction
Volcanic degassing into the atmosphere constitutes one of the external expressions of subsurface magmatic and hydrother-mal manifestations. Reciprocally, any changes in the chemi-cal and physichemi-cal properties of the plume are generally symp-tomatic of modifications in the magmatic reservoir and/or conduits. Among the volcanic volatile components released into the atmosphere, sulfur dioxide (SO2)enhances
consid-erable research interest due to its non-negligible roles in the atmospheric chemistry, atmospheric radiation, hydrological cycle and climate, as well as acidic precipitation and air
quality (Charlson et al., 1992; Jones et al., 2001; Penner et al., 2001; Stevenson et al., 2003). It is a relatively abundant species in the volcanic plume, typically in third place behind H2O and CO2with around 5 mol% of gas content along with
H2S (Shinohara, 2008). SO2has a very low background level
in the atmosphere and strong identifiable optical absorption features in the ultraviolet (UV) skylight region that offer var-ious options for spectroscopic detection in the atmosphere (McGonigle et al., 2003). SO2 is thus a readily measurable
species, widely recognized as an important and highly de-sirable component of multidisciplinary volcano monitoring. Many observatories routinely measure SO2emission rates in
support of their monitoring networks. The global SO2
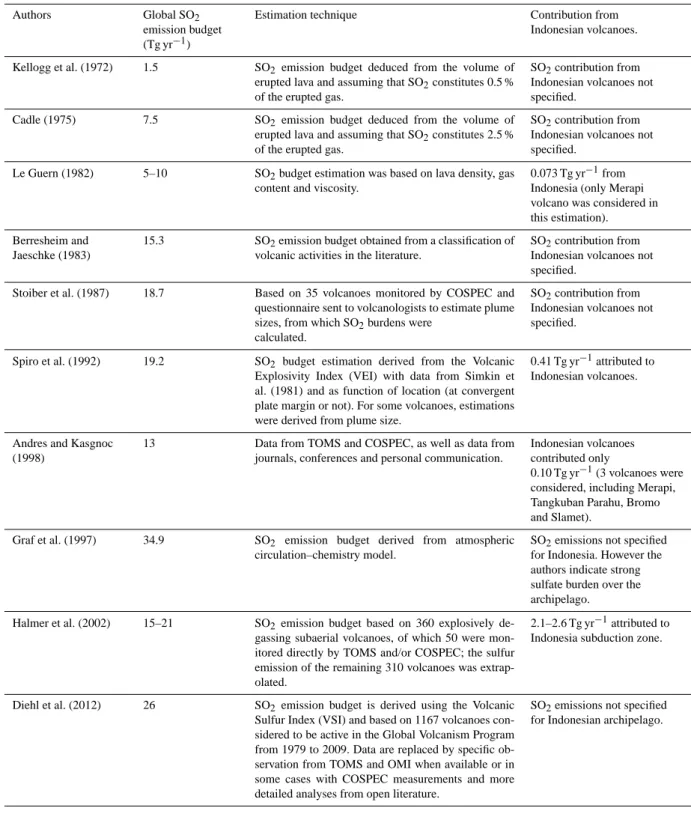
emis-sion budget estimates over the last four decades range from 1.5 to 40 Tg yr−1(Table 1) – a very large range due to the di-versity of methodology used, the extending number of stud-ied volcanoes and the increasing development of measure-ment techniques.
According to the IPCC report (2001), the global volcanic SO2emission budget is highly uncertain, because only very
few of the potential sources have been measured and the vari-ability between sources and between different stages of activ-ity is considerable. Over the last ten years, the increasing de-velopment in the field of remote sensing has improved our knowledge on the distribution of volcanic volatile sources across the earth and even on the remote and less accessible edifices (McGonigle et al., 2004; Mather et al., 2006; Bani et al., 2012; McCormick et al., 2012). But still many volcanoes on earth have never had their degassing rates evaluated. This
2400 P. Bani et al.: Sulfur dioxide emissions from Papandayan and Bromo
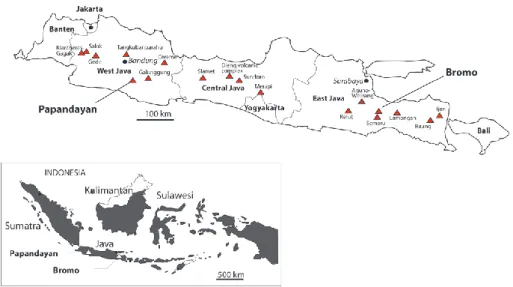
Fig. 1. Java island with its 18 active volcanoes. The target volcanoes, Papandayan and Bromo, are indicated. The location of Java and the
studied volcanoes within the Indonesian archipelago is provided below.
is the case in Indonesia where, despite the high number of ac-tive volcanoes, the past SO2emission estimates were based
on extrapolation and inference (Nho et al., 1996; Halmer et al., 2002; Hilton et al., 2002), whilst SO2flux measurements
were carried out only on 4 volcanoes (Table 1). This present work aims to point out this misrepresentation and further highlight a possibility to constrain the SO2 emission better
from Indonesian volcanoes using differential optical absorp-tion spectroscopy (DOAS).
We present SO2flux measurements, obtained in June 2011
from two volcanoes in Indonesia – including Papandayan and Bromo (Fig. 1), two volcanoes among the most active in In-donesia, and they represent two end-members of volcanic de-gassing types: a fumarolic emission on Papandayan and an open vent degassing from Bromo
2 Papandayan and Bromo volcanoes
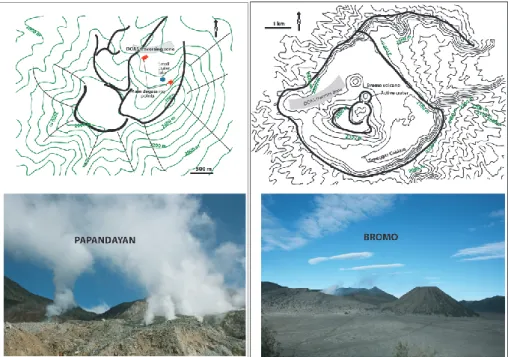
Papandayan is a complex stratovolcano culminating 2665 m above sea level with a base diameter of ∼ 8 km (Fig. 2) lo-cated 45 km south–southeast of Bandung city, West Java. The edifice became well known after its 1772 eruption that caused the collapse of the northeast flank, leading to a devastating debris avalanche over 250 square kilometers that destroyed about 40 villages and killed nearly 3000 people (Abidin et al., 2006). Papandayan ranks 11th out of the 13 deadliest eruptions on earth (Blong, 1984). Other eruptions have been reported for this volcano in 1882, 1923–1927, 1942, 1993 and 2002 (Abidin et al., 2006). The latest eruption in 2002 is well detailed in Abidin et al. (2006) – about 6000 peo-ple were evacuated. Magmatic degassing on Papandayan oc-curs mainly in two fumarolic zones, aligned in a northwest– southeasterly direction and located in a deformed, horseshoe-shaped eastern crater (Fig. 2) (Mazot et al., 2007, 2008).
Bromo is located 75 km south of Surabaya, East Java. It occupies the central part of the Tengger caldera – a well-defined and a roughly square structure around 7 km wide (Fig. 2). The caldera rim culminates at more than 2600 m above sea level, and the inner caldera floor is around 2100 m a.s.l. More than 60 explosive eruptions (mainly with VEI = 2) have been reported to have occurred on Bromo over the past four centuries (source: GVP). However, in contrast to Papandayan, no causalities were reported ex-cept for the two tourists killed during the 2004 eruption after venturing too close to the volcano. The present-day active crater, through which magmatic degassing occurs, is Bromo’s smallest (500 m in diameter) and northernmost crater (Fig. 2) (Andres and Kasgnoc, 1998; Nho et al., 1996; GVP Bromo – 03/1995 (BGVN 20:03); GVP Bromo – 05/2004 (BGVN 29:05)).
3 Methods
SO2fluxes were measured using a USB2000 ultraviolet
spec-trometer, and SO2 column amounts were retrieved by
fol-lowing standard DOAS calibration and analysis procedures (Kraus, 2006; Platt and Stutz, 2008). The spectral range of the spectrometer is 280–400 nm with a spectral resolution of 0.5 nm FWHM (full width at half maximum). Light en-tered the spectrometer through a telescope (8 mrad FOV) and via a fiber optic bundle. The Vispec program (http:// vispect.sourceforge.net/) was used to field-track the volcanic plume. Total integration times of 3 s (exposure time 300 ms, 10 added spectra) and 1.6 s (exposure time 200 ms, 8 co-added spectra) were applied to Papandayan and Bromo re-spectively. Reference spectra included in the non-linear fit were obtained by convolving high-resolution SO2(Bogumil
et al., 2003) and O3(Voigt et al., 2001) cross sections with
P. Bani et al.: Sulfur dioxide emissions from Papandayan and Bromo 2401
Table 1. SO2flux contributions from Indonesian volcanoes in the global volcanic emission budgets.
Authors Global SO2
emission budget (Tg yr−1)
Estimation technique Contribution from Indonesian volcanoes.
Kellogg et al. (1972) 1.5 SO2 emission budget deduced from the volume of
erupted lava and assuming that SO2constitutes 0.5 %
of the erupted gas.
SO2contribution from
Indonesian volcanoes not specified.
Cadle (1975) 7.5 SO2 emission budget deduced from the volume of
erupted lava and assuming that SO2constitutes 2.5 %
of the erupted gas.
SO2contribution from
Indonesian volcanoes not specified.
Le Guern (1982) 5–10 SO2budget estimation was based on lava density, gas
content and viscosity.
0.073 Tg yr−1from Indonesia (only Merapi volcano was considered in this estimation). Berresheim and
Jaeschke (1983)
15.3 SO2emission budget obtained from a classification of
volcanic activities in the literature.
SO2contribution from
Indonesian volcanoes not specified.
Stoiber et al. (1987) 18.7 Based on 35 volcanoes monitored by COSPEC and questionnaire sent to volcanologists to estimate plume sizes, from which SO2burdens were
calculated.
SO2contribution from
Indonesian volcanoes not specified.
Spiro et al. (1992) 19.2 SO2 budget estimation derived from the Volcanic
Explosivity Index (VEI) with data from Simkin et al. (1981) and as function of location (at convergent plate margin or not). For some volcanoes, estimations were derived from plume size.
0.41 Tg yr−1attributed to Indonesian volcanoes.
Andres and Kasgnoc (1998)
13 Data from TOMS and COSPEC, as well as data from journals, conferences and personal communication.
Indonesian volcanoes contributed only
0.10 Tg yr−1(3 volcanoes were considered, including Merapi, Tangkuban Parahu, Bromo and Slamet).
Graf et al. (1997) 34.9 SO2 emission budget derived from atmospheric
circulation–chemistry model.
SO2emissions not specified
for Indonesia. However the authors indicate strong sulfate burden over the archipelago.
Halmer et al. (2002) 15–21 SO2emission budget based on 360 explosively
de-gassing subaerial volcanoes, of which 50 were mon-itored directly by TOMS and/or COSPEC; the sulfur emission of the remaining 310 volcanoes was extrap-olated.
2.1–2.6 Tg yr−1attributed to Indonesia subduction zone.
Diehl et al. (2012) 26 SO2 emission budget is derived using the Volcanic
Sulfur Index (VSI) and based on 1167 volcanoes con-sidered to be active in the Global Volcanism Program from 1979 to 2009. Data are replaced by specific ob-servation from TOMS and OMI when available or in some cases with COSPEC measurements and more detailed analyses from open literature.
SO2emissions not specified
for Indonesian archipelago.
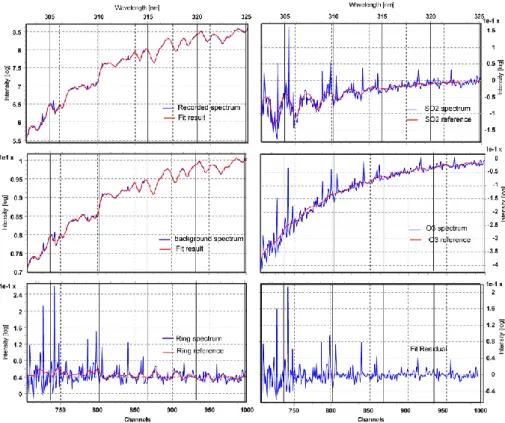
the instrument line shape. A Fraunhofer reference spectrum and ring spectrum, calculated in DOASIS, were also included in the fit. The optimum fitting windows of 302–325 nm and 300–320 nm for Papandayan and Bromo respectively were evaluated by obtaining a near random fit residual with min-imum deviation. Figures 3 and 5 show examples of the SO2
fit. Each spectrum position was determined from a continu-ously recording GPS unit. Wind speeds were obtained us-ing a handheld anemometer at high points, to the east of the Tengger caldera rim for Bromo and about 200 m above the northern fumarole zone on Papandayan. On this latter volcano, DOAS SO2 flux measurements were performed in
2402 P. Bani et al.: Sulfur dioxide emissions from Papandayan and Bromo
Fig. 2. Maps of the Papandayan summit and the Bromo caldera. The DOAS traverse zones are shaded in gray. The main degassing points
are shown: fumarole zones on Papandayan and the active crater on Bromo. Pictures provide a synoptic view of degassing during the field measurements.
walking-traverse mode (McGonigle et al., 2002). The spec-trometer was carried with the telescope pointing to the zenith while walking across the northern part of the eastern crater (Fig. 2). The plume was drifting to the northwest at the time of measurement. A complementary USB4000 spectrometer was positioned on a fixed mode, operating within the 292– 446 nm spectral range and with 0.3 FWHM spectral reso-lution. SO2 column amounts were retrieved using the same
procedures as for the USB2000. On Bromo, access into the caldera was possible using a 4WD vehicle, so DOAS tra-verses were done on a vehicle (Fig. 2). During measurement, the wind was from the east, forcing the plume partially above the inaccessible relief zone to the west (Fig. 2). To ensure measurements across the entire plume, the telescope was po-sitioned with an inclination of around 30◦from the zenith.
3.1 Errors in the SO2flux measurements
Error in the SO2flux measurements is derived from four
dif-ferent factors, including the retrieved column amount, the distance perpendicular to the plume transport direction, the angle between the assumed wind direction and the traverse path and the plume transport speed (Mather et al., 2006). Er-ror in the retrieved SO2 column amount depends on many
factors (Stutz and Platt, 1996; Hausmann et al., 1999; Kern et al., 2010), but we assume that the dominant error is induced by variable cloudiness that we compensate using artificial constant dark, calculated from each recorded spectrum, in the range of blind pixel (pixel below 290 nm) (Tsanev, 2008). Such corrections account for dark spectrum, offset and stray
light. We estimate that the error in the column amount con-tributes 0.006–0.014 to the squared variation coefficient of the total flux, whilst error contributions from the distance traversed perpendicular to the plume and from the assumed wind direction following the approached detailed in Mather et al. (2006) are 0.001–0.006 and ∼ 0.003 respectively. Note however that all these errors are negligible in comparison to uncertainties in the plume speed (e.g., Stoiber et al., 1983). We assumed that the plume transport speed is conservative throughout our measurements period with a relative error of ∼30–35 %, consistent with Stoiber et al. (1983).
4 Results and discussion
The DOAS measurements obtained in this work are summa-rized in Table 2, while Figs. 4 and 5 display plots of all tra-verses and static measurements. Non-linear fits of recorded spectra under Bromo and Papandayan highlight strong SO2
signals in the plume (Figs. 3 and 5) with maximum concen-trations largely exceeding 100 ppm.m above the background level. It is therefore evident at this stage that Papandayan and Bromo release SO2into the atmosphere.
4.1 Papandayan’s SO2emission rate
Results indicate that SO2emission rate on Papandayan
fluc-tuates between 0.4±0.1 and 2.8±0.8 t d−1with a mean value of 1.4 ± 0.5 t d−1. This fluctuation is consistent with DOAS static measurements (Fig. 4) where the SO2column amount
P. Bani et al.: Sulfur dioxide emissions from Papandayan and Bromo 2403
Fig. 3. Example of DOAS SO2fit on Papandayan. Blue lines are recorded spectra. The background spectra were acquired by pointing outside
the plume.
Table 2. Estimated SO2emission rates for Papandayan and Bromo.
Start time (UT) Mean measurement Average column
State of activity Date of local time = distance from Plume amount SO2flux
Volcano during measurements measurements Traverse UT + 7 sources (km) width (km) (mg m−2) (t d−1) Papandayan Degassing through fumaroles 18/06/11 Trav_1 06:47:04 0.6 0.14 37 0.4 ± 0.1 Trav_2 06:51:03 0.5 0.11 110 1.2 ± 0.4
Trav_3 06:56:45 0.6 0.11 110 1.2 ± 0.4 Trav_4 06:59:51 0.5 0.10 114 1.2 ± 0.4 Trav_5 07:04:35 0.5 0.12 200 2.8 ± 0.8 Trav_6 07:08:11 0.5 0.11 209 2.2 ± 0.7
Mean SO2emission rate = 1.4 ± 0.5 t d−1
Bromo Open vent degassing 23/06/11 Trav_1 03:11:58 2.3 0.30 49 2.4 ± 0.8
Trav_2 03:20:48 2.3 0.75 120 32.1 ± 11.2
Trav_3 03:32:50 2.3 0.14 54 0.7 ± 0.2
Trav_4 03:37:20 2.3 0.68 79 22.0 ± 7.7
Trav_5 03:49:23 2.3 0.16 30 0.7 ± 0.2
Mean SO2emission rate = 27.1 ± 9.5 t d−1 The mean emission rate is deduced from traverses 2 and 4 (in bold), whose profiles are closer to the real degassing of Bromo. Traverses 1, 3 and 5 account for a small portion of the plume (see text for further detail).
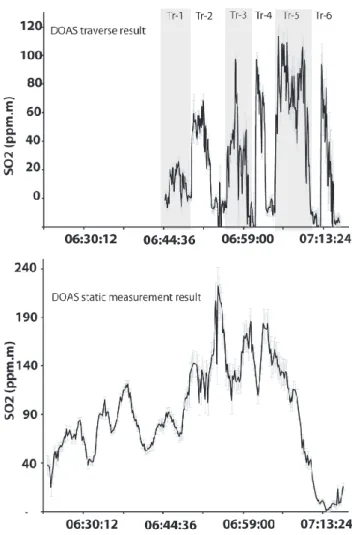
increased progressively from ∼ 40 ppm.m to ∼ 140 ppm.m over a period of 30 min before dropping to the background level in the following 15 min. The SO2 flux increased
ac-cordingly in traverses 1 to 5 and then decreased in tra-verse 6. Further measurements are required to delimit Pa-pandayan emissions better. However, it is likely that changes in Papandayan’s SO2 emission rate come from subsurface
magmatic–hydrothermal processes with regular magmatic
gas discharges pumping up to 0.03 kg SO2s−1 into the
at-mosphere. In any case, Papandayan’s SO2 contribution to
the atmosphere is relatively small compared to other vol-canic sources (Andres and Kasgnoc, 1998). Assuming that the DOAS results are representative, this volcano releases only about 500 tons of sulfur dioxide into the atmosphere an-nually. This low SO2release into the atmosphere is expected
2404 P. Bani et al.: Sulfur dioxide emissions from Papandayan and Bromo
Fig. 4. Plots of traverse (above) and static (below) measurement
results obtained on Papandayan. Time axes were aligned highlight-ing the increase of SO2column amounts in both static and traverse
measurements.
compilation of Papandayan gas chemistry, and mean SO2
concentration (0.11 mol%) is significantly lower than H2S
concentration (0.51 mol%). Assuming that these concentra-tions are representative, and using the H2S / SO2 molar
ra-tio of 4.6, the H2S emission rate from Papandayan can
be estimated at around 3.4 t d−1, more than twice the SO2
emission rate. According to experimental studies and ther-mochemical modeling of volatile partitioning between va-por and liquid in two-phase hydrothermal systems, CO2 is
the most abundant hydrothermal gas followed by H2S –
other sulfurous gases are negligible (Symonds et al., 2001; Drummond and Ohmoto, 1985; Giggenbach, 1980; Reed and Spycher, 1984, 1985; Spycher and Reed, 1989). The strong availability of H2S suggests the existence of active
hydrothermal processes beneath Papandayan’s fumarolic ac-tivity, and that a portion of the SO2released from the
mag-matic source probably sinks out by hydrolysis (4SO2+ 4H2O
= H2S + 3H2SO4 and 3SO2+ 2H2O = S + 2H2SO4)
(Hol-land, 1965) or is trapped by other hydrothermal processes.
Fig. 5. Example of DOAS SO2fit on Bromo (left). Measurement
spectra are blue. Traverse measurement profiles are shown (right). Traverses 1, 3 and 5 did not catch the bulk concentration while tra-verses 2 and 4 commenced in the plume (see text).
Consequently, when considering SO2flux measurements for
monitoring purposes, the existence of hydrothermal pro-cesses should be taken into account. Alternatively, H2S may
be a good candidate for monitoring as suggested by Symonds et al. (2001) and Aiuppa et al. (2005). In any case, the DOAS measurement results highlight the potential of SO2
monitor-ing of this fumarolically active volcano, and the 1.4 t d−1of SO2released into the atmosphere can henceforth be used as
a baseline for future SO2flux measurements. 4.2 Bromo’s SO2emission rate
The SO2 flux measurements from Bromo vary roughly
be-tween 0.7 ± 0.2 t d−1and 32 ± 11.2 t d−1, but unlike the Pa-pandayan survey, there were no static measurements to sup-port this investigation. Furthermore, despite the strong signal obtained in the SO2fit procedure (Fig. 5), all the traverses
were not completed (Fig. 5), and SO2fluxes for traverses 1, 3
and 5 were dramatically reduced in comparison to traverses 2 and 4. The reason for this disparity was the inclination of the
P. Bani et al.: Sulfur dioxide emissions from Papandayan and Bromo 2405
Fig. 6. Bromo degassing observed during two different periods. In
June 2011 (left), during measurement, the degassing was clearly visible 2 km from the volcano. In May 2012, there was no plume on Bromo and no SO2detected by DOAS. Only a stagnate white vapor was observed in the active crater (right).
telescope since part of the plume dispersed above the west-ern relief (Fig. 2). Traverses 2 and 4 commenced below the plume, but the relief configuration precluded a complete pro-file across the plume, while traverses 1, 3 and 5 began away from the plume, and the telescope inclination was not suffi-cient to catch the bulk plume concentration when the vehi-cle reached the relief. The outcome of these DOAS SO2flux
measurements may not be representative of the volcano’s ac-tivity at the time of the survey. However, in the configuration described above, the measurements from traverses 2 and 4 are much closer to reality, suggesting an SO2flux of more
than 22–32 t d−1. In the past, the SO2emission rate of this
volcano was estimated during two eruptive periods: on 8– 27 March 1995 (6, 22 and 22 t d−1)(GVP, 03/1995 – BGVN 20:03) and on 14 June 2004 (200 t d−1)(GVP, 05/2004 – BGVN 29:05). The SO2fluxes published in Andres and
Kag-noc’s (1998) well-known paper were derived from the March 1995 COSPEC measurements as no DOAS results exist prior to this work. Our DOAS measurements were carried out in June 2011 after a strong eruptive phase that commenced in November 2010 and persisted until April 2012. Thus, our results likely reflect the continuous decline of the eruptive phase. In May 2012, a second DOAS survey was organized on Bromo, but, surprisingly, the results showed no SO2
emis-sion from the active crater (Fig. 6). Bromo is therefore not a persistent source of SO2 in the atmosphere, as widely
thought. However, this volcano has a high frequency of erup-tive activity – about one eruption every 6–7 yr since 1804 (http://www.volcano.si.edu/index.cfm), which indicates that it is nevertheless a major contributor of SO2 to the
atmo-sphere. Regular measurements over a period of 6–7 yr are necessary to determine the SO2 emission rate of this
vol-cano better. In any case, this work highlights the potential for DOAS traverses on Bromo and encourages systematic DOAS deployment for monitoring and degassing studies given the short periodicity of eruptive events.
5 Conclusions
We present the first DOAS SO2 flux estimates for
Papan-dayan and Bromo, two of the most active volcanoes in Indonesia. Results indicate mean SO2 emission rates of
1.4 t d−1 from Papandayan’s fumarolic activity and more than 22–32 t d−1 of SO2 released by Bromo during a
de-clining eruptive phase. Results further indicate that Papan-dayan’s SO2release is sustained by the regular discharge of
gas, although much of the SO2 is likely trapped by
subsur-face hydrothermal processes, leading to significant release of H2S into the atmosphere. Bromo’s SO2releases appear not
to be persistent over time. This volcano is nevertheless a ma-jor source of volcanic degassing into the atmosphere given its 6–7 yr cycle of periodic eruptive activity. In contrast, the permanent degassing on Papandayan represents a negligible contribution of SO2to the atmosphere outside eruptive
pe-riods. Finally, the DOAS measurements obtained on Papan-dayan and Bromo are very encouraging given the numerous volcanoes in Indonesia whose degassing has never been eval-uated. In addition, this work establishes benchmarks for SO2
flux monitoring on both Bromo and Papandayan.
Acknowledgements. We acknowledge technical assistance from
Bromo and Papandayan observatories. Field work was supported by IRD and CVGHM. We appreciate support from IFI.
Edited by: A. Costa
Reviewed by: P. Allard and two anonymous referees
The publication of this article is financed by CNRS-INSU.
References
Abidin, H. Z., Andreas, H., Suganda, O. K., Meilano, I., Hen-drasto, M., Kusuma, M. A., Darmawan, D., Purbawinata, M. A., Wirakusumah, A. D., and Kimata, F.: Ground deforma-tion of Papandayan volcano before, during, and after the 2002 eruption as detected by GPS surveys, B. Volcanol., 10, 75–84, doi:10.1007/s10291-005-0009-1, 2006.
Aiuppa, A., Inguaggiato, S., McGonigle, A. J. S., O’Dwyer, M., Op-penheimer, C., Padgett, M. J., Rouwet, D., and Valenza, M.: H2S fluxes from Mt. Etna, Stromboli, and Vulcano (italy) an implica-tions for the sulfur budget at volcanoes, Geochim. Cosmochim. Ac., 69, 1861–1871, 2005.
Andres, R. J. and Kasgnoc, A. D.: A time-average inventory of sub-aerial volcanic sulfur emissions, J. Geophys. Res., 103, 25251– 25261, 1998.
Bani, P., Oppenheimer, C., Allard, P., Shinohara, H., Tsanev, V., Carn, S., Lardy, M., and Garaebiti, E.: First estimate of volcanic
2406 P. Bani et al.: Sulfur dioxide emissions from Papandayan and Bromo
SO2 budget for Vanuatu island arc, J. Volcanol. Geoth. Res., 211–212, 36–46, 2012.
Berresheim, H. and Jaeschke, W.: The contribution of volcanoes to the global atmospheric budget, J. Geophys. Res., 88, 3732–3740, 1983.
Blong, J. R.: Volcanic hazards: a sourcebook on the effects of erup-tions. Academic Press, University of California, 424 pp., 1984. Bogumil, K., Orphal, J., Homann, T., Voigt, S., Spietz, P.,
Fleis-chmann, O. C., Vogel, A., Hartmann, M., Kromminga, H., Bovensmann, H., Frerick, J., and Burrows, J. P.: Measurements of molecular absorption spectra with the SCIAMACHY preflight model: instrument characterization and reference data for atmo-spheric remotesensing in the 230–2380 nm region, J. Photoch. Photobio. A, 157, 167–184, 2003.
Cadle, R. D.: Volcanic emissions of halides and sulfur compounds to troposphere and stratosphere, J. Geophys. Res., 88, 1650– 1652, 1975.
Charlson, R. J., Schwartz, S. E., Hales, J. K., Cess, R. D., Coak-ley, J. A., Hasen, J. E., and Hoffman, D. J.: Climate forcing by anthropogenic aerosols, Science, 255, 422–430, 1992.
Diehl, T., Heil, A., Chin, M., Pan, X., Streets, D., Schultz, M., and Kinne, S.: Anthropogenic, biomass burning, and volcanic emissions of black carbon, organic carbon, and SO2from 1980
to 2010 for hindcast model experiments, Atmos. Chem. Phys. Discuss., 12, 24895–24954, doi:10.5194/acpd-12-24895-2012, 2012.
Drummond, S. E. and Ohmoto, H.: Chemical evolution and min-eral deposition in boiling hydrothermal systems, Econ. Geol., 80, 126–147, 1985.
Giggenbach, W. F.:. Geothermal gas equilibria, Geochim. Cos-mochim. Ac., 44, 2021–2032, 1980.
Graf, H.-F., Feichter, J., and Langmann, B.: Volcanic sulfur emis-sions: estimates of source strength and its contribution to the global sulfate distribution, J. Geophys. Res., 102, 10727–10738, 1997.
Halmer, M. M., Schmincke, H.-F., and Graf, H.-F.: The annual vol-canic gas input into the atmosphere, in particular into the strato-sphere: a global data set for the past 100 years, J. Volcanol. Geoth. Res., 115, 511–528, 2002.
Hausmann, M., Brandenburger, U., Brauers, T., and Dorn, H.-P.: Simple Monte Carlo methods to estimate the spectra evaluation error in differential-optical-absorption spectroscopy, Appl. Op-tics, 36, 463–475, 1999.
Hilton, D. R., Fischer, T. P., and Marty, B.: Noble Gases and Volatile Recycling at Subduction Zones, Rev. Mineral. Geochem., 47, 319–370, doi:10.2138/rmg.2002.47.9, 2002.
Holland, H. D.: Some applications of thermochemical data to prob-lems of ore deposits II. Mineral assemblages and the composition of ore-forming fluids, Econ. Geol., 60, 1101–1166, 1965. IPCC: Intergovernmental Panel on Climate Change Working group
(IPCC Report), Climate change 2001: The Scientific Basis, Con-tribution of Working Group I to the Third Assessment Report of the Intergovernmental Panel on Climate Change, edited by: Houghton, J. T., Ding, Y., Griggs, D. J., Noguer, M., Van der Liden, P. J., and Xiaosu, D., 2001.
Jones, A., Robert, D. L., Woodage, M. J., and Johnson, C. E.: Indi-rect sulphate aerosol forcing in a climate model with an interac-tive sulphur cycle, J. Geophys. Res., 106, 20293–20310, 2001.
Kellogg, W. W., Cadle, R. D., Allen, E. R., Lazrus, A. L., and Martell, E. A.: The sulfur cycle, Science, 175, 587–596, 1972. Kern, C., Deutschmann, T., Vogel, L., Wohrbach, M., Wagner, T.,
and Platt, U.: Radiative transfer corrections for accurate spec-troscopic measurements of volcanic gas emissions, B. Volcanol., 72, 233–247, doi:10.1007/s00445-009-0313-7, 2010.
Kraus, S.: DOASIS – A framework design for DOAS, Shaker Ver-lag, Aachen, 184 pp., 2006.
LeGuern, F.: Les débits de CO2 et de SO2 volcaniques dans
l’atmosphère, B. Volcanol., 45, 197–202, 1982.
Mather, T. A., Pyle, D. M., Tsanev, V. I., McGonigle, A. J. S., Op-penheimer, C., and Allen, A. G.: A reassessment of current vol-canic emissions from the Central American arc with specific ex-amples from Nicaragua, J. Volcanol. Geoth. Res., 149, 297–311, 2006.
Mazot, A., Bernard, A., and Supriatman, I. S.: Hydrothermal system of the Papandayan Volcano, West Java, Indonesia and its geo-chemistry evolution of thermal water after the November 2002 eruption, Jurnal Geologi Indonesia, 2, 15–29, 2007.
Mazot, A., Bernard, A., Fischer, T., Inguaggiato, S., and Sutawid-jaja, I. S.: Chemical evolution of thermal waters and changes in the hydrothermal system of Papandayan volcano (West Java, In-donesia) after the November 2002 eruption, J. Volcanol. Geoth. Res., 178, 276–286, 2008.
McCormick, B. T., Edmonds, M., Mather, T. A., and Carn, S. A.: First synoptic analysis of volcanic degassing in Papua New Guinea, Geochem. Geophys. Geosyst., 13, Q03008, doi:10.1029/2011GC003945, 2012.
McGonigle, A. J. S., Oppenheimer, C., Galle, B., Mather, T. A., and Pyle, D. M.: Walking traverse and scanning DOAS measure-ments of volcanique gas emission rates, Geophys. Res. Lett., 29, 1985, doi.10.1029/2002GL015827, 2002.
McGonigle, A. J. S., Oppenheimer, C., Hayes, A. R., Galle, B., Edmonds, M., Caltabiano, T., Salerno, G., Burton, M., and Mather, T. A.: Sulphur dioxide fluxes from Mount Etna, Vulcano, and Stromboli measured with automated scan-ning ultraviolet spectrometer, J. Geophys. Res., 108, 2455, doi:10.1029/2002JB002261, 2003.
McGonigle, A. J. S., Oppenheimer, C., Tsanev, V. I., Saun-der, S., Mulina, K., Tohui, S., Bosco, J., Nahou, J., Kuduon, J., and Taranu, F.: Sulphur dioxide fluxes from Papua New Guinea’s volcanoes, Geophys. Res. Lett., 31, L08606, doi:10.1029/2004GL019568, 2004.
Nho, E.-Y., Le Cloarec, M.-F., Ardouin, B., and Tjetjep, W. S.: Source strength assessment of volcanic trace elements emitted from the Indonesian arc, J. Volcanol. Geoth. Res., 74, 121–129, 1996.
Penner, J. E., Andreae, M., Annegarn, H., Barrie, L., Feichter, J., Hegg, D., Jayaraman, A., Leaitch, R., Murphy, D., Nganga, J., and Pitari, G.: Aerosols, their Direct and Indirect Effects, in: Cli-mate Change 2001: The Scientific Basis, edited by: Houghton, J. T., Ding, Y., Griggs, D. J., Noguer, M., Van der Linden, P. J., Dai, X., Maskell, K., and Johnson, C. A., Report to Intergovern-mental Panel on Climate Change from the Scientific Assessment Working Group (WGI), Cambridge University Press, 289–416, 2001.
Platt, U. and Stutz, J.: Differential Optical Absorption Spec-troscopy: principles and applications, XV 597, Springer, Heidel-berg, 272 pp., 2008.
P. Bani et al.: Sulfur dioxide emissions from Papandayan and Bromo 2407
Reed, M. H. and Spycher, N. F.: Calculation of high temperature pH and mineral equilibria in hydrothermal water, with application to geochemistry and studies of boiling and dilution, Geochim. Cosmochim. Ac., 48, 1479–1492, 1984.
Reed, M. M. and Spycher, N. F.: Boiling, cooling, and oxidation in epithermal systems: a numerical modeling approach, Rev. Econ. Geol., 2, 249–272, 1985.
Shinohara, H.: Excess degassing from volcanoes and its role on eruptive and intrusive activity, Rev. Geophys., 46, RG4005, doi:10.1029/2007RG000244, 2008.
Simkin, T., Siebert, L., McClelland, L., Bridge, D., Newhall, C., and Latter, J. H.: Volcanoes of the World: A Regional Directory, Gazetteer, and Chronology of Volcanism During the Last 10,000 Years, Hutchinson Ross, Stroudsburg, PA, 1981.
Spiro, P. A., Jacob, D. J., and Logan, J. A.: Global Inventory of Sulfur Emissions with 1◦×1◦Resolution, J. Geophys. Res., 97, 6023–6036, 1992.
Spycher, N. F. and Reed, M. H.: Evolution of a Broadlands-type epithermal ore fluid along alternative P-T paths: implications for the transport and deposition of base, precious, and volatile met-als, Econ. Geol., 84, 328–359, 1989.
Stevenson, D. S., Johnson, C. E., Collins, W. J., and Derwnt, D. R.: The tropospheric sulphur cycle and the role of volcanic SO2, in:
Volcanic Degassing, edited by: Oppenheimer, C., Pyle, D. M., and Barclay, J., Geol. Soc. London, Special Publications, 213, 295–305, 2003.
Stoiber, R. E., Malinconico Jr., L. L., Williams, S. N.: Use of the correlation spectrometer at volcanoes, in: Forecasting Volcanic Events, edited by: Tazieff, H. and Sabroux, J. C., Elsevier, New York, 425–444, 1983.
Stoiber, R. E., Williams, S. N., and Huebert, B.: Annual contribution of sulfur dioxide to the atmosphere by volcanoes, J. Volcanol. Geoth. Res., 33, 1–8, 1987.
Stutz, J. and Platt, U.: Numerical analysis and estimation of the sta-tistical error of differential optical absorption spectroscopy mea-surements with least-squares methods, Appl. Optics, 35, 6041– 6053, 1996.
Symonds, R. B., Gerlach, T. M., Reed, M. H.: Magmatic scrubbing: implications for volcano monitoring, J. Volcanol. Geoth. Res., 108, 303–341, 2001.
Tsanev, V. I.: A collection of JScripts for retrieval of gas col-umn amounts using DOAS methodology, available at: http: //www.geog.cam.ac.uk/research/projects/doasretrieval/ (last ac-cess: 30 September 2013), 2008.
Voigt, S., Orphal, J., Bogumil, K., and Burrows, J. P.: The Tempera-ture Dependence (203–293 K) of the Absorption Cross-Sections of O3in the 230–850 nm region Measured by Fourier-Transform