HAL Id: hal-01324904
https://hal.sorbonne-universite.fr/hal-01324904
Submitted on 1 Jun 2016HAL is a multi-disciplinary open access archive for the deposit and dissemination of sci-entific research documents, whether they are pub-lished or not. The documents may come from teaching and research institutions in France or abroad, or from public or private research centers.
L’archive ouverte pluridisciplinaire HAL, est destinée au dépôt et à la diffusion de documents scientifiques de niveau recherche, publiés ou non, émanant des établissements d’enseignement et de recherche français ou étrangers, des laboratoires publics ou privés.
Imperfect automatic image classification successfully
describes plankton distribution patterns
Robin Faillettaz, Marc Picheral, Jessica Y. Luo, Cédric Guigand, Robert K.
Cowen, Jean-Olivier Irisson
To cite this version:
Robin Faillettaz, Marc Picheral, Jessica Y. Luo, Cédric Guigand, Robert K. Cowen, et al.. Imper-fect automatic image classification successfully describes plankton distribution patterns. Methods in Oceanography, Elsevier, 2016, �10.1016/j.mio.2016.04.003�. �hal-01324904�
IMPERFECT AUTOMATIC IMAGE CLASSIFICATION SUCCESSFULLY
1DESCRIBES PLANKTON DISTRIBUTION PATTERNS
2 3Robin Faillettaz1; Marc Picheral1; Jessica Y. Luo2,3; Cédric Guigand2; Robert K. Cowen2,3; Jean-4 Olivier Irisson1* 5 6 1Sorbonne Universités, UPMC Univ Paris 06, CNRS, Laboratoire d'Océanographie de Villefranche, 7 181 Chemin du Lazaret, 06230 Villefranche-sur-Mer, France 8 2Marine Biology and Fisheries, Rosenstiel School of Marine and Atmospheric Science (RSMAS), 9 University of Miami, Miami FL 33149, USA 10 3Oregon State University, Hatfield Marine Science Center, Newport OR 97365, USA 11 12 *Corresponding author: [email protected] 13
14
ABSTRACT
15 Imaging systems were developed to explore the fine scale distributions of plankton (<10 m), but 16 they generate huge datasets that are still a challenge to handle rapidly and accurately. So far, 17 imaged organisms have been either classified manually or pre-classified by a computer program 18and later verified by human operators. In this paper, we post-process a computer-generated 19
classification, obtained with the common ZooProcess and PlanktonIdentifier toolchain 20 developed for the ZooScan, and test whether the same ecological conclusions can be reached 21 with this fully automatic dataset and with a reference, manually sorted, dataset. The Random 22 Forest classifier outputs the probabilities that each object belongs in each class and we discard 23 the objects with uncertain predictions, i.e. under a probability threshold defined based on a 1% 24 error rate in a self-prediction of the learning set. Keeping only well-predicted objects enabled 25
considerable improvements in average precision, 84% for biological groups, at the cost of 26
diminishing recall (by 39% on average). Overall, it increased accuracy by 16%. For most groups, 27
the automatically-predicted distributions were comparable to the reference distributions and 28
resulted in the same size-spectra. Automatically-predicted distributions also resolved 29
ecologically-relevant patterns, such as differences in abundance across a mesoscale front or 30 fine-scale vertical shifts between day and night. This post-processing method is tested on the 31 classification of plankton images through Random Forest here, but is based on basic features 32 shared by all machine learning methods and could thus be used in a broad range of applications. 33
KEYWORDS
34Imaging system; ISIIS; Automatic classification; Plankton distribution; Machine learning; Big 35
dataset
INTRODUCTION
37
From the centimetre to kilometre-scales, hydrodynamics, predator-prey interactions and 38
behaviour strongly structure the patchy distributions of planktonic organisms in pelagic 39
environments (Davis et al., 1992; Pinel-Alloul, 1995; Lough and Broughton, 2007). At mesoscales 40
(10-100 km) and submesoscales (<10 km), plankton distributions are primarily determined by 41
hydrological structures like fronts and eddies (Belkin, 2002; Belkin et al., 2009; Luo et al., 2014). 42
For example, convergent flows at frontal features can increase primary production (Grimes and 43
Finucane, 1991) and mechanically concentrate organisms (Bakun, 2006; Olson et al., 1994). 44
However, the influence of these structures may be counter-balanced by behaviour or other 45
biotic processes. Indeed, at fine scale (<1 km), diel vertical migrations can be a strong driver of 46
plankton distributions (Benoit-Bird and McManus, 2012; Neilson and Perry, 1990). At 47
microscales (<1 m to 10 m), biotic interactions such as competition and predation are likely to 48
generate vertical gradients in the distribution of zooplankton. For example, in Monterey Bay, 49
predator avoidance is thought to vertically separate copepods, phytoplankton thin layers, and 50
gelatinous zooplankton predators (Greer et al., 2013). Off the coast of Massachusetts, 51
interactions between internal waves and foraging drives a temporary overlap between layers of 52
high copepod concentration and ichthyoplankton (Greer et al., 2014). 53
Historically, zooplankton and ichthyoplankton distributions have been sampled with pumps 54
(Herman et al., 1984) and regular or stratified plankton nets (e.g. regular: WP2, Bongo; e.g. 55
stratified: MOCNESS, BIONESS, MULTINET; Wiebe and Benfield, 2003). However, even depth-56
stratified nets cannot typically resolve the fine and microscale processes at which biotic 57
interactions occur, because they usually sample (and integrate) over at least 10 m vertically and 58
much more horizontally. While pumps offer finer spatio-temporal resolution, they are often 59
limited to surface layers (<10 m depth -- Boucher, 1984; sometimes down to 100 m depth -- 60
Herman et al., 1984) and sample much smaller volumes (on average 50-60 L min-1 vs.
61
7,500 L min-1 for a small plankton net; Wiebe and Benfield, 2003).
62
In the last two decades, in situ imaging systems were developed with the aim of sampling 63
microscale processes in the plankton and accelerating data processing using efficient automatic 64
classification techniques (MacLeod et al., 2010; Wiebe and Benfield, 2003). Several imaging 65
systems have emerged, tackling different ecological questions by targeting different size spectra 66
of organisms. The Video Plankton Recorder (VPR; Benfield et al., 1996) and the Underwater 67
Vision Profiler (UVP; Picheral et al., 2010) sample particles and zooplankton. The Shadow Image 68
Particle Profiling Evaluation Recorder (SIPPER; Samson et al., 2001), the ZOOplankton 69
VISualization imaging system (ZOOVIS; Bi et al., 2013) and the In Situ Ichthyoplankton Imaging 70
System, used for this study (ISIIS; Cowen and Guigand, 2008), target large zooplankton up to 71
several centimetres. ISIIS has been specifically designed to sample fish larvae that are patchy 72
and rare (Cowen et al., 2013). Therefore, it samples larger volumes of water compared to other 73
instruments (ISIIS: from 108 to 168 L s-1; UVP: typically 8 L s-1, up to 20.0 L s-1; SIPPER 9.2 L s-1; 74
ZOOVIS 3.6 L s-1; VPR: 10 to 17 mL s-1) and has proved to be particularly suited to describe the 75
fine-scale distribution of both ichthyoplankton (Cowen et al., 2013; Greer et al., 2014) and other 76
taxa, including gelatinous zooplankton (Luo et al., 2014; McClatchie et al., 2012). These imaging 77
systems generate large datasets of images. For example, in one hour, ISIIS records over 78 200 billion pixels (the equivalent of more than 200 GB of greyscale TIFF images), usually yielding 79 several hundred thousand objects of interest, that have to be identified. Manually processing 80 such big datasets has to be limited to few groups of interest (e.g. Greer et al., 2015, 2014; Luo et 81 al., 2014; McClatchie et al., 2012) but remains time prohibitive. Developing accurate automatic 82 identification processes for such datasets is still a challenge (Benfield et al., 2007; Cowen et al., 83
2013; Culverhouse et al., 2006) that needs to be solved in order to fully resolve microscale 84
processes. 85
Imaging data are typically handled in a three-step process: first, detecting and segmenting 86
relevant objects (or regions of interest) from raw images; then measuring features of each 87
object (such as size, aspect ratio, etc.); and finally using these features to classify the objects 88
into biologically/ecologically relevant groups through machine learning algorithms. Several 89
automatic identification procedures have already been tested on plankton datasets of a few 90
thousand images using various classifiers: Random Forest (e.g. Bell and Hopcroft, 2008), Support 91
Vector Machines (e.g. Hu and Davis, 2005), Bayesian models (Ye et al., 2011) or neural networks 92
(e.g. Davis et al., 2004). Some also combined several classifiers to improve prediction accuracy 93 (Hu and Davis, 2005; Li et al., 2014; Zhao et al., 2010). While the algorithms differ, all of these 94 classifiers have in common the fact that they result in a final score (often a probability) for an 95
object to be in each class and attribute the object to the class with the highest score. This 96
predicted class is often the only information that is retained from the classifier. So, while 97 classification is typically viewed as a yes-or-no problem, the real outputs from the classifiers are 98 actually continuous. 99 In this study, we take the example of the commonly-used image processing and identification 100 toolchain ZooProcess and Plankton Identifier (PkID) (Gorsky et al., 2010). The software was first 101
developed for the ZooScan (laboratory plankton scanner) and then extended to the UVP 102
(Picheral et al., 2010) and other imaging systems. ZooProcess segments objects from the full 103 image and computes a set of descriptive features (grey levels, length, width, area, shape, etc.) 104 that are then used by PkID through various classification algorithms (Support Vector Machine, 105 Neural network, Random Forest, etc.), although Random Forest (Breiman, 2001) has proven to 106 be the most accurate and is now used routinely (Gorsky et al., 2010). This software suite is free, 107 open-source, easy to install, and well supported. Therefore, it is widely distributed worldwide 108 and used by 60 research teams from the tropics to the poles (e.g. France (Vandromme et al., 109
2011); New-Caledonia (Smeti et al., 2015); Antarctica (Espinasse et al., 2012)). It is most 110
commonly used as a computer-assisted identification system, whereby the classifier proposes 111
identifications that are then validated by human operators for all objects. 112
ZooProcess and PkID offer appropriate tools to handle ISIIS data but the amount of data 113
generated by ISIIS makes human validation impractical. For example, validating the 114
identifications of the 1.5 million objects used as a reference in this study took seven full-time 115
months; a few days of ISIIS deployments typically yield from ten to a hundred million objects. 116
However, given the size and spatial resolution of the dataset, even a subset of it is likely to 117 contain relevant ecological information, at least at the meter to 10 m scale. Here, we propose to 118 discard objects with a low classification score (i.e. the least likely to be correctly identified) and 119 assume that all remaining objects are correctly classified, hence bypassing the validation step. 120
Most other studies compare automatic classification methods using only classification metrics 121
(e.g. precision, recall). We suggest that a more biologically relevant approach is to examine 122
whether the same ecological patterns can be detected in datasets generated by various 123 methods. Here we compare the same data either manually identified (hereafter the reference 124 dataset) or automatically classified and further filtered based on classification score (hereafter 125 the predicted dataset). We specifically explore the fine-scale spatial distribution of zooplankton 126
across a frontal structure, its relationship with the environment, the size distribution of 127 planktonic groups as well as their diel vertical migration patterns. 128
MATERIALS AND METHODS
129 Description of ISIIS 130The In Situ Ichthyoplankton Imaging System (ISIIS) is a towed underwater imaging system 131
(Cowen and Guigand, 2008). It uses backlight shadowgraph imaging, which makes it ideally 132 suited for small and often transparent planktonic organisms in a consistent manner. The version 133 of ISIIS used here was slightly modified from that of Cowen and Guigand (2008). The line-scan 134 camera imaged a 10.5 cm-tall field of view with a 50 cm depth of field. With a line-scan camera, 135 the image is created by the movement of the instrument and scanning at 28 kHz produced a 136 continuous image when towed at 2 m s-1 (4 knots). These settings resulted in a sampling rate of 137
108 L s-1. Additionally, ISIIS is equipped with environmental sensors recording temperature, 138
conductivity (hence salinity and density), oxygen, chlorophyll a fluorescence and 139
photosynthetically active radiation (PAR) at a rate of 2 Hz. 140
Test data 141
ISIIS was deployed for two transects across the Ligurian current, a coastal jet that creates a 142
permanent, mesoscale front. The current delineates a coastal, a frontal and an offshore zone, 143
with characteristic hydrological properties (Sammari et al., 1995) and biological communities 144
(Boucher et al., 1987). One transect was conducted at night, the other during the following day, 145
in July 2013. Both transects were conducted on the same line, though the night transect 146
sampled from onshore to offshore, and the day transect sampled from offshore to onshore. 147
Thanks to moveable fins, ISIIS sampled the water column in a tow-yo fashion, between the 148 surface and 100 m depth, with a vertical speed of 0.2 m s-1. The images in this study come from 149 13 down-casts of the night transect and 7 down-casts of the day transect, which were the only 150 ones fully processed of the ~26 total up- and down- casts of each transect. 151 Image pre-processing 152
ISIIS collected a continuous stream of pixels, 2048 pixels in height. The stream was cut into 153
square 2048 x 2048 frames by the acquisition software (example in Figure 1). Because the 154 camera was continuously scanning the same line, a single speckle or scratch along the optical 155 path would create a continuous streak in the resulting 2D image. These streaks were removed 156 by dividing each frame by the average of the previous 50 consecutive frames and normalising 157 the result to [0, 255] in grey intensity, a process known as flat-fielding. 158 Segmentation 159
The shadows of planktonic organisms or particles imaged by ISIIS appeared dark on a light 160
background. All images were thresholded at the 195 grey level; i.e. adjacent pixels darker than 161
195 (255=white, 0=black) were considered as objects of interest. The flat-fielding procedure 162 resulted in an almost white background and well contrasted objects (Figure 1). Therefore, the 163 detection of objects was not very sensitive to the threshold value and 195 was chosen after a 164 few tests. 165 Small objects were difficult to identify reliably, even for human operators. Only objects larger 166 than 250 px in area (equivalent to 18 px in diameter for a spherical object) were considered in 167
this study. With a pixel resolution of 51 μm, this converts to an area of 0.6 mm2 and an
168
equivalent diameter of 920 μm. 169
All objects with sufficient size and darkness were segmented out of the frames (Figure 1 170
exemplifies which objects were considered and which were not) and the region outside of the 171
object itself was made pure white. A total of 1.5 million objects were detected. 172
Feature extraction 173
The purpose of this study is to optimise an existing classification procedure a posteriori. 174
Therefore, the feature extraction was based on the standard configuration in ZooProcess/PkID 175
and is not described in detail here (please refer to Gasparini and Antajan, 2013; Gorsky et al., 176
2010). Briefly, 37 features were measured by ZooProcess, and 9 additional variables were 177
derived by PkID from the original 37 features. These features characterised each object’s size 178
and shape (length of the minor and major axes of the best fitting ellipse, Feret diameter, 179
circularity, symmetry, aspect ratio), transparency (five measures of grey levels: mean, mode, 180 standard deviation, minimum, maximum), and aspect (grey level histogram descriptors such as 181 skewness, cumulative histograms, etc.). When combined, those features can characterise object 182 classes; for example, small, dark, ovoid objects with a large Feret diameter compared to their 183 overall size are probably copepods with their antennae extended. Therefore, they serve as the 184 basis for automatic classification. 185
186
Figure 1. Example of a flat-fielded 2048 x 2048 pixels frame collected by ISIIS. The bounding
187
box of objects extracted and measured is drawn in red. Those objects are labelled (Ag: 188
aggregates; Ar: Trachymedusae Arctapodema spp; Ch: chaetognath; Co: calanoid copepod; Do: 189
doliolid; Ep: Pelagia noctiluca ephyrae; Fl: fish larva; Un: unidentified). Note that, on rare 190
occasions, some small-bodied and transparent organisms, such as doliolids, were either 191 truncated or split into several objects and then became hardly identifiable. 192 Ep Fl Ch Co Ar Do Ep Ep Ep Do Do Do Do Do Do Do Ag Do Do Do Do Do Do Do Do Do Do Do Do Do Do Do Do Do Do Un Ag Ag
Learning set and classification 193
Supervised classification techniques require a set of identified and measured objects to learn 194
the differences between classes based on their features. Our learning set comprised 14 biotic 195
and abiotic classes with a target size of 200 objects per class (see Table 1), a number which 196
proved to be appropriate for previous ZooProcess/PkID projects (Gorsky et al., 2010). The most 197
numerous classes in the data (noise in particular) were also inflated in the learning set, to get a 198
total of 5979 objects. Objects in the learning set were chosen to be representative of the 199
diversity of each class. 200
All 1.5 million segmented objects were classified into these 14 classes by a Random Forest 201
classifier using the 46 measured features (Gorsky et al., 2010). The parameters of the classifier 202
were left at the appropriate defaults in PkID: 100 trees, bagging of 1, 6 features randomly 203 selected per tree, leaf size of 2 objects. 204 Finally, three trained operators validated the classification of each object, yielding a completely 205 manually-identified dataset of 1.5 million objects, hereafter referred to as the reference dataset. 206 Table 1. Name, number of objects in the learning set (n) and description of classes. First non-207 living objects or artefacts, then biological organisms. 208 Class n Description, taxonomical identification Dark aggregates 314 Solid, opaque marine snow Light aggregates 489 Marine snow (larvacean houses, mucus, etc.) Fibers 433 Thin fibers and fecal pellets Noise 2296 Noise generated by water density changes Tentacles 224 Pelagia noctiluca tentacles Copepods 349 Mainly calanoid copepods Doliolids 209 Thaliacean, Family Doliolidae Fish larvae 289 Fish larvae Trachymedusae 200 Trachymedusae (e.g. Arctapodema spp) Diatom chains 342 Phytoplankton, diatoms chains
Acantharia radiolarians 213 Radiolaria, Order Acantharia Radiolarian colonies 255 Radiolaria, Order Colodaria, in colonies Solitary radiolarians 267 Radiolaria, Order Colodaria, solitary Shrimps 99 Shrimp-like organisms (e.g. Mysidacae or Euphausiacae) Data filtering and optimisation of the classifier precision 209 To detect meaningful ecological patterns in the distribution of a computer-predicted class, there 210 needs to be sufficiently high confidence that objects in that class belong to the same taxonomic 211 group. In terms of classifier performance, this requires high precision (precision = proportion of 212 correctly classified objects in a predicted class). With low precision, a predicted class would be a 213
heterogeneous mixture of various taxonomic groups, the distribution of which cannot be 214
interpreted ecologically. Conversely, for high frequency imaging datasets, the data are often in 215
sufficient quantity that a subsample of the whole dataset would be enough for detecting 216
ecological patterns. In terms of classification metrics, a low recall may be acceptable (recall = 217
proportion of the total number of objects of a class that are predicted in that class). Therefore, 218
we suggest that, to detect ecological patterns in a high frequency dataset, particularly for 219 common taxa, precision is more important than recall. To test this hypothesis, we filtered out 220 the most likely mistakes in the computer-predicted dataset (to increase precision), at the cost of 221 discarding some correctly identified objects (hence decreasing recall), and then compared the 222 resulting dataset against the reference set. 223 The probabilities for each object to be in each class (i.e. the final output of the classifier) were 224
used as the filtering criterion. All objects assigned to a given class were ranked in increasing 225 order of probability. All objects with probability above a threshold were kept and assumed to be 226 correctly identified; other objects, with probability equal to or lower than the threshold, were 227 considered to be potentially wrong and were discarded. Since precision needs to be controlled, 228 the threshold should be set to result in a given precision. For example, picking the probability of 229
the first wrongly identified object as the threshold would yield 100% precision (all objects 230
ranked above the first false positive are correctly classified). Here, a 1% error rate (99% 231
precision) was deemed acceptable. Error rates lower than 1% resulted in discarding 3% more 232
objects while improving precision by only 0.2. Higher error thresholds resulted in low precision 233
when applied to the whole dataset (average precision with threshold at 10%=54, at 5%=60.1, at 234
1%=76.9). A 1% error threshold allowed us to increase precision significantly and still keep a 235
representative percentage of objects. 236
The computation of thresholds was done with the learning set only, because in operational 237
conditions, only the identifications of the objects in the learning set are known. The class 238
probability of each object in the learning set was predicted using 2-fold cross-validation 239
repeated 50 times, using the Random Forest classifier in PkID. The probabilities were averaged 240
over the 50 repetitions, objects were assigned to the class of highest probability, and probability 241
thresholds at 1% error were computed in each class. Those thresholds, computed on the 242 learning set, were then applied to the predictions of the 1.5 million objects and the subset of 243 objects that was kept constituted the predicted dataset. Thus, once the objects in the learning 244 set are identified manually (which is required for prediction anyway), this precision optimisation 245 method requires only computation, no further human validation effort. 246 Consequence of data filtering on classification metrics 247
By construction, the chosen thresholds resulted in exactly 99% precision on the learning set. 248
Because all 1.5 million objects in the reference set were actually identified in this exercise, the 249
precision, recall and F1 score (2 × precision × recall / (precision + recall)) could be computed for 250
each class over the whole dataset, before and after the filtering process. This allowed us to 251 check whether the precision after filtering approached 99% on the whole dataset as well and 252 how much this improvement in precision cost in terms of decrease in recall. 253 Comparison of size spectra 254 The size structure of planktonic communities is often considered as a proxy to study the transfer 255 of energy through the food web and the export and sequestration of carbon (Legendre and Le 256 Fèvre, 1991). It could be expected that smaller objects would be less defined, would therefore 257 be predicted with lower confidence (i.e., lower probabilities) and may be preferentially filtered 258 out by our method. To assess this, size spectra (i.e., probability density distributions of sizes) 259
were estimated with a kernel method (Gaussian kernel with a 0.25 mm standard deviation) and 260 compared in the reference and predicted dataset. 261 Statistical comparisons of spatial distributions 262 Individual objects were counted over 1 m depth bins along the undulating trajectory of ISIIS and 263 counts were transformed into concentrations by dividing by the volume sampled in each bin. 264 This resulted in maps of the concentration of each class of organism across depth (0-100 m) and 265 distance from the coast (0-60 km) for each transect (for examples see Figures 3 and 4). 266 The similarity between the maps for the reference and predicted datasets was assessed using 267 the t-test modified by Dutilleul (Dutilleul et al., 1993; H0: no correlation between the maps, H1: 268
significant correlation between the maps), as well as the Pearson and Spearman correlation 269
coefficients. On a map, observations close to each other are usually similar; this spatial 270
autocorrelation means that observations close to each other are not independent and that the 271
number of actual degrees of freedom is lower than the apparent sample size. The Dutilleul t-test 272
corrects the number of degrees of freedom based on the spatial autocorrelation of the data 273
(computed as Moran's I) and is therefore appropriate to avoid over-estimating the similarity of 274
spatial patterns. 275
Because diel-vertical migration is such a widespread behaviour in marine ecosystems (Hays, 276
2003) and strongly influences survival through predator-avoidance and foraging in many taxa 277
(Neilson and Perry, 1990), data were specifically inspected in the vertical dimension. Average 278
vertical distributions were computed for each group and each transect (hence separating day 279
and night). Reference and predicted vertical distributions were compared with the version of 280
Kolmogorov-Smirnoff test modified by Solow et al. (2000), which specifically takes into account 281
autocorrelation along depth caused by the patchiness of plankton. 282
By construction, concentrations were lower in the predicted dataset than in the reference 283
dataset, because the former is a subset of the latter. Before the comparisons described above, 284
concentrations were normalised to a maximum value of 1 for each class in each transect, by 285
dividing by the maximum concentration recorded. This put the focus on distribution patterns, 286
rather than actual concentration values, which were poorly estimated when recall was low 287 anyway. 288 Finally, the predicted and reference datasets are not independent (one is a subset of the other) 289
and the absolute values of the test statistics and p-values are therefore biased. The relative 290 values, among classes, are informative however. 291 Comparison of ecological patterns 292 The frontal structure across which the transects were sampled is characterised by an inshore-293 offshore gradient of increasing salinity, with a front that can be delineated by the 38.2 and 38.3 294 isohalines (Sammari et al., 1995) and is expected to strongly structure zooplankton communities 295 (e.g. Boucher, 1984; Pedrotti and Fenaux, 1992). Beyond comparing the distribution maps for 296 the reference and predicted datasets statistically, the results were interpreted with respect to 297 the frontal structure to check whether the ecological patterns were the same. In addition, the 298
relationships between planktonic abundances and environmental variables were inspected in 299
the reference and predicted datasets. The variables inspected were: salinity, which best marks 300
the front, temperature, which is strongly stratified vertically, chlorophyll a fluorescence, which 301
marks a clear Deep Chlorophyll Maximum (DCM), and oxygen concentration, which depends 302
both on the frontal structure and on the DCM. When the relationships could be considered 303 linear, the slopes were estimated through Generalised Linear Models (GLM) with Poisson errors 304 and statistically compared between the two datasets using ANOVA. 305 Similarly, beyond comparing vertical distributions statistically, we assessed whether the range 306
and strength of diel vertical migrations could be as readily detected in the predicted dataset 307
than in the reference dataset. Within each class, day and night distributions were compared 308
with the Solow-Kolmogorov-Smirnov test and the value of its statistic was compared between 309
reference and predicted data. The day-night shift in the depth centre of mass of the 310
distributions (mean of depth weighted by abundance at that depth, Zcm; Irisson et al., 2010) was
311
computed and compared between the reference and predicted datasets. 312
Data selection 313
Abrupt changes in water temperature around the thermocline generated large density 314 differences, which are unfortunately well captured on shadowgraphs. These numerous objects 315 (n=1,287,302) were classified as "Noise". Another abundant class of objects were tentacles of 316 the medusa Pelagia noctiluca (n=8,106), which occasionally got stuck on ISIIS and were imaged 317 constantly. These two classes of objects are not biologically relevant in the present study, but 318 were abundant and predicted with high precision (>95%), and were thus both omitted from the 319 subsequent analyses. 320
RESULTS
321 Consequences of data filtering on classification metrics 322 Discarding low probability images considerably increased precision, by 37% on average (Table 323 2). While probability thresholds were set to yield 99% precision on the cross-validated learning 324set, precision was lower when the thresholds were applied to the whole dataset. This was 325
expected, because the ~6000 images in the learning set cannot fully represent the variability in 326
the whole dataset (1.5 million images). The average precision of the biological categories after 327
filtering was 84%. The trachymedusae and Acantharia radiolarians displayed the lowest 328
precision (61.9% and 65.4% respectively) but this already was an improvement of more than 329
50% compared to the situation before filtering. 330
To reach these precision levels, a large amount of images had to be discarded, leaving only 331
28.1% of the objects from the original dataset (n=39,758, excluding “noise” images). The 332
percentage of objects retained ranged from 8.5% for fibres (n=557) to a maximum of 63.7% for 333
solitary radiolarians (n=8,569). As a consequence, on average, filtering decreased recall by 39% 334
and F1 score by 7.8%. However, the improvement in precision dominated the effect of the 335
decrease in recall, because classification accuracy of the whole dataset improved from 40.2% to 336
56.3% after filtering. 337
Table 2. Classification metrics before and after filtering out objects with low prediction
338
confidence: number of particles before filtering (n); percentage of data kept after filtering;
339
precision, recall, and F1 score before and after filtering, and difference (after – before). 340 Improvements (positive differences) are bolded. Non-living groups are presented first, groups of 341 biological interest second. 342 Precision Recall F1
Class n %kept before after diff before after diff before after diff Dark aggregates 60164 6.5 77 95 19 50 7 -43 60 7 -54 Light aggregates 4209 4.2 8 17 9 53 4 -49 14 4 -10 Fibers 8055 6.9 46 85 38 56 7 -49 51 7 -44 Copepods 17459 22.4 54 88 34 72 22 -49 62 22 -39 Doliolids 30478 40.2 80 95 16 64 40 -24 71 40 -31 Fish larvae 802 23.2 12 80 67 62 23 -39 21 23 3 Trachymedusae 524 50.6 9 62 53 79 51 -29 16 51 35 Diatom chains 11015 28.6 75 97 22 72 29 -43 73 29 -45 Acantharia radiolarians 1021 18.9 7 65 58 74 19 -55 14 19 5 Radiolarian colonies 4367 16.7 24 94 70 62 17 -45 35 17 -18 Solitary radiolarians 13049 65.7 68 88 19 89 66 -23 77 66 -12 Shrimps 213 52.6 51 89 38 74 53 -21 60 53 -7 Comparison of size spectra in the reference and predicted datasets 343 In most classes, the size distribution of objects in the automatically predicted dataset and in the 344
reference dataset were closely related (Figure 2). However, in three groups (fish larvae, 345
radiolarian colonies, and shrimps), the shape of the spectrum was conserved but the occurrence 346
of small objects was under-estimated. In particular, the mode of the spectrum (i.e. the most 347
frequent size class) was larger by 1.3 mm for fish larvae in the predicted dataset compared to 348
the reference dataset, by 6 mm for radiolarian colonies and by 2.8 mm for shrimps (Figure 2). 349
350 Figure 2. Per-class size spectra in the reference (solid lines) and automatically predicted and 351 filtered (dotted lines) datasets. Probability density distributions of sizes were scaled between 0 352
and 1 to focus attention on the shapes of the distribution rather than the differences in the 353 number of objects between the two datasets. The minimum size of objects considered was 250 354 pixels in area, resulting in ≥ 920 µm in major axis. 355 Distribution of plankton with respect to the front 356
The automatically predicted and filtered spatial distributions of most taxa and particles were 357 significantly correlated with the reference distributions in 20 of the 22 groups at the p < 0.001 358 0.00 0.25 0.50 0.75 1.00 0.00 0.25 0.50 0.75 1.00 0.00 0.25 0.50 0.75 1.00 0.00 0.25 0.50 0.75 1.00 0 25 50 75 100 0 20 40 60 0 30 60 90 3 6 9 0 10 20 30 5 10 15 20 3 6 9 0 5 10 15 20 25 2 4 6 0 30 60 90 2.5 5.0 7.5 0 10 20 30 40 50
Dark aggregates Light aggregates Fibers
Copepods Doliolids Fish larvae
Trachymedusae Diatom chains Acantharia radiolarians
Radiolarian colonies Solitary radiolarians Shrimps
Major axis (mm) Predicted Validated S cal e d probab ilit y de ns ity
level (Table 3; Figure 3). Correlation coefficients were also very high (seven classes with r > 0.7, 359 and eight additional classes with r > 0.5). The only two exceptions are fish larvae and shrimps in 360 the day transect, both of which were very rare. 361
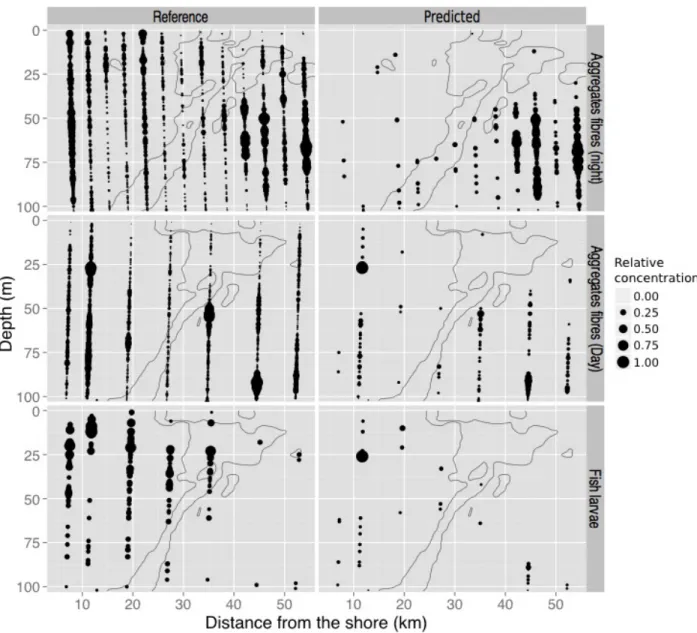
At the chosen 99%-precision filtering level, so many images of fish larvae and fibres were 362
discarded that the resulting spatial distributions were very sparse (14.9% and 8.5% of images 363
left, respectively; Figure 4). Such sparse distributions would clearly not be interpreted 364 ecologically, given how little data are left and how much is discarded. So, information is lost but 365 at least no wrong conclusions would be drawn. In addition, even in those cases, the locations of 366 the maximum concentration zones were properly captured in the predicted dataset; there were 367 just too few objects to represent the finer patterns (Figure 4). 368 Table 3. Statistical comparisons of spatial distributions between the reference and predicted 369
datasets with three statistics: Dutilleul modified t-test (statistic, recomputed degrees of
370
freedom and p-value), Pearson's correlation coefficient and Spearman's rank correlation 371 coefficient. NB: no light aggregates were observed at night. 372 Dutilleul t-test
Class Transect F-stat DoF p-value Pearson's r Spearman's rho Dark aggregates Night 29.99 35 p<0.001 0.66 0.68 Day 24.11 20 p<0.001 0.68 0.74 Light aggregates Day 10.05 76 p<0.01 0.11 0.34 Fibers Night 103.22 155 p<0.001 0.38 0.62 Day 144.93 191 p<0.001 0.42 0.62 Copepods Night 54.37 36 p<0.001 0.74 0.71 Day 36.50 28 p<0.001 0.73 0.71 Doliolids Night 12244.11 275 p<0.001 0.66 0.94 Day 27064.77 187 p<0.001 0.55 0.94 Fish larvae Night 231.25 162 p<0.001 0.44 0.77 Day 1.58 561 0.21 0.09 0.05 Trachymedusae Night 286.28 168 p<0.001 0.61 0.78 Day 130.66 287 p<0.001 0.48 0.55 Diatom chains Night 431.64 74 p<0.001 0.72 0.92 Day 377.12 97 p<0.001 0.75 0.86
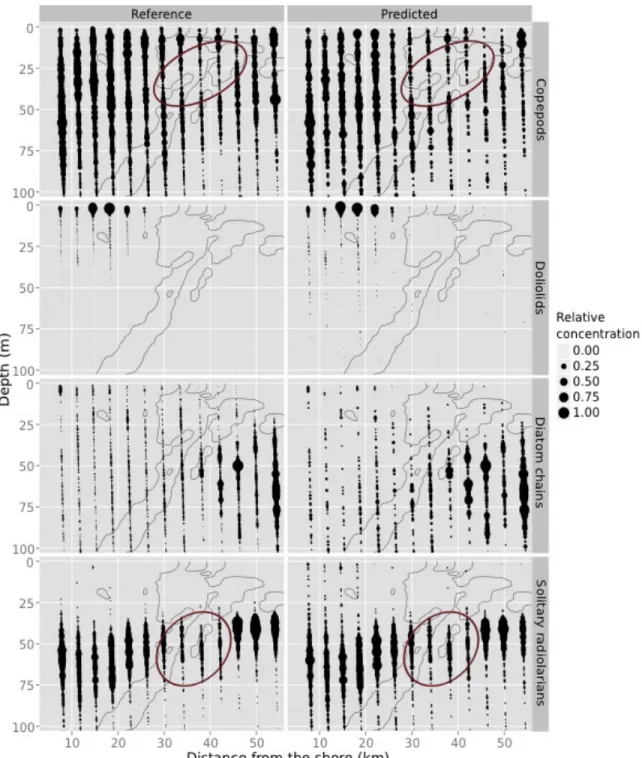
The reference spatial distributions showed that most taxa were strongly influenced by the 373 frontal zone: fish larvae, Acantharia radiolarians and doliolids were constrained on the coastal 374 side of the front, copepods were also more concentrated towards the coast and in the upper 375
layers of the water column, while diatom chains were more abundant in the deep, offshore 376
zones (Figure 3, left column). The high spatial resolution of the data allowed us to detect smaller 377
scale patterns such as a region of slightly lower concentrations of copepods and solitary 378
radiolarians at the front (around 30 m depth for copepods and 50 m depth for radiolarians; 379 Figure 3). Solitary radiolarians also occurred in shallower water in the offshore zone compared 380 to the coastal zone (Figure 3) and precisely followed the DCM (not mapped). All these patterns, 381 from the contrasts between taxa to the fine-scale low concentration regions at the front, could 382
also be well detected on the predicted data (Figure 3, right column). The ecological 383 interpretations in terms of the distribution relative to the frontal zone would be the same. 384 Acantharia radiolarians Night 130.32 176 p<0.001 0.53 0.64 Day 107.86 167 p<0.001 0.47 0.65 Radiolarian colonies Night 220.39 358 p<0.001 0.61 0.64 Day 116.20 393 p<0.001 0.52 0.49 Solitary radiolarians Night 107.11 22.24 p<0.001 0.91 0.89 Day 101.06 14.33 p<0.001 0.92 0.91 Shrimps Night 685.26 893.08 p<0.001 0.72 0.82 Day 0.01 719.25 0.91 0.00 0.00
Figure 3. Examples of some spatial distributions in the predicted dataset (right) that are well 385 correlated with the reference dataset (left). From top to bottom: copepods, doliolids, diatom 386 chains and solitary radiolarians, all during the night transect. The x-axis is the distance from the 387 coast (coastal side on the left, offshore side on the right). The area of the dots is proportional to 388 the concentration, scaled to a maximum of 1 per taxon in each dataset, to ease comparison of 389 patterns; the legend shows five examples but scaling is continuous. Grey lines are the 38.2 and 390
38.3 isohalines that delineate the frontal region. Ellipses highlight regions of lower 391
concentration located in the frontal zone. 392
393
Figure 4. Examples of poorly predicted spatial distributions (right) compared to the reference
394
distributions (left). From top to bottom: fibres at night, then during the day and fish larvae
395
during the day. Same conventions as Figure 3. 396
The relationships between the abundance of biological taxa and various environmental 397
variables (salinity, temperature, chlorophyll a fluorescence, oxygen concentration) were very 398 similar in the reference and predicted datasets. In fact, in 69 of the 80 relationships that could 399 be modelled with GLMs, the slopes were not significantly different between the two datasets. 400 For example, copepods were more abundant in fresher waters (Figure 5), which were found on 401 the coastal side of the front. The relationships with chlorophyll a fluorescence highlighted the 402
association of diatom chains and solitary radiolarians with the DCM. Finally, doliolids were vastly 403
more abundant in warmer, surface waters (Figure 5). All these conclusions would be reached 404
with the predicted dataset, which suggests that it could be used to explore and define the 405
habitat preference of various organisms. 406
407
Figure 5. Examples of the influence of environmental variables on the distribution and
408
concentration of several taxa for the reference dataset (black) and automatically predicted
409
and filtered dataset (red). The lines are the fitted values of GLMs with a Poisson distribution of
410
the residuals. The slopes of the GLM based on the predicted dataset are not significantly 411
different from the ones based on the reference dataset (ANOVA, all p>0.05). Concentration is 412
Copepods Diatom chains
Doliolids Solitary radiolarians
0 2 4 6 0 2 4 6 0 2 4 6 0 2 4 6 38.0 38.1 38.2 38.3 38.4 38.5 0.1 0.2 16 20 24 0.1 0.2 lo g(S tandardise d abu ndance * 1000 ) Dataset Predicted Reference Salinity Fluorescence (volts) Fluorescence (volts) Temperature (°C)
standardised between groups based on the maximum concentration per taxa and per dataset. 413
Day and night vertical distributions 414
In 8 of 12 groups, the predicted and reference vertical distributions were slightly but 415
significantly different (Solow-Kolmogorov-Smirnov test, p <0.05; Table 4). The four groups in 416
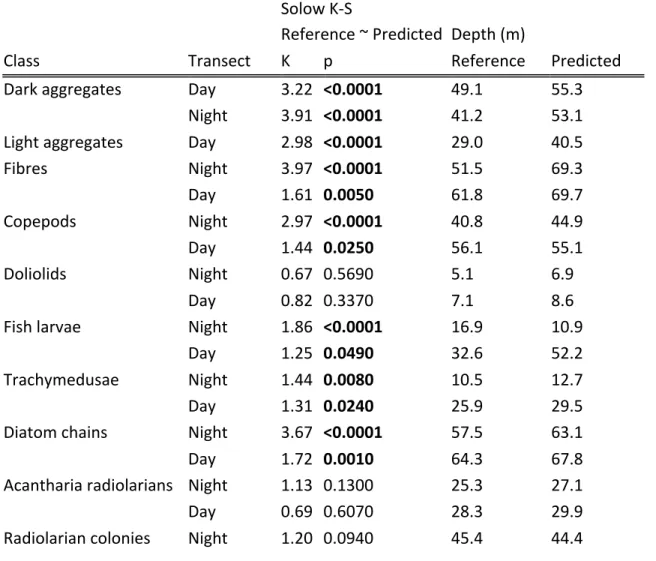
which the distributions were not statistically different were doliolids, Acantharia radiolarians, 417 colonial radiolarians and shrimps, although the lack of significant difference in the latter group 418 was probably due to their low overall numbers. 419 Table 4. Statistical comparisons of vertical distributions between the reference and predicted 420 datasets. The statistic and p-value of the Solow-Kolmogorov-Smirnov test are reported, as well 421 as the depth centre of mass of the distribution. 422 Solow K-S Reference ~ Predicted Depth (m)
Class Transect K p Reference Predicted Dark aggregates Day 3.22 <0.0001 49.1 55.3 Night 3.91 <0.0001 41.2 53.1 Light aggregates Day 2.98 <0.0001 29.0 40.5 Fibres Night 3.97 <0.0001 51.5 69.3 Day 1.61 0.0050 61.8 69.7 Copepods Night 2.97 <0.0001 40.8 44.9 Day 1.44 0.0250 56.1 55.1 Doliolids Night 0.67 0.5690 5.1 6.9 Day 0.82 0.3370 7.1 8.6 Fish larvae Night 1.86 <0.0001 16.9 10.9 Day 1.25 0.0490 32.6 52.2 Trachymedusae Night 1.44 0.0080 10.5 12.7 Day 1.31 0.0240 25.9 29.5 Diatom chains Night 3.67 <0.0001 57.5 63.1 Day 1.72 0.0010 64.3 67.8 Acantharia radiolarians Night 1.13 0.1300 25.3 27.1 Day 0.69 0.6070 28.3 29.9 Radiolarian colonies Night 1.20 0.0940 45.4 44.4
Day 0.51 0.9020 45.8 46.3 Radiolarians solitary Night 2.43 <0.0001 53.5 55.9 Day 2.23 <0.0001 59.3 60.9 Shrimps Night 1.00 0.1990 55.3 53.8 Day 0.51 1.0000 49.9 44.1 For many groups, except trachymedusae and fish larvae, ecological conclusions regarding depth 423 spread and preferendum would be the same in the reference and predicted dataset, even when 424 distributions were statistically different (Table 4, column “Depth (m)” and Figure 4). Similarly, an 425 analysis of diel vertical migration patterns would reach very similar conclusions on the reference 426
and on the predicted dataset. When a significant diel vertical migration was detected in the 427 reference dataset, it was also significant in the predicted one (Table 5). Conversely, radiolarian 428 colonies and Acantharia radiolarians do not appear to vertically migrate and this conclusion was 429 also reached with the predicted dataset. The range of downward migration of Trachymedusae, 430 solitary radiolarians and doliolids were also very comparable between the datasets; the same 431
was true, to a lesser extent, for calanoid copepods (Table 5, Figure 6). However, the vertical 432 migration of fish larvae was poorly predicted, with a bias towards the surface at night that was 433 much greater than in reality (Figure 6). 434 435 Figure 6. Exemples of vertical distribution during the day (left side) and at night (right side, 436 shaded) as depicted in the reference dataset (solid) and in the predicted and filtered dataset 437 0 25 50 75 100 −1 0 1 −1 0 1 −1 0 1 −1 0 1 −1 0 1 −1 0 1 −1 0 1 Trachymedusae Dep th (m) Density
Copepods Rad. solitary Fish larvae
NS NS * *** *** *** NS NS NS NS * *** * ***
Acantharia Rad. colonies Doliolids
Reference
Night Day Predicted
(dashed). The significant levels of the comparisons between reference and predicted 438 distributions are indicated for both day and night (NS: not significant; *: p <0.05; **: p <0.01; 439 ***: p <0.001). 440 Table 5. Comparison of the resolution of diel vertical migration patterns in the reference and 441 predicted datasets. Reported for each dataset are: (i) the statistic (K) of the Solow-Kolmogorov-442 Smirnov test comparing day and night (bold when the test is significant), which quantifies the 443 overall difference in distribution, and (ii) the difference between the depth centre of mass at 444 night and during the day, a proxy for the migration range (night − day; negative means upward 445 migration at night). 446 Solow-K-S day ~ night (K) Migration range (m) Reference Predicted Reference Predicted Copepods 4.10 2.86 -15.3 -10.3 Doliolids 1.16 1.14 -2.1 -1.7 Fish larvae 1.88 1.72 -15.8 -41.4 Trachymedusae 1.72 2.07 -15.4 -16.8 Diatom chains 2.53 2.25 -6.8 -4.7 Acantharia radiolarians 0.99 1.15 -3.0 -2.9 Radiolarian colonies 0.50 0.67 -0.4 -1.9 Solitary radiolarians 3.04 2.75 -5.8 -5.0 Shrimps 0.83 0.81 5.4 9.6
DISCUSSION
447The method presented here aimed at bypassing the manual validation of predicted 448
identifications by discarding objects classified with low confidence, hence improving precision 449
(but decreasing recall). The precision increase (+37% on average) was counter-balanced by a 450
recall decrease (-39% on average), but overall classification accuracy using this method 451
increased by 16%. 452
The quality and resolution of images may influence the maximum taxonomic resolution 453
achievable by any automatic classification method. Studies based on high quality laboratory 454
imagery of plankton have usually reached higher accuracy and could resolve a larger number of 455
groups (e.g. 22 phytoplankton groups in Sosik and Olson (2007); 25 zooplankton groups in 456
Fernandes et al. (2009); 10-20 groups in Benfield et al., 2007) than studies based on images of 457
zooplankton captured in situ which are usually of lesser quality (e.g. three groups with SVM, 458
achieving 80% accuracy (Bi et al., 2015); seven groups with random subspace model achieving 459
>90% precision but in a self-prediction of the learning set (Zhao et al., 2010); five to seven 460
groups with neural networks, reaching 60 to 80% accuracy; Davis et al., 2004; Hu and Davis, 461
2005). While only a formal comparison, using the same dataset (e.g. Fei-Fei et al. 2007), could 462
resolve the differences between classification methods, comparing the size orders of 463
classification metrics between studies can still be informative. Here, our classifier dealt with 14 464
groups and, after filtering, reached 56.3% general accuracy as well as 84% precision on 465
biological groups. This falls within the higher range in terms of precision and number of 466
predicted groups compared to previous studies on in situ images of zooplankton, especially 467
considering that 67-83% accuracy is often used as a benchmark for plankton classifications 468 (Culverhouse et al., 2003; Hu and Davis, 2005). While there is still room for improvement in the 469 original classification rates, the data filtering method presented in this study markedly improved 470 the performance of the standard ZooProcess/PkID classification. 471 Large image datasets are likely to become increasingly common thanks to the development of 472
affordable high-frequency, high-resolution cameras like the one installed on ISIIS. In such big 473
datasets, all the information may not be essential and some may be efficiently omitted (Bi et al., 474
2015). The filtering approach used in this study considerably subsampled the data (72% of 475
objects were discarded) in order to focus only on well-predicted objects. Despite this high 476
subsampling rate, the two dimensional, and to a lesser extent vertical, distributions of many 477
classes were not significantly different between the subsampled and the total, reference 478
dataset. In addition, the poorly predicted groups could be easily identified by the sparseness of 479
their predicted distribution and/or the high proportion of discarded images (>90%). This 480
provided an additional control for the validation of automatically predicted distributions. 481
More importantly, studying realistic ecological questions with the reference and predicted 482 datasets resulted in the same conclusions. 483 The size distribution of objects of most classes (9 of 12) were similarly represented in both the 484 automatically predicted and filtered dataset (Figure 2). In the three other classes, the filtering 485 method discarded small objects (<5 mm) more often than larger ones, possibly because small 486 objects are more prone to be misclassified due to their lower level of detail. 487 The results also highlighted the foremost influence of the frontal structure, marked by a salinity 488
gradient, on the distributions of organisms along the across-front section (Figure 5). This is 489
consistent with many studies from the literature (Boucher, 1984; Goffart et al., 1995; Pedrotti 490
and Fenaux, 1992). For example, some taxa like Acantharia radiolarians, doliolids, fish larvae, 491 and, to a lesser extent, copepods were mostly observed in the coastal or frontal zones and in 492 the upper 50 m of the water column (Figures 3 and 4). Both datasets allowed us to relate the 493 abundance of various taxa to the salinity gradient, which marks the frontal region, the intensity 494
of the fluorescence of chlorophyll a associated with the DCM, or the warmer temperatures 495
found near the surface (Figure 5). Overall, 86% of the relationships with environmental variables 496
that were explored were not statistically different between the two datasets. Finally, diatom 497
chains were most abundant in the deeper layers of the central zone, where copepod 498
concentrations were the lowest (Figure 3), suggesting a possible influence of grazing. These 499
results suggest that species-environment relationships or interspecific interactions can be 500
studied at the very fine scales that imaging techniques provide without requiring labour-501 intensive validation. 502 Changes in vertical distributions between day and night, even over less than 10 m, could also be 503 detected in the predicted data for most taxa, with a power and resolution similar to that of the 504 reference dataset (Figure 6; Table 4). Diel vertical migrations of copepods and medusae are well 505 described in the literature (e.g. Hays, 2003; Sabatés et al., 2010). However, the apparent <10 m 506
vertical movements of solitary Colodaria radiolarians or the 2 m downward displacement of 507
doliolids during the day are not documented in prior studies, possibly because they were missed 508
by other sampling methods with lower vertical resolutions. The ecological significance of these 509
fine scale vertical movements is not within the scope of this study, but the fact that they could 510 be detected highlights the efficacy of both high frequency imaging systems and this automatic 511 classification and filtration method in exploring microscale processes in the plankton. 512
Nonetheless, some taxa share striking similarities and only a trained expert may be able to 513
differentiate between them. These size and shape resemblances can lead to high error rates in 514
the automatic prediction of these groups (Fernandes et al., 2009). Automatic classification 515
methods may never reach the taxonomical resolution achieved by experts observing plankton 516
through a stereomicroscope (even if both make mistakes; Culverhouse et al., 2003). Still, 517
combined with data filtering, automatic classification can accurately describe spatial 518 distributions when low taxonomical resolution is acceptable, for example to study broad groups 519 that provide an environmental or biological context for a species of interest. Eventually, manual 520 validation is likely to still be required in order to focus on some specific taxonomic group. For 521 example, fish larvae imaged here were very diverse and appeared similar to appendicularians 522 and chaetognaths in terms of body size, shape and opacity. As a result, this group was badly 523 predicted and manual methods would still be necessary to tease apart their distribution. 524
Using the proposed method, the processing of 1.5 million objects required only the manual 525
classification of 5979 objects (0.41%). It could properly describe distribution patterns, but the 526
drastic filtering process would lead to vastly underestimating the abundances of all groups. In 527
future studies, these underestimated abundances could be scaled up by quantifying, in each 528 class, the proportion of discarded and wrongly classified objects (e.g. with a confusion matrix). 529 This quantification requires to manually validate a random subset of images of each category of 530 the predicted dataset, thus requiring additional human effort. However, during validation of the 531 1.5 million in this project, the throughput of a trained operator was about 10,000 objects per 532 day. Therefore, human effort on the order of a couple of weeks would probably yield enough 533
data to correct abundances and further control the error rate for the rest of the predicted 534 images. 535 The present method is based on two features shared by all machine learning methods: the use 536 of a learning set to teach the model how to differentiate between classes and the computation 537
of a final score, or probability, for each object to belong in each class. The probability thresholds 538
for the filtering step are computed by cross-validating the learning set and do not require 539
additional manual sorting. In many cases, Random Forest, working on a few dozen features 540
deterministically measured on the object, came out as the most efficient classifier for plankton 541
data (e.g. Bell and Hopcroft, 2008; Fernandes et al., 2009; Gorsky et al., 2010). Yet, overall 542
accuracy was never more than 80%. However, deep machine learning methods such as 543
convolutional neural networks (CNNs) are emerging as promising tools for a range of image 544
classification tasks (Krizhevsky et al., 2012; Simonyan and Zisserman, 2015). Applying the 545
filtering method described here to classifiers that already achieve high accuracy on large 546
datasets may eventually lead to near-perfect automatic classifications, without discarding too 547
much information. Such a combination would allow the handling of large plankton imaging 548
datasets that are still challenging to process rapidly and accurately (Benfield et al., 2007; 549
Culverhouse et al., 2006), hence providing appropriate tools to explore the finescale and 550 microscale processes occurring in the oceans. 551
ACKNOWLEDMENTS
552 The authors thank A. Maupetit and F. Ferrando for their help with the manual identification, the 553 crew of the R/V Tethys 2 operating during the VISUFRONT cruise and CNRS/INSU for the ship 554 time. This work was supported by a grant from the Partner University Fund to JOI and RKC. RF's 555doctoral fellowship was provided by the French Ministry for Education and Research (n° 556
247/2012). 557
REFERENCES
558
Bakun, A., 2006. Fronts and eddies as key structures in the habitat of marine fish larvae : 559
opportunity , adaptive response. Sci. Mar. 105–122. 560
Belkin, I.M., 2002. Front. Interdiscip. Encycl. Mar. Sci. 561
Belkin, I.M., Cornillon, P.C., Sherman, K., 2009. Fronts in Large Marine Ecosystems. Prog. 562
Oceanogr. 81, 223–236. 563
Bell, J.L., Hopcroft, R.R., 2008. Assessment of ZooImage as a tool for the classification of 564
zooplankton. J. Plankton Res. 30, 1351–1367. 565
Benfield, M., Grosjean, P., Culverhouse, P., Irigolen, X., Sieracki, M., Lopez-Urrutia, A., Dam, H., 566
Hu, Q., Davis, C., Hanson, A., Pilskaln, C., Riseman, E., Schulz, H., Utgoff, P., Gorsky, G., 567 2007. RAPID: Research on Automated Plankton Identification. Oceanography 20, 172–187. 568 Benfield, M.C., Davis, C.S., Wiebe, P.H., Gallager, S.M., Gregory Loughj, R., Copley, N.J., 1996. 569 Video Plankton Recorder estimates of copepod, pteropod and larvacean distributions from 570
a stratified region of Georges Bank with comparative measurements from a MOCNESS 571 sampler. Deep. Res. Part II Top. Stud. Oceanogr. 43, 1925–1945. 572 Benoit-Bird, K.J., McManus, M.A., 2012. Bottom-up regulation of a pelagic community through 573 spatial aggregations. Biol. Lett. 8, 813–816. 574 Bi, H., Cook, S., Yu, H., Benfield, M.C., Houde, E.D., 2013. Deployment of an imaging system to 575 investigate fine-scale spatial distribution of early life stages of the ctenophore Mnemiopsis 576 leidyi in Chesapeake Bay. J. Plankton Res. 35, 270–280. 577
Bi, H., Guo, Z., Benfield, M.C., Fan, C., Ford, M., Shahrestani, S., Sieracki, J.M., 2015. A Semi-578 Automated Image Analysis Procedure for In Situ Plankton Imaging Systems. PLoS One 10, 579 e0127121. 580 Boucher, J., 1984. Localization of zooplankton populations in the Ligurian marine front: role of 581 ontogenic migration. Deep Sea Res. 31, 469–484. 582 Boucher, J., Ibanez, F., Prieur, L., 1987. Daily and seasonal variations in the spatial distribution of 583 zooplankton populations in relation to the physical structure in the Ligurian Sea Front. J. 584 Mar. Res. 45, 133–173. 585
Breiman, L., 2001. Random Forests. Mach. Learn. 45, 5–32. 586
Cowen, R.K., Greer, A.T., Guigand, C.M., Hare, J.A., Richardson, D.E., Walsh, H.J., 2013. 587
Evaluation of the In Situ Ichthyoplankton Imaging System (ISIIS): comparison with the 588 traditional (bongo net) sampler. Fish. Bull. 111, 1–12. 589 Cowen, R.K., Guigand, C.M., 2008. In situ ichthyoplankton imaging system (ISIIS): system design 590 and preliminary results. Limnol. Oceanogr. Methods 6, 126–132. 591 Culverhouse, P.F., Williams, R., Benfield, M., Flood, P.R., Sell, A.F., Mazzocchi, M.G., Buttino, I., 592 Sieracki, M., 2006. Automatic image analysis of plankton: Future perspectives. Mar. Ecol. 593 Prog. Ser. 312, 297–309. 594 Culverhouse, P.F., Williams, R., Reguera, B., Herry, V., González-Gil, S., 2003. Do experts make 595 mistakes? A comparison of human and machine identification of dinoflagellates. Mar. Ecol. 596 Prog. Ser. 247, 17–25. 597 Davis, C.S., Gallager, S.M., Solow, A.R., 1992. Microaggregations of oceanic plankton observed 598 by towed video microscopy. Science. 257, 230–232. 599 Davis, C.S., Hu, Q., Gallager, S.M., Tang, X., Ashjian, C.J., 2004. Real-time observation of taxa-600 specific plankton distributions: An optical sampling method. Mar. Ecol. Prog. Ser. 284, 77– 601 96. 602 Dutilleul, P., Clifford, P., Richardson, S., Hemon, D., 1993. Modifying the t Test for Assessing the 603 Correlation Between Two Spatial Processes. Biometrics 49, 305. 604 Espinasse, B., Zhou, M., Zhu, Y., Hazen, E.L., Friedlaender, A.S., Nowacek, D.P., Chu, D., Carlotti, 605
F., 2012. Austral fall-winter transition of mesozooplankton assemblages and krill 606
aggregations in an embayment west of the Antarctic Peninsula. Mar. Ecol. Prog. Ser. 452, 607
63–80. 608
Fei-Fei, L., Fergus, R., Perona, P., 2007. Learning generative visual models from few training 609
examples: An incremental bayesian approach tested on 101 object categories. Comput. Vis. 610
Image Underst. 106, 59–70. 611
Fernandes, J.A., Irigoien, X., Boyra, G., Lozano, J.A., Inza, I., 2009. Optimizing the number of 612 classes in automated zooplankton classification. J. Plankton Res. 31, 19–29. 613 Gasparini, S., Antajan, E., 2013. PLANKTON IDENTIFIER: a software for automatic recognition of 614 planktonic organisms. 615 Goffart, A., Hecq, J.-H., Prieur, L., 1995. Controle du phytoplancton du bassin Ligure par le front 616 liguro-provencal (secteur Corse). Oceanol. Acta 18, 329–342. 617 Gorsky, G., Ohman, M.D., Picheral, M., Gasparini, S., Stemmann, L., Romagnan, J.B., Cawood, A., 618 Pesant, S., García-Comas, C., Prejger, F., 2010. Digital zooplankton image analysis using the 619 ZooScan integrated system. J. Plankton Res. 32, 285–303. 620
Greer, A.T., Cowen, R.K., Guigand, C.M., Hare, J.A., 2015. Fine-scale planktonic habitat 621
partitioning at a shelf-slope front revealed by a high-resolution imaging system. J. Mar. 622 Syst. 142, 111–125. 623 Greer, A.T., Cowen, R.K., Guigand, C.M., Hare, J.A., Tang, D., 2014. The role of internal waves in 624 larval fish interactions with potential predators and prey. Prog. Oceanogr. 127, 47–61. 625 Greer, A.T., Cowen, R.K., Guigand, C.M., McManus, M.A., Sevadjian, J.C., Timmerman, A.H. V., 626
2013. Relationships between phytoplankton thin layers and the fine-scale vertical 627 distributions of two trophic levels of zooplankton. J. Plankton Res. 35, 939–956. 628 Grimes, C.B., Finucane, J.H., 1991. Spatial distribution and abundance of larval and juvenile fish, 629 chlorophyll and macrozooplankton around the Mississippi River discharge plume, and the 630 role of the plume in fish recruitment. Mar. Ecol. Prog. Ser. 75, 109–119. 631
Hays, G.C., 2003. A review of the adaptive significance and ecosystem consequences of 632
zooplankton diel vertical migrations. Hydrobiologia 503, 163–170. 633
Herman, A.W., Mitchell, M.R., Young, S.W., 1984. A continuous pump sampler for profiling 634
copepods and chlorophyll in the upper oceanic layers. Deep Sea Res. 31, 439–450. 635 Hu, Q., Davis, C., 2005. Automatic plankton image recognition with co-occurrence matrices and 636 Support Vector Machine. Mar. Ecol. Prog. Ser. 295, 21–31. 637
Irisson, J.-O., Paris, C.B., Guigand, C., Planes, S., 2010. Vertical distribution and ontogenetic 638 “migration” in coral reef fish larvae. Limnol. Oceanogr. 55, 909–919. 639 Krizhevsky, A., Sutskever, I., Hinton, G.E., 2012. ImageNet Classification with Deep Convolutional 640 Neural Networks. Adv. Neural Inf. Process. Syst. 1–9. 641
Legendre, L., Le Fèvre, J., 1991. From Individual Plankton Cells To Pelagic Marine Ecosystems 642
And To Global Biogeochemical Cycles, in: Demers, S. (Ed.), Particle Analysis in 643
Oceanography SE - 11, NATO ASI Series. Springer Berlin Heidelberg, pp. 261–300. 644
Li, Z., Member, S., Zhao, F., Liu, J., Member, S., Qiao, Y., 2014. Pairwise Nonparametric 645
Discriminant Analysis for Binary Plankton Image Recognition. IEEE J. Ocean. Eng. 39, 695– 646
701. 647
Lough, R.G., Broughton, E.A., 2007. Development of micro-scale frequency distributions of 648
plankton for inclusion in foraging models of larval fish, results from a Video Plankton 649 Recorder. J. Plankton Res. 29, 7–17. 650 Luo, J., Grassian, B., Tang, D., Irisson, J., Greer, A., Guigand, C., McClatchie, S., Cowen, R., 2014. 651 Environmental drivers of the fine-scale distribution of a gelatinous zooplankton community 652 across a mesoscale front. Mar. Ecol. Prog. Ser. 510, 129–149. 653 MacLeod, N., Benfield, M., Culverhouse, P., 2010. Time to automate identification. Nature 467, 654 154–155. 655
McClatchie, S., Cowen, R., Nieto, K., Greer, A., Luo, J.Y., Guigand, C., Demer, D., Griffith, D., 656
Rudnick, D., 2012. Resolution of fine biological structure including small narcomedusae 657
across a front in the Southern California Bight. J. Geophys. Res. 117, C04020. 658
Neilson, J.D., Perry, R.I., 1990. Diel vertical migrations of marine fishes: an obligate or facultative 659
process? Adv. Mar. Biol. 26, 115–168. 660
Olson, D.B., Hitchcock, G.L., Mariano, A.J., Ashjian, C.J., Peng, G., Nero, R.W., Podesta, G.P., 661 1994. Life on the edge: marine life and fronts. Oceanography 7, 52–60. 662 Pedrotti, M.L., Fenaux, L., 1992. Dispersal of echinoderm larvae in a geographical area marked 663 by upwelling (Ligurian Sea, NW Mediterranean). Mar. Ecol. Prog. Ser. 86, 217–227. 664 Picheral, M., Guidi, L., Stemmann, L., Karl, D., Iddaoud, G., Gorsky, G., 2010. The Underwater 665 Vision Profiler 5: An advanced instrument for high spatial resolution studies of particle size 666 spectra and zooplankton. Limnol. Oceanogr. Methods 8, 462–473. 667
Pinel-Alloul, B., 1995. Spatial heterogeneity as a multiscale characteristic of zooplankton 668 community, in: Space Partition within Aquatic Ecosystems. Springer, pp. 17–42. 669 Sabatés, A., Pagès, F., Atienza, D., Fuentes, V., Purcell, J.E., Gili, J.M., 2010. Planktonic cnidarian 670 distribution and feeding of Pelagia noctiluca in the NW Mediterranean Sea. Hydrobiologia 671 645, 153–165. 672 Sammari, C., Millot, C., Prieur, L., 1995. Aspects of the seasonal and mesoscale variabilities of 673 the Northern Current in the western Mediterranean Sea inferred from the PROLIG-2 and 674 PROS-6 experiments. Deep Sea Res. Part I Oceanogr. Res. Pap. 42, 893–917. 675 Samson, S., Hopkins, T., Remsen, A., Langebrake, L., Sutton, T., Patten, J., 2001. A system for 676 high-resolution zooplankton imaging. IEEE J. Ocean. Eng. 26, 671–676. 677
Simonyan, K., Zisserman, A., 2015. Very Deep Convolutional Networks for Large-Scale Image 678
Recoginition. Intl. Conf. Learn. Represent. 1–14. 679
Smeti, H., Pagano, M., Menkes, C., Lebourges-Dhaussy, A., Hunt, B.P., Allain, V., Rodier, M., de 680
Boissieu, F., Kestenare, E., Sammari, C., 2015. Spatial and temporal variability of 681
zooplankton off New Caledonia (Southwestern Pacific) from acoustics and net 682
measurements. J. Geophys. Res. Ocean. 120, 1–25. 683
Solow, A.R., Bollens, S.M., Beet, A., 2000. Comparing two vertical plankton distributions. Limnol. 684
Oceanogr. 45, 506–509. 685
Sosik, H.M., Olson, R.J., 2007. Automated taxonomic classification of phytoplankton sampled 686 with imaging in-flow cytometry. Limnol. Oceanogr. Methods 5, 204–216. 687 Vandromme, P., Stemmann, L., Berline, L., Gasparini, S., Mousseau, L., Prejger, F., Passafiume, 688 O., Guarini, J.-M., Gorsky, G., 2011. Inter-annual fluctuations of zooplankton communities 689
in the Bay of Villefranche-sur-mer from 1995 to 2005 (Northern Ligurian Sea, France). 690
Biogeosciences 8, 3143–3158. 691
Wiebe, P.H., Benfield, M.C., 2003. From the Hensen net toward four-dimensional biological 692
oceanography. Prog. Oceanogr. 56, 7–136. 693
Ye, L., Chang, C.Y., Hsieh, C.H., 2011. Bayesian model for semi-automated zooplankton 694
classification with predictive confidence and rapid category aggregation. Mar. Ecol. Prog. 695
Ser. 441, 185–196. 696
Zhao, F., Lin, F., Seah, H.S., 2010. Binary SIPPER plankton image classification using random 697
subspace. Neurocomputing 73, 1853–1860. 698
699