THE DYNAMICS OF NAVAL SHIPBUILDING -A SYSTEMS -APPRO-ACH
by
Timothy P. McCue
BA Physics, College of Holy Cross
Master of Science in Mechanical Engineering, SUNY Stonybrook Submitted to the Department of Ocean Engineering
in Partial Fulfillment of the Requirements for the Degrees of NAVAL ENGINEER
and
MASTER OF SCIENCE in OCEAN SYSTEMS MANAGEMENT at the
Massachusetts Institute of Technology June 1997
Q .1997 Timothy McCue. All rights reserved.
The author hereby grants MIT permission to reproduce and distribute copies of this thesis document in whole or in part.
Signature of Author
Certified by
r1'----tment of Ocean Engineering
-, May 9, 1997
S- - Professor Alan J. Brown
Thesis Sypervisor, Department of Ocean Engineering
,t _ I, /
Certified by
Senior Lecturer James Hines Th sis Supervisor, Sloan School of Management Accepted by
/ Professor J. Kim Vandiver
Chairman, Committee for Graduate Students Department of Ocean Engineering
JUL 1 5
1997
--This thesis is dedicated to the
grandfather I never knew
LCDR Eugene Patrick McCue USNR
Acknowledgments:
Many people at many different levels contributed to this work. I was able to travel all over the country collecting information and interviewing people involved with Naval Ship Acquisition and Construction. From the LPD-17 Program Manager to the production planners at NASSCO to the manager of the Hardings plant at BIW, I found everyone to be passionate about what they do. I also found everyone willing to discuss new ideas and to try to find ways to improve the process. Without these discussions, the Ship Production Model would never have been created.
I would like to thank the US Navy for the opportunity to attend MIT. The knowledge I have gained over the past three years has already proven invaluable and will be a true asset in the years ahead. I would like to thank the Navy staff at MIT for their extraordinary support. The creative atmosphere spawned by Captain Alan Brown and LCDR Mark Welsh allowed free thinking and exploration into new areas. My many discussions with each of these officers has led to a better formulation of the role of Engineering Duty Officers. Their advice and counsel is very much appreciated.
I would like to thank Professor John Sterman and Jim Hines of the System Dynamics Group at Sloan for their indoctrination into System Dynamics. I found the field fascinating and plan on continuing to use modeling in my career. Taking classes at Sloan provided a different perspective than the engineering courses in the 13A curriculum. I feel both perspectives are very important.
Specifically I would like to thank Jim Lyneis of Pugh Roberts Associates, Dave Philo at Ingalls Shipbuilding, Eric Surestedt of Bath Iron Works, Peter Jaquith and Matt Tedesco of NASSCO, Tom Rivers of NAVSEA and Phil Koenig of NSWC Carderock. All of these professionals took the time to listen to my ideas and provide valuable feedback. Their grasp of the realities of shipbuilding were critical to this work.
Finally I would like to thank my family and friends for their support during the entire time at MIT. I tried to balance school and the real world to the best of my ability. Sometimes it took a tug from one of my kids, Katlyn and Luke, to "...stop and smell the roses." Karen, as usual, kept me grounded lest I forget about what is really important. I thank her for her patience and unflagging support.
The Dynamics of Naval Shipbuilding:
A Systems Approach to Project Management Assessment
byTimothy P. McCue
Submitted to the Department of Ocean Engineering in Partial Fulfillment of the Requirements for the Degrees of
NAVAL ENGINEER and MASTER OF SCIENCE in Ocean Systems Management May 1997
Abstract:
Project management in the shipbuilding industry is a complex and misunderstood field. Ship programs are often delivered behind schedule and over budget. Many external factors can cause a relatively well run program to experience problems. These include material shortages, labor problems or customer generated design changes. Even harder for a manager to understand are internally generated problems from sources like overtime use, hiring and firing policy, and cost estimating.
Project managers do not understand or have the tools to measure many of the dynamic features of a construction process. These features include feedback, time delays and nonlinear cause and effect relationships among project components. In general, people have a hard time dealing with nonlinear relationships in their mental models of the world. When three or four of these relationships are operating at the same time, the resulting complexity becomes very hard to unravel intuitively. Experienced program managers can describe dynamics and understand they are operating on the system. They cannot quantify the strength or impact of these features on their project.
The purpose of this paper is to use System Dynamics modeling to examine the Navy Ship Acquisition and Construction process and to increase the knowledge and understanding concerning the management of large Navy shipbuilding projects. System Dynamics captures the many complex facets of ship construction simultaneously and examines their behavior over time. Using simulation, project managers in the Navy and in the private sector can make better, more quantitative decisions.
TABLE OF CONTENTS:
CHAPTER 1 11
1.1 - Introduction 11
1.2 - Motivation 15
1.3 - Outline 19
CHAPTER 2 - LITERATURE SEARCH 23
2.1 -The Affordability Crisis 23
2.11 Reference Modes 25
2.12 Definition of Terms 33
2.13 Causal Loops 37
2.2 -Acquisition Reform 45
2.21 Commercial Off The Shelf (COTS) 46
2.22 Standards and Specifications 47
2.23 The Affordability Through Commonality Program 50
2.3 -Commercial Shipbuilding Initiatives 54
2.31 MARITECH 55
2.32 National Shipbuilding Research Program 57
2.33 Mid-Term Sealift Ship technology Development Program (MTSSTDP) 59
2.34 Lean Shipbuilding Initiative 61
2.4 Build Strategy Development 66
2.41 Description 67
2.42 Components 69
2.5 Dynamic Project Modeling 72
2.51 History -Ingalls Case Study 74
2.52 Ingalls Internal Use of the Shipbuilding Model 78
2.53 Halter Marine 82
2.54 Other Systems Dynamics Models 91
2.55 Potential 99
CHAPTER 3 - Shipyard Visits 101
3.1 -Ingalls Shipbuilding, Pascagoula, MI 104
3.11 History 105
3.12 Financial Status 105
3.13 Current Navy and Commercial Work 107
3.14 Future Strategic Plan 108
3.15 Shipyard Layout 109
3.16 Human Resource Management 111
3.17 Production Planning 112
3.18 Phases of Construction 113
3.19 Performance 119
3.110 Use of Simulation 120
3.2 -Bath iron Works, Bath, ME 124
3.21 History 124
3.22 Financial Status 125
3.23 Current Navy and Commercial Work 125
3.24 Future Strategic Plan 127
3.25 Shipyard Layout 128
3.26 Human Resource Management 129
3.27 Production Planning 130
3.28 Phases of Construction 131
3.29 Performance 138
3.210 Use of Simulation 138
3.211 Summary 139
3.3 -NASSCO, San Diego, CA 141
3.31 History 141
3.32 Financial Status 142
3.33 Current Navy and Commercial Work 143
3.34 Future Strategic Plan 144
3.35 Shipyard Layout 144
3.36 Human Resource Management 146
3.37 Production Planning 147
3.38 Phases of Construction 148
3.39 Performance 150
3.310 Use of Simulation 151
3.311 Summary 153
3.4 -Newport News Shipbuilding, Newport News, VA 154
3.41 History 154
3.42 Financial Status 155
3.43 Current Navy and Commercial Work 156
3.44 Future Strategic Plan 157
3.45 Shipyard Layout 157
3.5 -Avondale Shipbuilding, New Orleans, LA 159
3.21 History 159
3.22 Financial Status 159
3.23 Current Navy and Commercial Work 160
3.24 Future Strategic Plan 160
3.25 Shipyard Layout 161
3.26 Use of Simulation 162
3.6 Summary 162
CHAPTER 4 -Ship Production Model Descriptions 164
4.1 - Model Development 166
4.11 Previous Project Models 167
4.12 Ship Production Characteristics 169
4.13 Model Features 170
4.2 Model Structure 173
4.21 Multi Phase Work Flow and Rework Sector 174
4.23 Phase Initiation and Schedule Completion 181
4.24 Financial Sector 185
4.25 Quality Effects 187
4.26 Productivity Effects 189
4.27 Shipyard Constraints 191
4.3 Base Model Run 193
4.31 Model Behavior -Base Case 194
4.4 Policy Investigation on SOCV Project 203
4.41 Effect of Quality on project Performance 203
4.42 Manning Levels 207
4.43 Overtime Policy 209
CHAPTER 5 -SOCV Case Studies - BIW VS Ingalls 214
5.1 -Ingalls vs. BIW on DDG-51 216
5.11 Key Events Schedule 216
5.12 Shipyard Suggestions 218
5.13 Qualitative Assessment 220
5.14 Performance of Bath vs. Ingalls on SOCV 222
5.2 Increase the Level of Pre-Outfitting 225
5.21 Problem Description and Reference Modes 226
5.22 Dynamic Hypothesis 228
5.23 Analysis 229
5.24 Results 230
5.3 Choke Point Analysis and Investment in Infrastructure at BIW 232
5.31 Problem Description and Reference Modes 233
5.32 Dynamic Hypothesis 233
5.33 Analysis 234
5.34 Results 234
5.4 Additional Uses of Ship Production Model 236
5.5 Summary 239
CHAPTER 6 -Conclusions 241
6.1 Implications for the Navy Acquisition Process 242
6.2 Future Work 244
6.3 Flight Simulator 245
REFERENCES: 247
Build Strategy Purpose 255
SOCV Description 255
Shipyard Selection 256
Contractual Issues, dates and Schedules 257
Production Planning 263
Master Construction Schedule and Key Events 264
Block Breaks 268
Block Assembly Sequence 271
Material Procurement 274 Construction Stages 275 Detailed Design 276 Fabrication of Products 279 On Unit Construction 281 On Block Construction 283 On Board Construction 284 Summary 286
APPENDIX B: MODEL EQUATIONS 288
TABLE OF TABLES:
TABLE 2-1 -FORCE LEVELS AND EXPENDITURES 28
TABLE 2-2 -US VS FOREIGN PRODUCTIVITY 64
TABLE 2-3 -FORD MODEL STRUCTURES 98
TABLE 3-4 -INGALLS FINANCIALS 106
TABLE 3-5 -INGALLS ORDER BOOK 107
TABLE 3-6 -INGALLS WORK PERCENTAGES AT EACH PHASE 115
TABLE 3-7 -INGALLS PHASES AND WORK START PERCENTAGES 119
TABLE 3-8 -GENERAL DYNAMICS FINANCIAL DATA 125
TABLE 3-9 -NASSCO ORDER BOOK 143
TABLE 3-10 -NASSCO STAGES OF CONSTRUCTION 150
TABLE 3-11 - NNS FINANCIAL STATUS 155
TABLE 3.12 - NNS ORDER BOOK 156
TABLE 3-13 - FINANCIAL DATA AT AVONDALE 159
TABLE 3-14 -AVONDALE ORDER BOOK 160
TABLE 3-15 -SHIPYARD STRATEGIC VARIABLES 163
TABLE 4-16 -COST PERCENTAGE BY PHASE 195
TABLE 5-17 -BIW AND INGALLS PARAMETERS 223
TABLE 5-18 -PREOUTFITTING LEVELS 229
TABLE A-19 -SOCV CHARACTERISTICS 256
TABLE A-20 -POSSIBLE SOCV SHIPYARDS 257
TABLE A-21 -PAYMENT SHCEDULE 259
TABLE A-22 -MASTER CONSTRUCTION SCHEDULE 265
TABLE A-23 -FOLLOW ON SHIP SCHEDULE 267
TABLE A-24 -ZONAL BLOCK NUMBERING SEQUENCE 270
TABLE A-25 -LONG LEAD TIME MATERIALS AND PROCUREMENT SCHEDULE 275
TABLE OF FIGURES:
FIGURE 1-1 -A-12 COST AND SCHEDULE PERFORMANCE 18
FIGURE 2-2 -COST OF SURFACE COMBATANTS IN $K (FY90)/TON 26
FIGURE 2-3 -SIZE OF US NAVY 29
FIGURE 2-4 -DOMESTIC SHIPBUILDING MARKET 30
FIGURE 2-5 -SHIPBUILDING TRENDS 32
FIGURE 2-6 -ARMS RACE DYNAMIC 38
FIGURE 2-7 -MILITARY INDUSTRIAL BASE 40
FIGURE 2-8 -COMMERCIAL INDUSTRIAL BASE 42
FIGURE 2-9 -FLOW OF WORK ACCOMPLISHMENT 94
FIGURE 2-10 -FORD MAJOR SECTIONS 98
FIGURE 3-11 -INGALLS SHIPYARD LAYOUT 110
FIGURE 3-12 - INGALLS MATERIAL FLOW 115
FIGURE 3-13 -BATH YARD LAYOUT 130
FIGURE 3-14 -BIW BLOCK FLOW 133
FIGURE 3-15 -NASSCO YARD LAYOUT 147
FIGURE 3-16 - NEWPORT NEWS SHIPBUILDING 159
FIGURE 3-17 -AVONDALE SHIPYARD LAYOUT 162
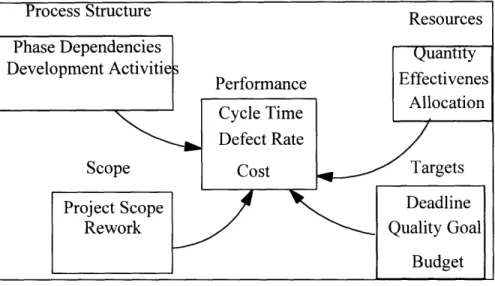
FIGURE 3-18 - MODEL BOUNDARIES 173
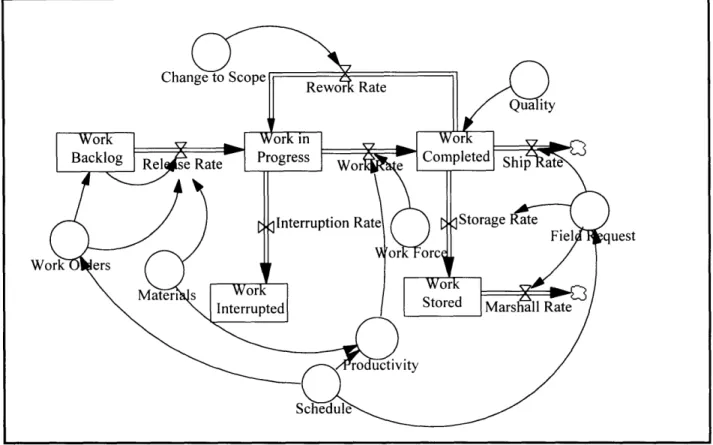
FIGURE 4-19 -WORK ACCOMPLISHMENT SECTOR 176
FIGURE 4-20 -LABOR DETERMINATION 180
FIGURE 4-21 -SCHEDULE SECTOR 184
FIGURE 4-22 -FINANCIAL SECTOR 188
FIGURE 4-23 - EFFECTS ON QUALITY 190
FIGURE 4-24 -EFFECTS ON PRODUCTIVITY 192
FIGURE 4-25 -CONSTRAINTS TO PRODUCTION 194
FIGURE 4-26 -BASE RUN COSTS 196
FIGURE 4-27 -BASE RUN PHASE COSTS 197
FIGURE 4-28 -BASE RUN WORK QUALITY BY PHASE 198
FIGURE 4-29 - BASE UNDISCOVERED REWORK 199
FIGURE 4-30 -BASE CASE LABOR BY PHASE 200
FIGURE 4-31 -PRODUCTIVITY BY PHASE 201
FIGURE 4-32 -FACTORS EFFECTING PRODUCTIVITY 202
FIGURE 4-33 -EFFECTS ON FABRICATION PRODUCTIVITY 203
FIGURE 4-34 -EFFECT OF QUALITY ON COST 208
FIGURE 4-35 - MAXIMUM PROJECT LABOR 210
FIGURE 4-36 -COST OF VARYING OVERTIME 212
FIGURE 4-37 -EFFECT ON PRODUCTIVITY OF OVERTIME 213
FIGURE 5-38 -INGALLS VS BATH ON SOCV 226
FIGURE 5-39 -PRODUCTIVITY AT BIW ON SOCV 227
FIGURE 5-40 -LEVEL OF PREOUTFITTING 230
FIGURE 5-41 -EFFECT OF HIGHER PREOUTFITTING 232
FIGURE 5-42 -BIW B&P COMPARE 237
FIGURE A-43 -SHIP CONSTRUCTION PROCESS 256
FIGURE A-44 -TYPICAL HULL PLANNING FUNCTIONS 265
FIGURE A-45 -CLAW CHART 273
Chapter 1
1.1 - Introduction:
The Naval shipbuilding industry is a complex and misunderstood field. Projects are typically behind schedule and over budget. Many external factors can cause a relatively well run program to experience problems. These include material shortages, labor problems or customer generated design changes. Even harder for a manager to understand are internally generated problems from sources like overtime use, hiring and firing policy, and cost estimating. Project managers do not understand or have the tools to measure many of the dynamic features of a construction process. These features include feedback, time delays and nonlinear cause and effect relationships among project components.' In general, people have a hard time dealing with nonlinear relationships in their mental models of the world. When three or four of these relationships are operating
at the same time, the resulting complexity becomes very hard to unravel intuitively. Experienced program managers can describe dynamics and understand they are operating on the system. They cannot quantify the strength or impact of these features on their project.
The nature of the product also adds to the project's complexity. A ship is built from a multitude of small manufactured parts that are assembled into larger parts and finally fit together as construction blocks. If the small assemblies are not built to proper
'Ford, D. N., (1995), The Dynamics of Project Management: An Investigation of the Impacts of Project Process and Coordination on Performance. Ph.D. Thesis. Sloan School of Management. Massachusetts Institute of Technology. Cambridge, MA.
tolerances, errors compound downstream to cause rework or out of sequence work. The precedence relationships of one phase of the project on another can lead to large delay and disruption penalties. If an error occurs in the design of the ship, it may not be discovered until many of the small assembles have been manufactured. If the required design change is large enough, many of the smaller assemblies may be rendered obsolete. The results of such behavior include huge cost over runs, schedule slippage and poor customer relations.
Much work is ongoing to better define the product with 3-D product models. All new Navy ship programs require an electronic version of the ship that can be transferred from the government to the shipyard and back. Not much has been done in modeling and simulating the process by which ships are built. The real improvements that can be made in reducing the costs of Navy ships will come through proces improvement, not through product optimization. By taking into account necessary process changes in product design, significant improvements in productivity can be realized.
The market for America's shipbuilders has gone from bad to worse in the last few years. Foreign competition has eroded the commercial industrial base. The US Navy is in a period of consolidation, limiting the amount of available government shipbuilding contracts. The lack of new work has made project management even more critical to ship builders. Problems with an existing project could cause the loss of future work with a valuable customer. Many major shipbuilders are experimenting to find new ways to improve the process in order to compete at home and abroad. The ship construction cycle
can take five to fifteen years. The process starts with initial concept design and ends with delivery to the customer. Cycle time reductions are critical in order to deliver a ship that meets an existing market or threat.
Much time and effort has been expended trying to revitalize the ship building industry in this country. A strong ship building industry allows the Navy to take advantage of state of the art commercial practices. The best practices of a market leader will result in reduced costs for Navy ships. Without a strong commercial base, the Navy must shoulder the cost and risk of developing any new technology. This is an expensive proposition. Perhaps the time has come to take a fresh look at the shipbuilding process.
Business as usual clearly is not working.
The purpose of this paper is to use System Dynamics modeling to examine the Navy Ship Acquisition and Construction process and to increase the knowledge and understanding concerning the performance of large Navy shipbuilding projects. A glossary of terms is included in Appendix C to decipher the acronyms and unique terminology of shipbuilding. Likewise, System Dynamics is used to capture the many complex inter-relationships of ship construction simultaneously and examines their behavior over time. Jay Forrester developed the field in the early sixties to study complex social systems. System Dynamics has expanded in recent years to study product development processes in the software and automobile industries. Shipbuilding consists of large, complex, capital intense projects. Shipbuilders consider prototyping too expensive. Because of this, shipbuilding is a natural field for use of simulation.
Any large scale construction project demonstrates the following characteristics: * Extremely complex, consisting of multiple interdependent components * Highly dynamic
* Involve multiple feedback processes * Involve nonlinear relationships * Utilize "hard" and "soft" data2
All of these factors complicate the management of these projects. Shipbuilding has been the focus of several earlier System Dynamics studies. The most widely known cases involve litigation against the government. Potential exists for wider use of simulation in this field. Some proposed uses include:
* Contract Bid Analysis * Productivity Improvements * Optimal Manning Analysis * Build vs. Buy Studies * Policy Assessment
* Design Change Assessment and Management * Cost Estimation
In this paper, computer simulation is used to investigate some of the management policies and constraints found in a shipyard. By combining these management policies,
2 Sterman, J.D., (1992), "System Dynamics Modeling for Project Management," unpublished working paper, Systems Dynamics Group. Sloan School of Management. Massachusetts Institute of Technology.
shipyard constraints and the products characteristics in one model, the cumulative effect of all decisions a shipbuilder makes concerning a ship program can be examined. A computer model requires the user to define boundaries and make assumptions concerning the level of aggregation. The definition of boundaries narrows the scope of the model and makes clear to the user the purpose and limits of the model.
1.2 Motivation
The US Navy manages some of the most complex and expensive projects in the country. The weapon systems, ships and aircraft produced in these projects are the most capable in the world. Problems inevitably arise in managing these high risk programs that produce cutting edge, state of the art hardware. Operating with risk is better understood in the commercial sector. Investing in new technology is a risky proposition and must be managed accordingly. Many innovators never take their product to market.3 The inventor who introduces a
new technology is often overtaken and forced out of business by a later entry competitor. Sometimes it is easier to let the competition develop a new risky technology. Once a dominant design is established the risks involved decrease. Small improvements in the product and the manufacturing process provide a competitive advantage. In this way, one could develop a competitive product without being exposed to large risks.
3 Utterback, J.M., (1994), Mastering the Dynamics of Innovation, Harvard Business School Press, Boston, MA.
This is not an option for the US Navy. The United States has long relied on a commitment to using the latest technology in our military hardware as a tactical advantage. Allowing the enemy to take the lead in developing new weapon systems could have dire consequences for the Navy. Experiences in the Gulf War indicate that technology can be effectively used as a force multiplier.
The Department of Defense has had significant problems integrating new technology into existing product lines in an expeditious and affordable manner. Technology integration has become even more critical in the last few years with the rapid development of information systems, computational capability, and global inter-connectivity. To maintain our technological advantage we must do things smarter, cheaper, and faster than the enemy.
Computer hardware frequently becomes obsolete in less than 5 years. This forces a similar reduction in military product development times. Current cycle times for Navy ships from concept design to final delivery may take as long as fifteen years. During this period of time the entire world may have changed. Just such a scenario occurred with the Seawolf class submarine. The Seawolf was designed at the height of the Cold War to be the most capable attack submarine in the world. Its primary mission was to attack Russian submarines. In the time it took to design and build the Seawolf, the Russian Navy virtually collapsed. The threat the Seawolf was built to meet no longer exists. This left the Navy with a very capable, and expensive, ship with no legitimate adversary. Most of the class
was canceled as a result. Cycle time reductions are a critical improvement the Navy must make in order to match hardware with current requirements.
For the military, failing to utilize a critical technology could mean the difference between winning the next battle and not coming home! For the private sector, the situation is very similar. Missing a jump in technology could mean loss of market share and could drive the company to bankruptcy. The stakes in both cases are very high. A recent study conducted to benchmark product development projects around the world indicates that less than fifty percent meet their targets for cost and schedule.4 Clearly something is acting to mislead planners and managers as to the real cost and schedule needed to develop new products.
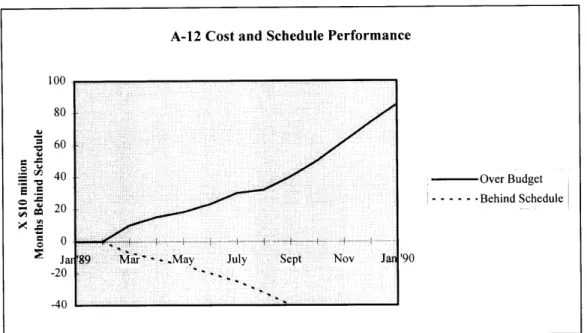
The latest and most expensive case of mismanagement of a military program is the new attack aircraft designated the A-12. Although many people involved with this program were aware of serious problems with weight and schedule, the project was allowed to continue. The performance for cost and schedule demonstrates exponential behavior as can be see in Figure 1-1.
A-12 Cost and Schedule Performance
Figure 1-1 A-12 Cost and Schedule Performance
The managers of this program chose to quibble about specific ceilings and scheduled dates instead of looking at the behavior of the project. Clearly, the project was out of control early in 1989 when overruns reached $100 million dollars. By March of 1990, it was estimated to be more than $1 billion dollars over budget and 1 year behind schedule. The contractor team of General Dynamics and MacDonald Douglas, the Navy management team, and the Congressional Oversight Group all were using different models to predict program performance. The program was eventually canceled resulting in a huge loss of taxpayer's dollars, new capability for the Navy's attack aircraft component and million of dollars in revenues for the contractor team. The law suit as to who is responsible for the brunt of the losses is still in litigation.
5 Beach, C.B., (1990) "A-12 Administrative Inquiry", Memorandum for the Secretary of the Navy. o U E .5 0, - Over Budget --- - - -Behind Schedule V
Why, with the stakes so high and the talent available, do these problems occur? What are the underlying causes for the cost and schedule overruns experienced in large military development projects? Why are cost and schedule estimating tools so bad at predicting what would really happen given a set of conditions? Are there policies that can be used to address dynamic sets of circumstances which result in better project performance? These are all questions that will be addressed in this work.
1.3 Outline
A literature search is conducted to determine the current state of the Navy ship acquisition process. The affordability crisis the Navy is currently experiencing in acquiring the new ships it needs is examined. Hypotheses on how to improve the process will be generated and discussed for applicability.
Several current acquisition reform measures instituted by the Department of Defense aimed at improving the process including Affordability Through Commonality (ATC) and Commercial Off The Shelf (COTS) will be reviewed for their impact on the crisis.
The National Shipbuilding Research Program (NSRP) is one of several projects which study ways to improve the competitiveness of US shipyards. Part of the NSRP approach is to encourage the development of a Build Strategy for
each yard. A Build Strategy consists of all of the important decisions a builder and a customer must make in order to build a ship. If the Build Strategy is well thought out, the program has a better chance of success. Build Strategy development is discussed and a plan is formulated for a high performance commercial ship. Key events are identified. Block breaks and construction sequence are discussed. The different stages through which the parts that make up the ship are discussed.
A series of shipyard visits is conducted to observe US Navy ship building in commercial yards. The different sequences used for building ships and the critical features of managing these projects are discussed. Several hard to quantify variables like quality, productivity, and rework are discussed with shipbuilders. The shipyards include:
* Avondale Industries, New Orleans, LA * Bath Iron Works, Bath, ME
* Ingalls Shipbuilding, Pascagoula, MI * NASSCO, San Diego, CA
In many cases the perspective of a program manager is formed by the tools used to measure performance. Without robust tools that can capture the important factors of a project, a manager will be operating with an incomplete picture. Current tools used to manage Navy projects and develop cost estimates are
discussed. The advantages and disadvantages of the current tools are reviewed. One management field that has received little attention from the Navy is System Dynamics. Dynamic models have been used in the past by contractors to describe the shipbuilding process in support of delay and disruption claims against the government. Although System Dynamics was used successfully by shipbuilders to demonstrate their case, the Navy chose not to develop any of their own models.
A dynamic model, the Ship Production Model, is developed and examined in detail to determine it's applicability to Navy ship construction. The observations and data collected during the shipyard visits are used to develop the structure and policies found in the model. The model's purpose and boundaries are discussed. The structure of the dynamic sectors of the model are examined in detail.
The Ship Production Model is used to determine the best way to build a new ship in a virtual shipyard. Several policies are examined including: quality, use of overtime, and required manning levels. Analysis is conducted to determine the choke point in the process. Infrastructure is added to determine its impact on the performance of the project.
The model is tuned to exhibit the features of existing shipyards. A comparisons of two shipyards is conducted on a high performance commercial ship program. Schedule and cost performance are evaluated. Several ways to improve the productivity of each yard are discussed.
Finally, the implications for future use of Systems Dynamics in Navy program management are discussed. Dynamic models become the reservoir of much information about the system. The real value of the model is the chance to examine policies in detail rapidly and without risk to the program. The models become valuable communications tools that can be used to find common ground between the government and the contractor on difficult issues. Models could be used as early as the concept design stage to make clear the goals and objectives of all interested parties. By providing a tool to practice the management of a large project, problems like those experienced on the A-12 can be avoided.
Chapter 2 - Literature Search
In this chapter, a review of the literature is conducted to determine the current state of the Navy ship construction process. The cost of buying Navy ships has increased steadily in the past 20 years. The dynamics behind this increase will be investigated using causal loops. Several initiatives that attempt to remediate this problem will be investigated including acquisition reform, revitalizing the commercial industrial base, and build strategy development. Possible solutions to this Affordability Crisis are discussed. These include Lean Shipbuilding. Finally, the use of System Dynamics modeling is discussed as a way to better understand the complexities of shipbuilding and to examine the true impact of some of the reform measures.
2.1 The Affordability Crisis
The Navy is currently experiencing a crisis in which it can no longer afford the ships it requires. Several acquisition reform programs including Affordability Through Commonality (ATC), Commercial Off The Shelf (COTS), and Standards and Specification Reform have been developed to address this crisis. These are described in detail in the next section. Some of these programs may have a real impact on the cost of future ships. Others are merely first aid to correct a small but visible problem.
Several programs have also been instituted to try to revitalize commercial shipbuilding in this country. These include the MARITECH Program, National Shipbuilding and Research Program (NSRP), and Mid-Term Sealift Ship Technology
Development Program (MTSSTDP). These efforts study why the commercial shipbuilding industrial base has eroded since 1980 and attempt to find corrective measures. They also try to show US shipbuilders how they can become world class manufacturers. Foreign shipbuilders can produce ships faster and cheaper than their American counterparts. Without throughput to improve shipbuilding methods and productivity, American yards will continue to lag behind foreign yards when competing for commercial contracts. Either more Navy work needs to be generated or commercial work needs to be stimulated in some way.
It is critical to understand the true nature of the Affordability Crisis before attempting to repair it. In some cases, two acquisition reform programs are in conflict with each other. Although each measure sounds like a good idea on paper, each must be tested for applicability in real life amidst the complexities of the process. The dynamic, non-linear nature of the ship construction and acquisition process is difficult to grasp. Because of this, some solutions address one part of the crisis while ignoring the big picture. Applying solutions that do not take into account the entire problem may have a detrimental effect instead of the desired positive effect. Causal loop diagrams are used to try to capture some of the dynamic behavior that is described but not explicitly defined by other authors. Many articles discuss pieces of the crisis but few capture the whole picture. Without a broader perspective, true acquisition reform is not possible.
2.11 Reference Modes
The process used to develop a System Dynamics model involves: * Reference Mode Identification
* Dynamic Hypothesis * Modeling
* Analysis
These steps force the modeler to fully examine the system of interest. In many cases, valuable insight can be gained during each step in the process.6 For the Affordability Crisis, the first two steps in the modeling effort will be conducted. To fully model and analyze the Affordability Crisis is beyond the scope of this work.
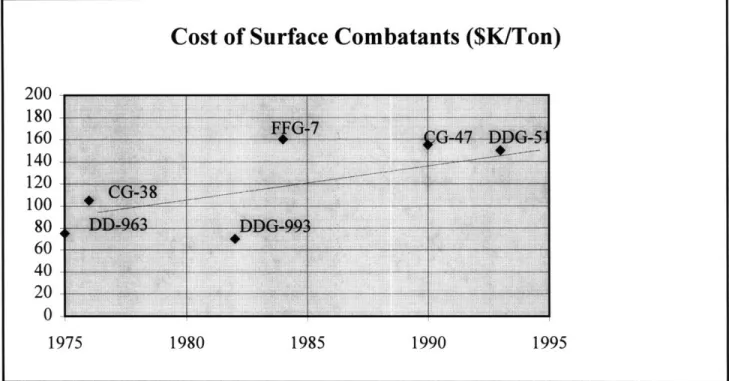
The first way to examine this problem is to look at historical data on a set of axes. From these plots, trends can be observed concerning the nature of the problem. These trends describe behavior of the important variables in the problem. The behavior will indicate whether a variable represents a problem or not. Is the variable exhibiting linear behavior or does it exhibit exponential behavior? Does the growth decay slowly to an upper limit or does it continue to infinity? Is the behavior cyclical? Much insight can be gained by examining the reference modes of a problem in this fashion. The first reference mode for the Affordability Crisis is demonstrated in Figure 2-2.
6 Hines, J.H. and Johnson, D.W., (1994), Launching System Dynamics, International System Dynamics Conference.
Cost of Surface Combatants ($K/Ton)
20U 180 160 140 120 100 80 60 40 20 0 1975 1980 1985 1990 1995Figure 2-2 -Cost of Surface Combatant Ships in $K (FY 90)/TON
The total acquisition cost in constant dollars of Navy surface combatant ships per ton is steadily increasing with time. The behavior associated with this trend is linearly increasing. These costs are the result of several inter-related dynamics.
First, more military capability is required to counter the threat of faster, deadlier, and more widely distributed advanced weapons systems. The military tends to incorporate new technology to a greater extent and is willing to assume more risk than commercial product development groups. To remain the technological leader of military hardware in the world, the Navy must pay "innovator" costs. In the commercial world, this role is called an industry leader. This position has its advantages and disadvantages. Being first to market allows you to grab market share from the competition if the new
product is superior. However, once a product has been brought to market, the competition has the luxury of reverse engineering to determine what went into the development effort. Sometimes it may be more cost efficient to follow the market leader with a similar product if the development effort is risky. Thus far the US military has committed itself to remaining an industry leader. The costs associated with this strategy must be understood and dealt with accordingly. This behavior will be described as the
Arms Race dynamic.
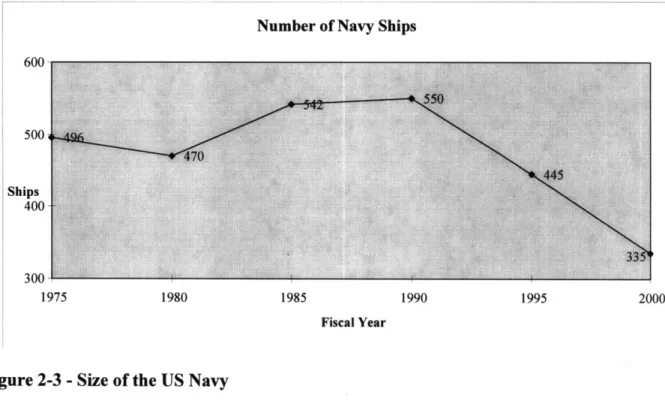
Second, the decrease in Navy ship end strength numbers reduces new ship construction contracts. After a peak in 1990, the trend has been sharply downward. Several projections have been made concerning the future size of the Navy including the Surface Combatant Force Level Study and the Bottoms Up Review. Based on these studies, current national directives call for a force of between 325 and 350 ships for the foreseeable future. The current defense budget spending does not even support this level. As the worldwide threat changes, these levels will be adjusted accordingly.
The portion of the defense budget allocated to ship construction is around $5
billion dollars per year. To support the current force levels at current costs, the required expenditures to maintain a 325 ship Navy is $7.4 billion dollars as indicated in Table 2-1.
Ship Type #/year Service Life Force Level $B/year
CG/DD
3
30
90
2.7
CV
0.2
50
10
0.9
A
1
30
30
0.5
SSN
1
30
30
1.5
SSBN
0.5
30
15
1
AMPHIBS
2
25
50
0.8
Totals
225
7.4
Number of Navy Ships 600 500 Ships 400 300 1975 1980 1985 1990 1995 Fiscal Year
Figure 2-3 -Size of the US Navy
Third, the Navy's support infrastructure is harder to downsize than number of ships. This results in higher cost of support infrastructure until adjustments can be made through the Base Realignment and Closure program (BRAC). This dynamic will also be discussed in Military Industrial Base.
2000 With fewer ships being built, volume discounts associated with long production runs are
not achieved. The unit cost of doing business increases since there is less business over which to spread overhead costs. This behavior will be further discussed in the Military Industrial Base diagram. Figure 2-3shows the trend for the number of ships on active duty in the Navy.
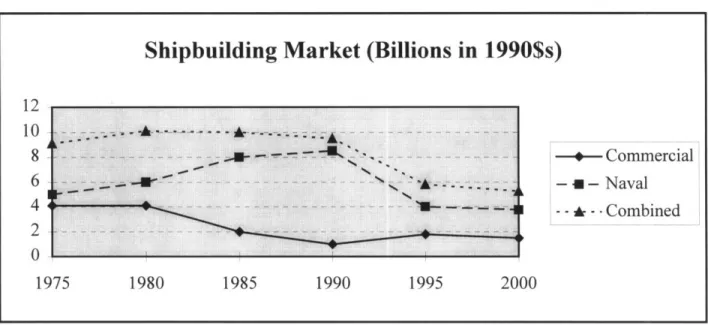
The commercial shipbuilding industry in the United States has been in decline for some time. The reference mode for this is demonstrated in Figure 2-4.
Shipbuilding Market (Billions in 1990$s)
1'b 8 .-10 .--- I* - ---- ----
---6
---6 . . - ... .e * .-•: - A - -:.- - . ._ _ _ :. . 4 . "... 2 --- ---- . - - - ---- -2 -,- Commercial -
u
- Naval I - - - Combined 1975 1980 1985 1990 1995 2000Figure 2-4 -Domestic Shipbuilding Market
This trend was obscured during the push for a 600 ship Navy in the military buildup of the 1980's. The Japanese and the Koreans continue to capture most of the market share of new construction commercial shipping. If the Navy is to ever realize lower costs for their ships, the domestic shipbuilders will need to update their
shipbuilding methods to the level of the competition. If US yards could capture a reasonable portion of the commercial market, valuable experience could be gained in modem production methods. The modern techniques used by world class shipyards would result in decreasing the cost of producing Navy ships.
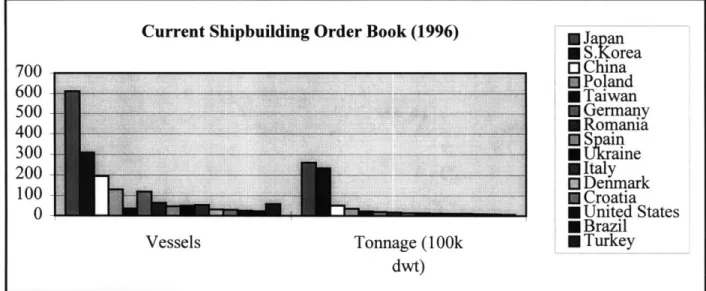
With the paltry share of the market enjoyed by American Shipyards, currently 1.2 %, the required improvements in shipbuilding technology will not occur without
government subsidies. No commercial base exists to provide the economies of scale necessary to stimulate improvement. In the automotive and aerospace industries, great strides have been made to improve American competitiveness on a global basis. Without a healthy commercial industrial base, shipbuilding in this country will never become world class. It is quite apparent by examining the order book of American shipyards today in Figure 2-5 that we are not competetive.7
Vessels Tonnage (100k Japan SS.Korea
o
China E Polandm
Taiwan m Germany SRomanla _ Spain . Ukraine * Italy 1 Denmark * Croatia M United States m Brazil m Turkey dwt)Figure 2-5 -Shipbuilding Trends
If the commercial base continues in its present state of decline, the Navy will be faced with a monopsony in which only one customer exists in a given market. DOD acquisition regulations require competitively bid contracts. With the few number of new ships currently being built and more importantly, the meager amount of ships planned for the next 20 years, private shipyards may not have the work to stay in business. In order to maintain the industrial base, the Navy has been forced to pay an exorbitant amount for each new ship. This behavior is defined further in the Commercial Industrial Base diagram.
Finally, the level of uncertainty in the basic national objectives adds to cost of doing business. The proliferation of advanced technologies make staying ahead of the game a very expensive proposition. During the Cold War, the huge expenditures needed to maintain our technological edge were justified as a national priority. In the post Cold War era, the threats to our interests are not as well defined. Without a clear threat, the
Current Shipbuilding Order Book (1996)
/UU 600 500 400 300 200 100 0 1 I- - - - ~----`
justification for new expenditures is not as apparent. For this reason, specialized ships that are built to counter specific threats look less attractive. "Future uncertainties establish an increased value and need for flexibility on operational usage."8 This changes the emphasis for ship designers. To deal with uncertainty, they need to design in flexibility or margin for future upgrades. Instead of optimizing the ship for a specific mission, the design margin allows for growth or new weapons packages in the future.
2.12 Definition of Terms
The next step in examining the problem is to define the important variables associated with Navy ship construction and acquisition. Once the variables are identified, they can be grouped by their relation to each other. A brief description of how they change over time is included. These variables involved with the Affordability Crisis were gleaned from literature and interviews with shipbuilders and Navy program managers.
Arms Race Dynamic
Advanced Weapons Proliferation - The rate at which high tech weapons spread to other nations. Today's world is characterized by little if no real threat to US Interests. For this reason, the leading arms exporter in the world has become the United States. The rate at which advanced weapons proliferates to the Third World is faster than ever before.
Actual Threat -Advanced weapons in the hands of countries or individuals at political or economic odds with the objective of the United States.
8
Bosworth, M. L.and Hough, J. J. (1993). Improvements in Ship Affordability. The Society of Naval Architects and Marine Engineers Centennial Meeting.
Perceived Threat - Based on intelligence sources. Currently perceived to be low. The perceived threat drives the commitment of funds to the military. If the perceived threat is low, fewer dollars allocated to the military. The problem with the Perceived Threat is that it takes time to formulate. It is also subject to the biases of the analyst. Several times in recent history, the United States has found itself caught looking the other way because the Perceived Threat was wrong.
Required Military Capability of US Ships - The number of ships, aircraft and missiles needed to carry out the missions tasked by higher authority. Current tasking calls for the ability to fight two Major Regional Conflicts simultaneously. As force levels drop, this requirement may need to be revised.
Cost of Navy Ships - The acquisition cost of Navy ships. The material, labor, and shipyard overhead costs that make up the purchase price of a Navy ship.
Pressure for Reciprocating Capability - The pressure for countries at odds with US objectives to match the technology and weapons of the US
Military Industrial Base
Navy Order Book - The amount of work the shipyards have on order generated by the Navy. Consists of new construction, conversion or maintenance. In the eighties the total Navy Order Book came close to twenty billion dollars a year.9 In the leaner times of the
nineties, the Order Book is more like six or seven billion dollars.
Need for New Ships - There are several things that drive the need for new ships. First, older ships need to be replaced as they reach the end of their service lives. New ships may also be needed to meet a new threat. This was the case of the Mine Hunters built in the early nineties. Finally, in time of war, ships need to be built to replace damaged or lost ships. The current need for new ships is low. More ships will leave the Navy this year than will be commissioned.
Defense Budget - The amount of money committed each year to supporting the military. Part of this is committed to Ship Construction, Navy (SCN), the portion that goes to building new ships. Current defense spending is lower than it has been since the seventies.
Required Military Capability -The ability to carry out the objectives of higher authority against a given threat. As the enemy capability rises, the Required Military Capability Rises as well.
Capability Gap -The gap between the existing capability of the Navy and the capability required to achieve the objectives outlined by higher authority.
US Shipyard Overhead Rate - The rate charged to a ship contract that covers the infrastructure and management costs of the shipyard. If the yard has very little work, these charges have to be absorbed over a smaller revenue base. This drives the overhead charges up for any one contract.
Commercial Industrial Base
Foreign Productivity - The ability of foreign yards to produce ships measured in tons/person/year. The productivity of foreign shipbuilders, in particular the Japanese, is
considerably higher than typical US workers on similar projects. The reasons for this difference will be discussed in a later section.
US Productivity - The ability of American shipbuilders to produce ships measured in tons/person/year.
Foreign Order Book - The amount of work, measured in dollars, that a shipyard has under contract. A large order book means the future will remain stable. It allows investments in personnel, infrastructure and process improvements.
US Commercial Order Book -The amount of work American yards have under contract. Foreign Construction Costs - The total acquisition cost to the ship buyer in a foreign yard.
US Construction Costs - The total acquisition cost to the ship buyer in a domestic yard. The cost of buying ships in this country has grown to almost double what a similar ship would cost overseas.
Foreign Subsidies - Many foreign countries offer construction subsidies to shipyards. This acts to reduce the cost to the shipowner of buying a ship in that country. Stimulating heavy industry in these countries is a national priority.
US Subsidies - In 1980, the United States government eliminated the Construction Differential Subsidy (CDS) which was designed to keep American shipyards competitive in the world shipbuilding market. The commercial shipbuilding base has been in decline since this time. Under the Clinton Administrations National Shipbuilding Initiative (NSI), other forms of subsidies have been explored. These include NSRP studies, MARITECH funding for new ship designs, and Title XI financing and guaranteed loans
for new ships and for investments in infrastructure to try to make the US shipyards more competitive.
2.13 Causal Loops
The final step is to build causal loops that link the variables. In this way the relationships between the variables can be shown. A polarity is assigned to the arrows that connect the variables. If the polarity is positive, the two variables behave in the same way. If the polarity is negative, the two variables act reciprocally. If one increases, the other decreases. The loops created can be either balancing or reinforcing loops. These are designated by either a balancing scale or a snow ball rolling down hill respectively. Three separate dynamic relationships act to increase the cost of Navy ships. Determining the strength of these loops will require more research. Understanding that more than one force is acting at any time is critical to solving the problem.
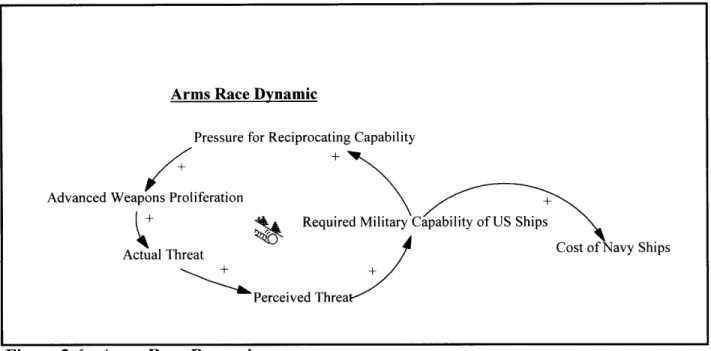
The first loop modeled is the Arms Race Dynamic depicted in Figure 2-6. The Actual Threat of armed conflict in the world positively affects the Perceived Threat with a time delay. The Perceived Threat is a combination of intelligence and strategic national objectives. Based on this Perceived Threat, the Required Military Capability of US Ships to meet the threat is developed. This capability consists of a combination of platforms which can carry out various missions. The actual capabilities required are better defined if the perceived threat is well understood. If the perceived threat is not as well defined, the platforms that are used to meet this threat need to have multi-mission capabilities or be reconfigurable. As the Perceived Threat increases, the Required
Military Capability of US Ships also increases. As more capability is required, the level of technology needed to respond tends to increase with a subsequent increase in cost.
Figure 2-6 -Arms Race Dynamic
The dynamic part of the arms race is that as the current capability of US Ships increases, the level of technology needed to match this capability increases. Pressure for Reciprocating Capability is placed on other world powers to match this new capability with a time delay. This pressure tends to increase the rate of Advanced Weapons Proliferation. In turn, weapons proliferation increases the Actual Threat to US objectives. This completes a reinforcing feedback loop that has been the topic of much discussion since the beginning of warfare. The Arms Race Dynamic has been the cause of many wars including World War I and has resulted in the expenditure of countless dollars.
Defusing this reinforcing feedback loop has proven to be a huge challenge.
Arms Race Dynamic
Pressure for Reciprocating Capability
Advanced Weapons Proliferation
it Require
A + IT t' + Ships
Perceived Threaa
Perceived Threaeý
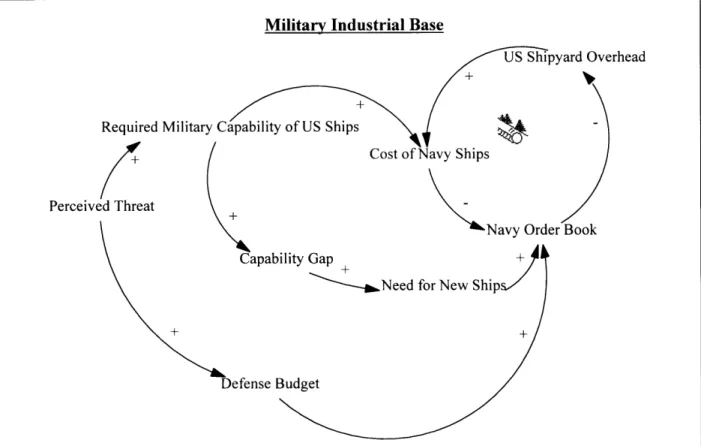
The next loop, the Military Industrial Base Dynamic shown in Figure 2-7, deals with the decreasing level of the US fleet and the subsequent loss of business for US Shipbuilders. The Perceived Threat directly affects the amount of money allotted to the Defense Budget. It also affects the Required Military Capability of US Ships. As was seen directly after the Persian Gulf War, without a legitimate threat, the Congress looks to reduce the money expended on the military. The funding for additional defense spending usually evaporates long before the Required Military Capability of US Ships is adjusted. The problem is that these Defense Budget cuts are based on the Perceived Threat, not the Actual Threat. If deep cuts in capability are made too rapidly, it is impossible to regenerate this capability in a timely fashion should the Perceived Threat change. In some cases, contractors who make products exclusively for the military are forced out of business.
As the Perceived Threat decreases, the amount of money dedicated to the Defense Budget decreases. The Navy Order Book for new construction and for service life extensions is correspondingly reduced. As the amount of work the Navy orders from the shipyards decreases, the US Shipyard Overhead increases. Overhead is the amount of money that is charged to a contract to cover the costs of shipyard infrastructure. As the work decreases, the overhead is spread out over fewer projects thus increasing the cost of each contract. As the US Shipyard Overhead increases, the Cost of Navy Ships also increases. As the Cost of Navy Ships increases, the number of ships the Navy can buy for the allocated money decreases. This, in turn reduces the Navy Order Book resulting in another reinforcing feedback loop.
Military Industrial Base
Figure 2-7 -Military Industrial Base
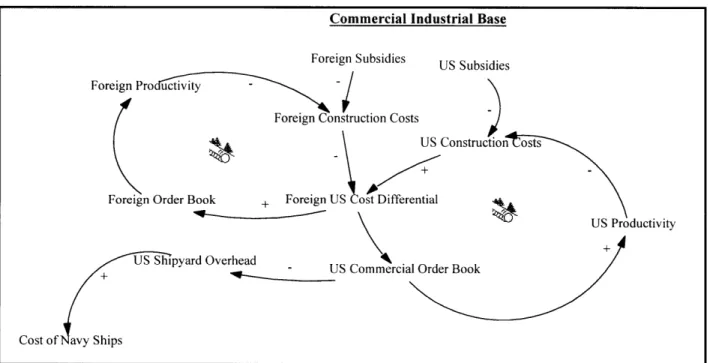
The final loop, shown in Figure 2-8 deals with a problem that has been developing in this country since 1980, the Commercial Shipbuilding Industrial Base. When the US government decided to cut the Construction Differential Subsidy (CDS), US Shipbuilders could no longer compete with their overseas competition for commercial ship contracts. Looking at the diagram, as US Subsidies decrease, US Construction Costs increase. This tends to increase the cost differential between US and Foreign Construction Costs. As the cost differential increases, the US Commercial Order Book decreases and the Foreign Order Book increases. As the Commercial Order Book decreases, the US Shipyard Overhead rate increases resulting in higher costs for Navy ships. The distressing part of this diagram is that as the US Commercial Order Book decreases, US Productivity also
Required Militar
Perceive eat
Perceived Threat
K
/I
•Navy Order Book
.b
y
decreases. The ability to keep up with state of the art shipbuilding practices requires work on which to learn these skills.
A quick look at the reference modes indicates the US Commercial Order Book has been practically non existent for the last 15 years. As US Productivity decreases, US Construction Costs continue to increase resulting in a reinforcing loop. Contrarily, the Foreign Order Book has benefited from the cost differential. As more work has gone overseas to the Japanese and the Koreans, their productivity has greatly improved. The ability to practice modern shipbuilding techniques on commercial ships has provided the foreign yards with a huge advantage. Having more work in the yard allows the Foreign Overhead Rate to be spread over several contracts. As Foreign Productivity increases, Foreign Construction Costs continue to decrease resulting in another reinforcing feedback loop.
Figure 2-8 -Commercial Industrial Base
Commercial Industrial Base Foreign Subsidies US Subsidies
Foreign Pro uctivity
-Foreign Construction Costs
US Construction osts
Foreign Order Book + Foreign U ost Differential
US Productivity
US pyard Overhead
+- US Commercial Order Book
US shipbuilders are in a very difficult situation. As the military order book decreases, they have less business for which to compete. Without a significant order book, the future remains risky for many yards. Investments in yard improvements are put off until new contracts are signed. The productivity of American yards lags far behind the foreign yards. We employ more shipyard workers than any other nation in the world. Why then do we produce so few ships?
The improvements will come to US Productivity only if work can be generated on which to learn modern practices. The US government has chosen to provide assistance to the airline industry and the automotive industry at different times during the past twenty years. These decisions were made because these industries represent vital national interest. Similarly, the shipbuilding industry represents a vital national interest. The shipyards are now looking to the Japanese to help improve shipbuilding processes. An NSRP study identified several items as weaknesses in the way American yards build ships when compared to foreign yards. Technology transfers have been attempted with foreign yards to attempt to make up the shortfalls in new designs and technology. Instituting a change in the management of the construction process will take an even greater effort.
If the Affordability Crisis is allowed to continue, the Navy will not be able to buy the necessary hardware to meet its commitments or adequately protect its personnel. US Shipbuilders will not be competitive in the world market to win commercial ship
contracts. If they are forced to rely on the Navy as their sole customer several of the US yards may be forced to close by the year 2000.
Looking at all of the loops of the Affordability Crisis simultaneously, we see that there are many ways to reduce the cost of Navy ships. Not all of the of the variables involved in this problem have bee discussed or even thought about. Some of these suggestions may not be realistic in today's political environment. We could, for instance, force the under utilized shipyards out of business by denying them Navy contracts. The yards that have work should be fully loaded with work to increase learning on the contracts available. The representatives to Congress from the states these yards are located may have a difficult time letting a major industry, like shipbuilding, with many well paying jobs leave their state. Congressmen have terms of 2 years. The real benefit of reducing under utilized shipbuilding capacity will not be realized on a national for several years after the closing. It may never be felt on the local level.
Another suggestion could be to re-assess Navy commitments around the world. If we did not need to commit naval forces around the world, the required Military Capability of Navy Ships could be reduced. This would immediately reduce the amount of money we spend on ships. It would also act on the Arms Race Dynamic by reducing the Pressure for Reciprocating Capability. In the long term it may have the desired result of reducing the Actual Threat. The problem is that higher authority sets the commitments for the Navy. Reducing the international profile of our Navy may have the desired effect of reducing the amount of money we spend on ships. It may also indicate to leaders of
countries not so friendly to the US that the time has come to push their own national agenda.
The strength of each of the loops needs to be determined using historical data. It may be impossible for improvements in the Commercial Industrial Base loop to come anywhere near reducing the cost of combatant ships to a significant degree. The push for new technology may make this loop inconsequential. Is it more cost effective to subsidize the construction of commercial ships in this country hoping to reap some productivity gains or to directly invest in new technology for Navy ships? Many experts say building a warship is an entirely different process from building a commercial ship. By modeling the Affordability Crisis in greater detail, the insights needed to make good decisions about investments in Navy shipbuilding could be made. Without the tools to properly address all the aspects of shipbuilding, we may wastefully invest in the wrong loop.
Another suggestion that will be further pursued further in this paper is to fund the construction of high performance commercial ships directly. These ships are more similar to combatant ships in their construction than typical break bulk, container or product carriers. The government would fund the construction and then lease them to commercial shippers at market rates. The government will need to replace the aging Ready Reserve Fleet in the next ten years anyway. Why not make these ships commercially viable? The Department of Defense could use these commercial ships as Sealift assets in time of war. Commercial ship operators could use the superior capability
of these ships in peacetime. The increased Commercial Order Book would stimulate increases in US Shipyard Productivity. It would also act to reduce US Shipyard Overhead. Both of these would act to eventually reduce the cost of building Navy ships.
The time has come to make smarter use of government assets concerning US Shipbuilding. Several initiatives are underway in the Navy to improve the acquisition process. More must be done than merely putting band aids on the problem. An entirely new way of doing business must be pursued if US Shipbuilders are to reclaim a market in which they once dominated. In the next section, several acquisition reform programs will be discussed. The initiatives aimed at stimulating commercial shipbuilding in this country including MARITECH, NSRP and the Mid Term Sealift Technology Development Program will also be reviewed in the context of the Affordability Crisis. Questions that should be asked include what loops do these programs effect and what is the magnitude of the contribution they will make? By taking a more systematic approach, we can look at these programs from a different perspective.
2.2 Acquisition Reform
The goal of Acquisition Reform is cost reduction through adoption of best commercial practices and streamlining advanced technology insertion. The process of building a ship for the Navy is vastly different from building a commercial ship. Additionally, the product development cycle time of a Navy ship (10-15 years) can be two to three times the period required to develop a new commercial ship design.
Determining what technology will go into a ship 15 years in the future is an incredibly risky task. The product development process and the cycle time must change if the Navy wants to reduce the cost of buying ships. In order for the US Navy to take advantage of best commercial practices, a viable commercial industrial base needs to exist.
This section examines several of the acquisition reform programs, COTS and Standards and Specifications Reform, and the ATC program. These programs will then be viewed in the context of the Affordability Crisis to determine which dynamic loop they affect.
2.21 - Commercial Off The Shelf (COTS)
The Cold War forced the military to push for better and better technology at any expense. Huge amounts of money were expended to develop the technology that would allow the US military to maintain a tactical advantage. To address specific military requirements for products a system of Military Specifications and Standards (MILSPEC and MILSTD) were developed. The standards ensured the product met all requirements of the military. Many commercial applications grew out of this Defense initiated research program. In many cases, the commercial applications became more capable and less expensive as they went through several generations of product development in the private sector.
In the past few years, the technology trend has reversed itself for many products. For example, the military no longer drives the push for smaller electronic components or
faster microprocessors. Commercial products are demanding faster data transfer rates and more computing power than most military applications. The Navy, however, has been stuck with the requirements of a MILSPEC product that may be less capable and cost much more than the commercial product. The COTS program calls for increased use of commercially available equipment. This allows the Navy to take advantage of the cost savings from new technologies developed in the private sector. Clearly all the needs of the Navy can not be met by the commercial sector. Commercial products in general are not designed to go to war. However, as much of the common architecture as is feasibly possible should be bought "off the shelf."
COTS will help to improve the Affordability Crisis. It reduces the cost of adding Required Military Capability. By choosing a commercially viable product, the cost of research and development associated with putting that piece of technology on a ship is greatly reduced. When upgrades are required, a standard commercial interface will usually allow a quick transition to the next version. For a military upgrade, the old system more times than not will need to be torn out and replaced with a new unit. By using more commercially available equipment, the development and acquisition costs of Navy ships will be reduced.
2.22 Standards and Specifications
The Department of Defense has relied in the past on MILSPEC and MILSTD to describe exactly what it needs for a certain applications. Standards have been used to ensure the equipment meets all the rigors of a military environment. Many of the Standards and Specifications have been "written in blood" of sailors who relied on