HAL Id: hal-02950864
https://hal.archives-ouvertes.fr/hal-02950864
Submitted on 28 Sep 2020HAL is a multi-disciplinary open access archive for the deposit and dissemination of sci-entific research documents, whether they are pub-lished or not. The documents may come from teaching and research institutions in France or
L’archive ouverte pluridisciplinaire HAL, est destinée au dépôt et à la diffusion de documents scientifiques de niveau recherche, publiés ou non, émanant des établissements d’enseignement et de recherche français ou étrangers, des laboratoires
Permeability profiles across the crust-mantle sections in
the Oman Drilling Project inferred from dry and wet
resistivity data
Ikuo Katayama, Natsue Abe, Kohei Hatakeyama, Yuya Akamatsu, Keishi
Okazaki, Ole Ulven, Gilbert Hong, Wenlu Zhu, Benoit Cordonnier,
Katsuyoshi Michibayashi, et al.
To cite this version:
Ikuo Katayama, Natsue Abe, Kohei Hatakeyama, Yuya Akamatsu, Keishi Okazaki, et al.. Permeabil-ity profiles across the crust-mantle sections in the Oman Drilling Project inferred from dry and wet resistivity data. Journal of Geophysical Research : Solid Earth, American Geophysical Union, 2020, 125 (8), pp.e2019JB018698. �10.1029/2019JB018698�. �hal-02950864�
Permeability profiles across the crust-mantle sections in the Oman
1Drilling Project inferred from dry and wet resistivity data
23
Ikuo Katayama1*, Natsue Abe2, Kohei Hatakeyama1, Yuya Akamatsu1, Keishi Okazaki3,
4
Ole Ivar Ulven4, Gilbert Hong5, Wenlu Zhu6, Benoit Cordonnier4, Katsuyoshi
5
Michibayashi7, Marguerite Godard8, Peter Kelemen9, and The Oman Drilling Project
6
Phase 2 Science Party 7
8
1
Department of Earth and Planetary Systems Science, Hiroshima University, Hiroshima
9
739-8526, Japan
10
2
Mantle Drilling Promotion Office, MarE3, JAMSTEC, Kanagawa 236-0001, Japan
11
3
Kochi Institute for Core Sample Research, JAMSTEC, Kochi 783-8502, Japan
12
4
Department of Geosciences, University of Oslo, Oslo 0316, Norway
13
5
Earth and Environmental Sciences, Seoul National University, Seoul 151-747, Korea
14
6
Department of Geology, University of Maryland, Maryland 20742, USA
15
7
Department of Earth and Planetary Sciences, Nagoya University, Aichi 464-8602,
16
Japan
17
8
Géosciences Montpellier, CNRS, Université de Montpellier, Montpellier 34095,
18
France
19
9
Lamont Doherty Earth Observatory, Columbia University, New York 10964, USA
20 21
*Corresponding: Ikuo Katayama (Hiroshima University, Japan) 22
E-mail: [email protected], Tel: +81-82-424-7468, Fax: +81-82-424-0735 23
24
Abstract
25
Permeability profiles in the crust-mantle sequences of the Samail ophiolite were 26
constructed based on onboard measurements of the electrical resistivity of cores 27
recovered during the Oman Drilling Project. For each sample, we measured dry and 28
brine-saturated resistivity during the description campaign on the drilling vessel Chikyu. 29
Owing to the conductive brine in the pore space, wet resistivity is systematically lower 30
than dry resistivity. The difference between dry and wet resistivity is attributed to the 31
movement of dissolved ions in brine that occupies the pore space. We applied effective 32
medium theory to calculate the volume fraction of pores that contribute to electrical 33
transport. Using an empirical cubic law between transport porosity and permeability, we 34
constructed permeability profiles for the crust-mantle transition zone and the 35
serpentinized mantle sections in the Samail ophiolite. The results indicate that: (1) the 36
gabbro sequence has a markedly lower permeability than the underlying mantle 37
sequence; (2) serpentinized dunites have higher permeability than serpentinized 38
harzburgites; and (3) discrete sample permeability is correlated with ultrasonic velocity, 39
suggesting that the permeability variations predominately reflect crack density and 40 geometry. 41 42 Key Points 43
Brine-saturated resistivity is systematically lower than dry resistivity, with the 44
differences attributed to the volume fraction of pores. 45
Permeability through the crust-mantle sequences was modeled using the effective
46
medium theory and resistivity data. 47
The serpentinized dunite sequence is characterized by higher permeability than the
48
overlying gabbro and underlying serpentinized harzburgite sequences. 49
50 51
Plain Language Summary
52
Aqueous fluids that circulated beneath the seafloor play an important role in heat 53
transfer, chemical exchange, and microbial activity in the oceanic lithosphere. The 54
Oman Drilling Project was successful in obtaining continuous drill cores through the 55
crust-mantle sequences in the Samail ophiolite, where the paleo-oceanic basement was 56
thrust onto the continental crust in the Late Cretaceous. In this study, we constructed 57
profiles of permeability across the crust-mantle sections using the effective medium 58
theory and resistivity data, which provide insights into fluid circulation in the oceanic 59
lithosphere. The results indicate higher permeability in the uppermost mantle sequence 60
between the crust and the underlying mantle, suggesting that present-day fluid transfer 61
is predominant at the crust-mantle boundary. Although the fluid flow and chemical 62
reactions are likely coupled, the high permeability could promote the transformation of 63
crust-mantle materials and hence the recycling of water into the mantle. Application of 64
this technique to forthcoming deep drilling projects through the Mohorovičić 65
discontinuity (Moho) and into the upper mantle may provide insights into the 66
permeability structure and fluid circulation system in the oceanic lithosphere. 67
68 69
1. Introduction
70
Permeability is a key control on heat and chemical exchange in the oceanic 71
lithosphere, as well as microbial activity in the sub-seafloor (e.g., Stein and Stein, 1994; 72
Fisher, 1998; Furnes et al., 2001). In investigations based on ocean drilling projects, the 73
permeability is often inferred from resistivity data because electrical transport at the 74
crustal depths is controlled mainly by fluid flow. This approach uses an empirical 75
relationship between resistivity and porosity, such as Archie’s law (e.g., Gueguen and 76
Palciauskas, 1994), and models the permeability from resistivity logging data and/or 77
resistivity measurements of recovered core samples (e.g., Becker et al., 1982; Anderson 78
et al., 1985; Carlson, 2011; Slagle and Goldberg, 2011). Archie’s law is valid for a 79
conducting phase that saturates a non-conducting matrix. However, when the matrix has 80
a significant conductivity, the Archie’s law is no longer applicable (Glover et al., 2000). 81
In serpentinized ultramafic sequences, hydration reactions are commonly associated 82
with the production of magnetite, which is a highly conductive material. As a result, the 83
conductivity of the serpentinized matrix varies with the degree of hydration and 84
chemical exchanges (e.g., Stesky and Brace, 1973). 85
We carried out systematic measurements of dry and wet resistivity on core samples 86
collected during the Oman Drilling Project from the crust to mantle of the Samail 87
ophiolite. Using effective medium theory (e.g., Mavko et al., 2009), we calculated the 88
permeability based on the brine-saturated and matrix resistivities, and determined the 89
relative changes of permeability across crust-mantle sections in the Samail ophiolite. 90
We show that this approach can be used to construct a first-order permeability profile 91
during oceanic drilling programs, although the permeability can be heterogeneous in the 92
oceanic lithosphere and scaling effects need to be evaluated. 93
94
2. Core samples and methods
95
The Oman Drilling Project obtained nine diamond-cored boreholes through the 96
Samail ophiolite from the dike-gabbro transition to the uppermost mantle (Fig. 1). The 97
total cumulative drilled core length is 5458 m with ~100% core recovery (Teagle et al., 98
2018; Kelemen et al., 2018). In this study, we focused on three boreholes (CM1A, BA1B, 99
and BA4A) that are each ~300-400 m long. Hole CM1A samples the crust-mantle 100
transition from layered gabbros through dunites into harzburgites of the upper mantle 101
sequences. Hole BA1B comprises dunite (upper section) and harzburgite (lower section) 102
cut by numerous mafic dikes. Hole BA4A consists dominantly of dunite with minor 103
harzburgite and is crosscut by abundant mafic dikes. The mantle sequences are highly 104
altered, with >70% serpentinization, and contain few relicts of primary olivine and 105
orthopyroxene. The recovered core samples were systematically analyzed on the drilling 106
vessel Chikyu during the description campaigns in 2017 and 2018, including 107
mineralogical, geochemical, structural, and geophysical analyses (Kelemen et al., 2018). 108
Electrical resistivity, ultrasonic velocity, bulk/grain density, porosity, and thermal 109
conductivity were measured on selected discrete samples (Abe et al., 2018). 110
The core samples were cut into ~2 2 2 cm cubes, in which the x- and
111
y-directions were perpendicular and parallel to the split surface of the working halves, 112
respectively, and the z-direction was the down-hole axis. For the wet measurements, 113
samples were saturated with NaCl solution (3.5 g/L), equivalent to the salinity in 114
borehole water measured in the field (Paukert et al., 2012). The resistivity was 115
measured in three orthogonal directions using an Agilent 4294A Procession Impedance 116
Analyzer with a set of two stainless steel electrodes. Measurements were carried at 117
laboratory temperatures of 22.5 to 23.3C, resulting in a temperature-induced resistivity
118
variation of ~1%, which is broadly equivalent to the accuracy of sample dimensions. 119
Two paper filters soaked in brine for wet measurements and two stainless steel mesh 120
filters for dry measurements were placed between the steel electrodes and sample cube 121
on its top and bottom sides to enhance coupling. The magnitude (|Z|) and phase angle 122
(θ) of the complex impedance were measured at 25 kHz across the array from 40 Hz to 123
10 MHz. The resistivity was calculated from the sample impedance, length, and 124
cross-sectional area in each orientation. Blank tests yielded ~20 k m, which is the
125
upper limit of the resistivity measurements. The detailed methodology of the resistivity 126
measurements was described by Hatakeda et al. (2015). 127
128
3. Resistivity data
The electrical resistivity results from Holes CM1A, BA1B and BA4A are shown as 130
a down-hole plot in Fig. 2. Circles indicate the averaged resistivity, and bars represent 131
the variation in the three orthogonal directions. Although some samples exhibit large 132
variations with measurement orientations, the resistivity anisotropy is relatively weak in 133
each borehole and there are no systematic variations with orientation (Fig. 3). Dry 134
resistivity varies from 26 m to 13 k m in Hole CM1A, 525 m to 18 k m in Hole
135
BA1B, and 952 m to 15 k m in Hole BA4A (the geometric mean and standard
136
deviation of each sequence are listed in Table 1). Although the resistivities in the dry 137
measurements nearly reached the upper limit of the measurement system, the large 138
variations can be attributed to mineralogical and textural variations, such as the 139
occurrence and connectivity of conductive phases. Wet resistivity varies from 2.5 m
140
to 7.7 k m in Hole CM1A, 13 m to 12 k m in Hole BA1B, and 48 m to 6.4 k
141
m in Hole BA4A, and is systematically lower than the dry resistivity in each borehole 142
(Table 1). 143
The gabbro sequence has a nearly constant and high resistivity, with occasional low 144
resistivity related to layers of wehrlite and dunite. In the mantle section, the 145
dunite-dominant sequence has a relatively low resistivity, consistent with the high 146
degree of alternation in dunite as compared to harzburgite. Mafic dikes in the upper 147
mantle section have a high resistivity, similar to similar lithologies in the gabbro 148
sequence. The brine-saturated resistivity generally shows trends similar to the dry 149
measurements, but is systematically lower than dry resistivity due to the presence of 150
conductive brine in the pore space (Fig. 2). The difference between wet and dry 151
resistivity is related to the pore volume and geometry, as discussed in the following 152 section. 153 154 4. Permeability profile 155
Given that the dry matrix has significant variations in resistivity, due in part to the 156
presence of variable amounts of magnetite associated with serpentinization, Archie’s 157
law is not applicable to these data. Therefore, we used the Hashin-Shtrikman upper 158
bound (e.g., Mavko et al., 2009) to estimate the volume fraction of pores that contribute 159
to electrical transport (termed “transport porosity”) as follows: 160
𝜎𝑒𝑓𝑓 = 𝜎𝑓(1 −3(1 − 𝜙)(𝜎𝑓− 𝜎𝑑𝑟𝑦)
3𝜎𝑓− 𝜙(𝜎𝑓− 𝜎𝑑𝑟𝑦))
where 𝜎𝑒𝑓𝑓, 𝜎𝑓, and 𝜎𝑑𝑟𝑦 are the effective, fluid, and dry conductivity (inverse of
161
resistivity), respectively, and 𝜙 is the transport porosity. The effective conductivity
162
corresponds to the wet measurement, and the fluid conductivity was set to 0.58 S/m 163
based in its salinity (Carmichael, 1982). Figure 4 shows profiles of the calculated 164
transport porosity in each borehole. The transport porosity inferred from the difference 165
between the brine-saturated and dry resistivities is generally lower than the bulk 166
porosity that was estimated from the moisture and density (MAD) analysis. Some 167
samples have an extremely high transport porosity because they have a low matrix 168
resistivity (i.e., high conductivity) that is close to the fluid resistivity. Moreover, if a 169
sample have a relatively small difference between wet and dry resistivity, then the 170
calculated transport porosity has a relatively large uncertainty. 171
There are several other models that describe multi-phase conducting mixtures. We 172
also applied a modified version of Archie’s law that incorporates the effect of matrix 173 resistivity, as follows: 174 𝜎𝑒𝑓𝑓 = 𝜎𝑑𝑟𝑦(1 − 𝜙)log(1−𝜙 𝑚)/log (1−𝜙) + 𝜎𝑓𝜙𝑚
where m is the cementation exponent (Glover et al., 2000). The results are almost 175
identical to the calculations using the Hashin-Shtrikman upper bound, if an exponent of 176
m = 1 is used, although the large exponent in the modified Archie’s law yields a higher
177
porosity that exceeds those inferred from the MAD analysis. 178
We then approximated an empirical relationship between transport porosity (𝜙) and 179
permeability (k), as follows: 180
𝑘 = 𝐴𝜙𝑛,
181
where A is a constant and the exponent n is related to pore geometry (e.g., Gueguen and 182
Palciauskas, 1994). A geometric exponent of n = 3 was used in our calculations, 183
because the pores are approximately planar cracks in these samples, as revealed by 184
ultrasonic measurements and structural observations during the onboard core 185
description (Abe et al., 2018; Kelemen et al., 2018). 186
To check and calibrate our calculations, we conducted a direct measurement of 187
permeability using an intra-vessel fluid flow apparatus, applying a constant pressure 188
gradient in the core sample (for details, see Katayama et al., 2012). This yielded a 189
permeability of 5.1 10-19 m2 for a dunite sample with 0.8% porosity inferred from the
190
resistivity data. This permeability is similar to those of low-temperature serpentinites 191
collected from the accretionary prism of the Mineoka belts, but slightly lower than those 192
of dredged samples from the ocean floors (Hatakeyama et al., 2017). Based on this 193
benchmarking test, we obtained A = 9.2 10-13, which was used to calculate
194
permeability from the transport porosity. Though it is treated as a constant, this term 195
may vary throughout the section, although the variation is usually less than one order of 196
magnitude (Carlson, 2011). Given that the permeability is proportional to the cube of 197
the porosity, the overall permeability profile is not sensitive to the constant term A, and 198
is sensitive to the transport porosity. 199
Figure 5 shows a down-hole plot of permeability in boreholes CM1A, BA1B, and 200
BA4A. Although the data are somewhat scattered, the calculated permeability clearly 201
increases from the gabbro to serpentinized dunite sequences, and then decreases from 202
the dunite to serpentinized harzburgite-dominated sequences in Hole CM1A. The 203
decrease in permeability from the dunite to harzburgite sequences is also observed in 204
Hole BA1B, and this trend is consistent with the relatively low permeability of the 205
harzburgite layers in Hole BA4A. In the crustal sections, wehrlite and dunite layers 206
locally exhibit high permeability and, in the mantle sections, the gabbroic dikes have 207
lower permeability than their surrounding ultramafic host rocks. The permeability 208
structure is also affected by fault zones, in which high permeability is associated with 209
the presence of abundant fractures. However, highly damaged samples from fault zones 210
were difficult to prepare for analysis, and we may overlook the presence of fracture 211
zones in these profiles. 212
It is important to note that permeability can be affected by many variables; 213
consequently, the modeled absolute values of permeability have large uncertainties. 214
However, the relative permeability changes are robust, because transport porosity is a 215
primary variable that reflects the electrical transport and fluid flow. 216
217
5. Relationship between permeability and velocity
218
The calculated permeability variations are caused primarily by the different pore 219
volumes and geometries in the analyzed core samples. Figure 6 shows the relationship 220
between the calculated permeability and P-wave velocity measured onboard during the 221
core description campaigns. The elastic wave velocity of the ultramafic rocks is 222
significantly lower than that of the gabbro and unaltered peridotite due to extensive 223
serpentinization. A negative correlation between permeability and velocity is observed 224
for the ultramafic rocks, whereby dunites are characterized by large permeability and 225
velocity variations as compared to harzburgites (Fig. 6). The gabbros exhibit a similar, 226
although weak, correlation that might reflect the limited velocity variations. In the Holes 227
504B and 1256D, a similar negative correlation between model permeability and 228
ultrasonic velocity has been reported based on logging data (Carlson, 2014). 229
Since the P-wave velocity of low-temperature serpentinite is ~5 km/s (e.g., 230
Christensen, 2004), the variations in ultrasonic velocity are potentially related to crack 231
density, as well as the degree of alteration. Violay et al. (2010) reported that resistivity 232
and velocity are also associated with microcracks in gabbro sampled in the Hole 1256D. 233
The development of a crack network significantly modifies the hydrological properties, 234
with theoretical models predicting that permeability is related to the fraction of crack, 235
crack density, and crack radius etc. (e.g., Simpson et al., 2003). This implies that 236
permeability variations obtained in this study are controlled primarily by damage in the 237
samples, possibly related to volume expansion during hydration reactions such as 238
serpentinization. Following from McDonald and Fyfe (1985) and O’Hanley (1992), 239
several recent papers have suggested that, once aqueous fluids access to rocks, the 240
volume change due to hydration can result in fracture development, maintaining or 241
increasing permeability and reactive surface in a positive feedback (e.g., Jamtveit et al., 242
2008; Rudge et al., 2010; Kelemen and Hirth, 2012; Ulven et al., 2014; Shimizu and 243
Okamoto, 2016; Zhu et al., 2016; Malvoisin et al., 2017; Zheng et al., 2018; Uno et al., 244
2019). 245
246
6. Comparison with a hydrological model and other oceanic drilling sites
247
In the Samail ophiolite, hydrological analyses have been undertaken using 248
stream-flow gauging and the chemical dilution method (Dewandel et al., 2005). These 249
approaches indicated that fluid flow is more efficient in gabbro and dolerite than in 250
peridotite. Although the hydrological results are different from the intrinsic permeability 251
inferred from our resistivity measurements, groundwater circulation in the hydrological 252
models is dominated by flow in a fissured near-surface horizon (<50 m depth). At such 253
depths, frequently observed joints and fractures are probably the main conduits for fluid 254
flow, while such features do not affect our resistivity measurements on discrete core 255
samples. 256
In the shallow oceanic crusts, in-situ permeability is often measured using borehole 257
packer tests, which indicate a decrease in permeability with depth down to ~10-17 m2 in
258
the upper crust (e.g., Fisher, 1998). This is generally consistent with electrical resistivity 259
logging data, whereby the apparent resistivity increases significantly from pillow lavas 260
to sheeted dikes and to massive units (e.g., Becker, 1989). The sharp increase in 261
resistivity in the underlying dike unit has been interpreted as reflecting a significant 262
reduction in porosity that limited hydrothermal circulation in the oceanic crust (Becker 263
et al., 1982). Carlson (2011) applied Archie’s law to the resistivity logging data 264
obtained from Holes 504B and 1256D, and suggested that the permeability decreases 265
from the pillow lavas (~10-14 m-2) to the sheeted dikes (~10-18 m-2).
266
Although Archie’s law can be applied to the mafic section of oceanic crust, due to 267
its nearly non-conductive matrix, it is not suitable for application to the mantle sequence 268
because of the sensitivity of matrix resistivity to the formation of magnetite associated 269
with serpentinization. We used effective medium theory to model the permeability in 270
crust-mantle sections in the Samail ophiolite. Our analysis yields permeabilities for the 271
gabbro cores of 10-19 to 10-21 m-2, which are slightly lower than those of the sheeted dike
272
unit in Hole 504B and 1256D. However, this range of permeability is consistent with 273
direct permeability measurements on gabbro core collected from Hole 1256D (Gilbert 274
and Bona, 2016). Our calculated permeabilities show a marked increase in the dunite 275
sequence. These samples are extensively altered, and the permeability in the dunite and 276
harzburgite sequences sampled by the Oman Drilling Project was likely modified during 277
serpentinization. 278
Although our core-scale measurements do not show a systematic correlation in 279
resistivity in the discrete orientations, recent active-source electromagnetic 280
measurements have shown a clear electrical anisotropy in the oceanic lithosphere, 281
whereby conduction at crustal depths is enhanced in a direction sub-parallel to the paleo 282
mid-oceanic ridge (Chesley et al., 2019). Fisher (1998) noted that the permeability of 283
oceanic crust varies extensively due to the presence of fractures, and cannot simply be 284
determined from core measurements. We agree with this caveat regarding the 285
scale-dependence of permeability, and thus the electrical resistivity in the oceanic 286
lithosphere. Nevertheless, our analysis shows that core-scale permeability varies with 287
lithology and structure. These data provide the first clue of the background intrinsic 288
permeability through altered oceanic crust into serpentinized mantle sequences. 289
290
7. Conclusions
291
We modeled the permeability across the crust-mantle sections sampled by the 292
Oman Drilling Project using dry and wet resistivity data and effective medium theory. 293
Although the absolute values of the calculated permeabilities are highly uncertain, the 294
relative permeability variations are robust. The dunite sequence has markedly higher 295
permeability than the overlying gabbro and underlying harzburgite sequences, which is 296
likely correlated with crack density and geometries, as well as the degree of alteration. 297
The proposed Mohole-to-Mantle (M2M) project aims to drill through the Moho and into 298
the upper mantle using the riser drilling vessel Chikyu (e.g., Umino et al., 2012). 299
Application of our technique to core samples, as well as down-hole geophysical logging 300
data, in this forthcoming project will provide insights into the permeability structure and 301
fluid circulation system in the oceanic lithosphere. 302
303
Acknowledgements
304
We thank the science party of the Oman Drilling Project, and all those who 305
conducted the drilling and supported the description campaign at Chikyu. We also thank 306
Al-Amri Salim for assistance with the resistivity measurements. Comments from two 307
anonymous reviewers greatly improved the manuscript. This study was supported by 308
the Japan Society for the Promotion of Science (16H06347, 18H01321, and 18H03733). 309
The data availability is underway (GeoPass), which will be updated before publication. 310
311
References
312
Abe, N., Okazaki, K., Katayama, I., Hatakeyama, K., Ulven, O. I., Hong, G., Zhu, W., 313
Cordonnier, B., Akamatsu, Y., Michibayashi, K., Takazawa, E., Godard, M., 314
Teagle, D. A. H., Kelemen, P. B., Matter, J. M., Coggon, J. A., & The Oman 315
Drilling Project Phase II Science Party (2018). Initial report of physical property 316
measurements, ChikyuOman 2018: Crust-Mantle boundary and the mantle section 317
from ICDP Oman Drilling Project Phase II. AGU Fall Meeting, V13E-0150, 318
Washington D.C. USA. 319
Anderson, R., Zoback, M., Hickman, S., & Newmark, R. (1985). Permeability versus 320
depth in the upper oceanic crust: In-situ measurements in DSDP Hole 504B, 321
eastern equatorial Pacific. Journal of Geophysical Research, 90, 3659–3669. 322
doi:10.1029/JB090iB05p03659 323
Becker, K. (1989). Measurements of the permeability of the sheeted dikes in Hole 324
504B, ODP Leg 111. Proceedings of Ocean Drilling Program Scientific Results, 325
111, 317–325. doi:10.2973/odp.proc.sr.111.156.1989
326
Becker, K., Von Herzen, R., Francis, T., Anderson, R., Honnorez, J., Adamson, A., et 327
al. (1982). In situ electrical resistivity and bulk porosity of the oceanic crust 328
Costa Rica Rift. Nature, 300, 594–598. doi.org/10.1038/300594a0 329
Carlson, R. L. (2011). The effect of hydrothermal alteration on the seismic structure 330
of the upper oceanic crust: Evidence from Holes 504B and 1256D. Geochemistry, 331
Geophysics, Geosystems, 12, Q09013, doi:10.1029/2011GC003624
332
Carlson, R. L. (2014). The influence of porosity and crack morphology on seismic 333
velocity and permeability in the upper oceanic crust. Geochemistry, Geophysics, 334
Geosystems, 15, 10–27. doi:10.1002/2013GC004965
335
Carmichael, R.S. (1982). Handbook of Physical Property of Rocks, CRC Press, Boca 336
Raton, vol. 1. 337
Chesley, C., Key, K., Constable, S., Behrens, J. P., & MacGregor, L. M. (2019). 338
Crustal cracks and frozen flow in oceanic lithosphere inferred from electrical 339
anisotropy. Geochemistry, Geophysics, Geosystems, 20, 5979–5999.
340
doi.org/10.1029/2019GC008628 341
Dewandel, B., Lachassagne, P., Boudier, F., Al-Hattali, S., Ladouche, B., Pinault, J. L., 342
& Al-Suleimani, Z. (2005). A conceptual hydrogeological model of ophiolite 343
hard-rock aquifers in Oman based on a multiscale and a multidisciplinary 344
approach. Hydrogeology Journal, 13, 708–726. doi:10.1007/s10040-005-0449-2 345
Fisher, A. T. (1998). Permeability within basaltic oceanic crust. Reviews of Geophysics, 346
36, 143–182. doi.org/10.1029/97RG02916
347
Furnes, H., Muehlenbachs, K., Torsvik, T., Thorseth, I. H., & Tumyr, O. (2001). 348
Microbial fractionation of carbon isotopes in altered basaltic glass from the 349
Atlantic Ocean, Lau Basin and Costa Rica Rift. Chemical Geology, 173, 313–330. 350
doi.org/10.1016/S0009-2541(00)00285-0 351
Gilbert, L. A., & Bona, M. L. (2016). Permeability of oceanic crustal rock samples 352
from IODP Hole 1256D. Geochemistry, Geophysics, Geosystems, 17, 3825–3832, 353
doi:10.1002/2016GC006467 354
Glover, P. W., Hole, M. J., & Pous, J. (2000). A modified Archie’s law for two 355
conducting phases. Earth and Planetary Science Letters, 180, 369–383. 356
doi.org/10.1016/s0012-821x(00)00168-0 357
Gueguen, Y., & Palciauskas, V. (1994). Introduction to the Physics of Rocks, 294 pp., 358
Princeton Univ. Press, Princeton, N.J. USA. 359
Hatakeda, K., Lin, W., Goto, T., Hirose, T., Tanikawa, W., Hamada, Y., & Tadai, O. 360
(2015) Experimental examination for electrical resistivity measurement using the 361
alternative current impedance method. JAMSTEC Report of Research and 362
Development, 20, 41–50. doi.org/10.5918/jamstecr.20.41 (Japanese with English
363
abstract) 364
Hatakeyama, K., Katayama, I., Hirauchi, K., & Michibayashi, K. (2017). Mantle 365
hydration along outer-rise faults inferred from serpentinite permeability. Scientific 366
Reports, 7, 13870. doi.org/10.1038/s41598-017-14309-9
367
Jamtveit, B., Malthe‐Sørenssen, A., & Kostenko, O. (2008). Reaction enhanced 368
permeability during retrogressive metamorphism. Earth and Planetary Science 369
Letters, 267, 620–627. doi.org/10.1016/j.epsl.2007.12.016
370
Katayama, I., Terada, T., Okazaki, K., & Tanikawa, W. (2012). Episodic tremor and 371
slow slip potentially linked to permeability contrasts at the Moho. Nature 372
Geoscience, 5, 731–734. doi.org/10.1038/ngeo1559
373
Kelemen, P. B., & Hirth, G. (2012). Reaction-driven cracking during retrograde 374
metamorphism: Olivine hydration and carbonation. Earth and Planetary Science 375
Letters, 345, 81–89. doi.org/10.1016/j.epsl.2012.06.018
376
Kelemen, P. B., Bach, W., Evans, K., Eslami, A., Farough, A., Hamada, M., 377
Ichiyama, Y., Kahl, W., Matter, J. M., Pezard, O., Vankeure, A., Godard, M., 378
Michibayashi, K., Choe, S., & Coggon, J. A. (2018). Correlated variation in vein 379
type, vein frequency, pH, oxygen fugacity and depth in Oman Drilling Project 380
Holes BA1B, BA3A and BA4A. AGU Fall Meeting, V12B-03, Washington D.C. 381
USA. 382
MacDonald, A. H., & Fyfe, W. S. (1985). Rate of serpentinization in seafloor 383
environments. Tectonophysics, 116, 123–135.
384
doi.org/10.1016/0040-1951(85)90225-2 385
Malvoisin, B., Brantut, N., & Kaczmarek, M.‐A. (2017). Control of serpentinisation 386
rate by reaction‐induced cracking. Earth and Planetary Science Letters, 476, 387
143–152. doi.org/10.1016/j.epsl.2017.07.042 388
Mavko, G., Mukerji, T., & Dvorkin, J. (2009). The Rock Physics Handbook: Tools 389
for Seismic Analysis of Porous Media, 524 pp., Cambridge Univ. Press,
390
Cambridge, U.K. 391
Nicolas, A., Boudier, F., Ildefonse, B., & Ball, E. (2000). Accretion of Oman and 392
United Arab Emirates ophiolite – discussion of a new structural map. Marine 393
Geophysical Researches, 21, 147–180. doi.org/10.1023/A:102671802695
394
O’Hanley, D. S. (1992). Solution to the volume problem in serpentinization. Geology, 395
20, 705–708. doi.org/10.1130/0091‐7613 396
Paukert, A. N., Matter, J. M., Kelemen, P. B., Shock, E. L., & Havig, J. R. (2012). 397
Reaction path modeling of enhanced in situ CO2 mineralization for carbon 398
sequestration in the peridotite of the Samail Ophiolite, Sultanate of Oman. 399
Chemical Geology, 330–331, 86–100. doi.org/10.1016/j.chemgeo.2012.08.013
400
Rudge, J. F., Kelemen, P. B., & Spiegelman, M. (2010). A simple model of reaction 401
induced cracking applied to serpentinization and carbonation of peridotite. Earth 402
and Planetary Science Letters, 291, 215–227. doi.org/10.1016/j.epsl.2010.01.016
403
Shimizu, H., & Okamoto, A. (2016). The roles of fluid transport and surface reaction 404
in reaction-induced fracturing, with implications for the development of mesh 405
textures in serpentinites. Contribution to Mineralogy and Petrology, 171, 406
doi:10.1007/s00410-016-1288-y 407
Simpson, G., Gueguen, Y., & Schneider, F. (2001). Permeability enhancement due to 408
microcrack dilatancy in the damage regime. Journal of Geophysical Research, 409
106, 3999–4016. doi.org/10.1029/2000JB900194
410
Slagle, A. L., & Goldberg, D. S. (2011). Evaluation of ocean crustal Sites 1256 and 411
504 for long-term CO2 sequestration. Geophysical Research Letters, 38, L16307. 412
doi:10.1029/2011GL048613 413
Stein, C. A., & Stein, S. (1994). Constraints on hydrothermal heat flux through the 414
oceanic lithosphere from global heat flow. Journal of Geophysical Research, 99, 415
3081–3095. doi:10.1029/93JB02222 416
Stesky, R. M., & Brace, W. F. (1973). Electrical conductivity of serpentinized rocks to 417
6 kilobars. Journal of Geophysical Research, 78, 7614–7621.
418
doi.org/10.1029/JB078i032p07614 419
Teagle, D. A. H., Kelemen, P. B., Matter, J. M., Templeton, A. S., & Coggon, J. A. 420
(2018). Introduction to the Oman Drilling Project. AGU Fall Meeting, V13E-0151, 421
Washington D.C. USA. 422
Ulven, O. I., Jamtveit, B., & Malthe-Sørenssen, A. (2014). Reaction-driven fracturing 423
of porous rock. Journal of Geophysical Research, 119, 7473–7486. 424
doi.org/10.1002/2014JB011102 425
Umino, S., Ildefonse, B., Kelemen, P. B., Kodaira, S., Michibayashi, K., Morishita, 426
T., Teagle, D. A. H., & the MoHole proponents (2012). MoHole to Mantle 427
(M2M). IODP Proposal 805-MDP,
428
http://www.iodp.org/proposals/active-proposals. 429
Uno, M., Kasahara, H., Okamoto, A., & Tsuchiya, N. (2019) Experimental 430
investigation of reaction-induced stress and permeability evolution in MgO–H2O
431
system. JpGU Meeting, SCG61-14, Makuhari, Japan. 432
Violay, M., Pezard, P. A., Ildefonse, B., Belghoul, A., & Laverne, C. (2010). 433
Petrophysical properties of the root zone of sheeted dikes in the ocean crust: A 434
case study from Hole ODP/IODP 1256D, Eastern Equatorial Pacific. 435
Tectonophysics, 493, 139–152. doi:10.1016/j.tecto.2010.07.013
436
Zheng, X., Cordonnier, B., Zhu, W., Renard, F., & Jamtveit, B. (2018). Effects of 437
confinement on reaction‐induced fracturing during hydration of periclase. 438
Geochemistry, Geophysics, Geosystems, 19, 2661–2672. 439
doi.org/10.1029/2017GC007322 440
Zhu, W., Fusseis, F., Lisabeth, H., Xing, T., Xiao, X., De Andrade, V., & Karato, S. 441
(2016). Experimental evidence of reaction-induced fracturing during olivine 442
carbonation. Geophysical Research Letters, 18, 9535–9543.
443
doi.org/10.1002/2016GL070834 444
445
Figure and Table captions
446
Fig. 1. Geological map of the southeastern massif of the Samail ophiolite (after Nicolas
447
et al., 2000) showing the drill site locations of the Oman Drilling Projects. The 448
colored units are the ophiolite sequence. The inset shows a map of the Arabian 449
Peninsula, in which the location of the main figure is indicated by the dashed 450
box. 451
Fig. 2. Down-hole plots of resistivity in the three boreholes (CM1A, BA1B, and BA4A),
452
and borehole stratigraphy. Blue and red circles indicate measurements under wet 453
and dry conditions, respectively. The data represent the averaged resistivities in 454
three orthogonal orientations, and the bars indicate the variations in the 455
measurement directions. 456
Fig. 3. Resistivity perturbations of dry and wet measurements in Hole BA1B.
457
Perturbations were calculated as (log𝑅𝑖− log𝑅̅)/log𝑅̅ , where 𝑅𝑖 is the
458
resistivity of each orientation and 𝑅̅ is the averaged resistivity of the three
459
orthogonal orientations. 460
Fig. 4. Profiles of transport porosity calculated from the wet and dry resistivities. The
461
data represent the averaged porosities in three orthogonal orientations, and bars 462
indicate the range of values in all measurement directions. Gray symbols 463
indicate the bulk porosity estimated from the moisture and density (MAD) 464
analyses during the description campaign (Abe et al., 2018), and are mostly 465
higher than the calculated porosity. 466
Fig. 5. Profiles of permeability calculated from resistivity data using the effective
467
medium theory. The data represent the averaged permeabilities in three 468
orthogonal orientations, and the bars indicate the variations in the measurement 469
directions. Gray lines are the 20 m averaged permeability profiles. 470
Fig. 6. Relationship between calculated permeability and P-wave velocity for gabbro,
471
dunite, and harzburgite from boreholes CM1A, BA1B, and BA4A. The gabbro 472
samples include olivine gabbro and rodingitized samples. The ultrasonic velocity 473
was measured with an acoustic transducer of 230 kHz. Bars on the discrete data 474
indicate the variations in the measurement orientations. Fitting curves are shown 475
for gabbroic and ultramafic rocks. 476
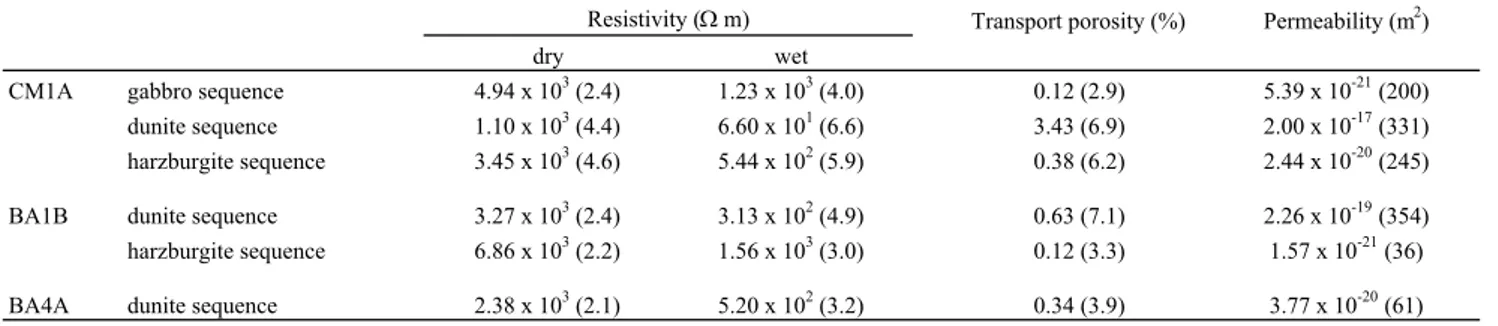
Table 1. Mean resistivity and calculated transport porosity and permeability in each
477
borehole. 478
23°00'
Gabbros & extrusives Peridotites Metamorphic sole Hawasina formation 0 20 40km 24°00' 58°00' 57°00' 58°00' 23°00' City/Town OmanDP drill site
Muscat Al Hajar Ibra Nizwa Samail Barka Rustaq Al Suwayq
CM1A BA1BBA4A
Figure 1
57°00' Iran Saudi Arabia Oman Yemen Arabian SeaCM1A
BA1B
BA4A
0 Resistivity (Ωm) 105 104 103 102 101 100 Resistivity (Ωm) 105 104 103 102 101 100 Resistivity (Ωm) 105 104 103 102 101 100 0 0 50 100 150 200 250 300 350 400 50 100 150 200 250 300 50 100 150 200 250 300 350 400Depth CAD (m) Depth CAD (m) Depth CAD (m)
wet dry Gabbro Major lithogies Fault Intrusive contact Magmatic intrusion Olivine Gabbro Dunite Harzburgite gabbro sequence dunite sequence harzburgite dominant dunite sequence harzburgite sequence
-0.4 -0.2 0 0.2 0.4 -0.4 -0.2 0 0.2 0.4 0 50 100 150 200 250 300 350 400
Resistivity perturbation Resistivity perturbation
Depth CAD (m)
BA1B
(dry) BA1B (wet)
x y z dunite sequence harzburgite sequence dunite sequence harzburgite sequence
Figure 3
CM1A BA1B BA4A
Porosity (%) Porosity (%) Porosity (%)
Depth CAD (m) Depth CAD (m)
Depth CAD (m) gabbro sequence dunite sequence harzburgite dominant dunite sequence harzburgite sequence 10 0 50 100 150 200 250 300 350 400 0 50 100 150 200 250 300 0 50 100 150 200 250 300 350 400 -4 10-2 100 102 10-4 10-2 100 102 10-4 10-2 100 102 Transport porosity
(calculated from resistivity) Bulk porosity
CM1A BA1B BA4A 0
Permeability (m2) Permeability (m2) Permeability (m2)
10-12 10-15 10-18 10-21 10-24 10-27 10-12 10-15 10-18 10-21 10-24 10-27 10-12 10-15 10-18 10-21 10-24 10-27 50 100 150 200 250 300 350 400 0 50 100 150 200 250 300 350 400 0 50 100 150 200 250 300
Depth CAD (m) Depth CAD (m)
Depth CAD (m) gabbro sequence dunite sequence harzburgite dominant dunite sequence harzburgite sequence
7.0 8.0 3.0 10-26 10-24 10-22 10-20 10-18 10-16 10-14 10-12 6.0 4.0 5.0
P-wave velocity (km/s)
Permeability (m
2)
Gabbro Dunite HarzburgiteFigure 6
VP = -0.176 log k +2.77 (R2 = 0.198) VP = -0.115 log k +2.99 (R2 = 0.475)Table 1. Mean resistivity and calculated transport permeability in each borehole
Transport porosity (%) Permeability (m2)
dry wet
CM1A gabbro sequence 4.94 x 10³ (2.4) 1.23 x 10³ (4.0) 0.12 (2.9) 5.39 x 10⁻²¹ (200) dunite sequence 1.10 x 10³ (4.4) 6.60 x 101 (6.6) 3.43 (6.9) 2.00 x 10⁻¹⁷ (331)
harzburgite sequence 3.45 x 10³ (4.6) 5.44 x 10² (5.9) 0.38 (6.2) 2.44 x 10⁻²⁰ (245) BA1B dunite sequence 3.27 x 10³ (2.4) 3.13 x 10² (4.9) 0.63 (7.1) 2.26 x 10⁻¹⁹ (354)
harzburgite sequence 6.86 x 10³ (2.2) 1.56 x 10³ (3.0) 0.12 (3.3) 1.57 x 10⁻²¹ (36) BA4A dunite sequence 2.38 x 10³ (2.1) 5.20 x 10² (3.2) 0.34 (3.9) 3.77 x 10⁻²⁰ (61)
*Mean values were calculated the geometric mean, and the number in parentheses represents the geometric standard deviation. Resistivity (W m)